
27th May 2026 07:00

The information contained within this announcement is deemed by the Company (Companies House registration number 08873361) to constitute inside information as stipulated under the Market Abuse Regulations (EU) No. 596/2014. With the publication of this announcement via a Regulatory Information Service, this inside information is now considered to be in the public domain.
27 May 2026
Tekcapital PLC
("Tekcapital", "the Company" or the "Group")
Results for the year ended 31 December 2025
Tekcapital plc (AIM: TEK), the UK intellectual property (IP) investment group focused on creating valuable companies from investing in university technologies that can improve people's lives, announces its audited results for the year ended 31 December 2025.
FINANCIAL PERFORMANCE
The Company reported a reduction in its Net Assets by US$15m in 2025 due primarily to unrealised depreciation[1] of its portfolio. This resulted in a loss after tax of US$17.1m vs a profit after tax of US$19.2m in 2024. Most of the unrealised depreciation was driven by the reduction in the share price of Microsalt plc, which has recovered a portion of its value post period-end.
In 2025 the Company further reduced its total annual expenses by ~7% from US$2.03m in 2024 to US$1.88m in 2025, marking its third consecutive year of expense reduction. Since 2023 the Company has reduced its total annual expenses by 34%.
· Net Assets US$55.1m (2024: US$70.1m) · NAV per share US$0.23 (2024: US$0.33) · Portfolio valuation US$46.9m (2024: US$61.5m) · Loss after tax: US$ 17.1m, resulting primarily from unrealised fair value decrease of our portfolio (2024: gain of US$19.2m). |
DR. CLIFFORD GROSS, EXECUTIVE CHAIRMAN SAID:
"While our portfolio recorded an unrealised depreciation of US$16.2m over the past year, the underlying commercial story is one of accelerating momentum. Our portfolio companies delivered exceptional revenue growth in 2025:
· Innovative Eyewear: +69%
· MicroSalt: +187%
· GenIP: +330%
· Guident: +862%, whilst continuing its diligent efforts to complete its planned U.S. IPO in 2026.
"This is the kind of commercial traction that ultimately drives shareholder value, and we expect Tekcapital's portfolio to build on this momentum and deliver meaningful growth in 2026.
"Our strategy is clear: grow net assets and returns on invested capital and return capital to shareholders via special dividends once material monetisations are achieved. We believe we are firmly on that path. With most of our core portfolio companies now publicly listed, the capital previously required to support them is being redeployed into new opportunities. We further expect substantial cash inflows over the next three years as our outstanding convertible loan notes are repaid, covering operating costs and giving us the flexibility to pursue the strongest opportunities ahead."
Additionally, Tekcapital was recognised with the 2025 Leadership in High-Value Intellectual Property Strategies Award (Global) by Capital Finance International.
Most of our portfolio companies achieved substantial operational progress during the year as demonstrated by growing sales and commercial traction.
· Guident Ltd ("Guident") continued to grow their sales pipeline in 2025, reaching six customers post year end. These customers include the Jacksonville Transportation Authority (JTA), the city of West Palm Beach, the city of Boca Raton, which Guident provides AV shuttle monitoring and teleoperation services via its RMCC platform, as well as Grupo LOCSA, Coastal Waste Recycling, and CP Group, to which Guident provides surveillance and security robot monitoring services. Guident progressed its integration of its remote monitoring and control software with several autonomous vehicle ("AV") shuttle partners, contributing to its already strong sales growth.
Following commercial traction and successful deployments of its Remote Monitor and Control Centre, Guident submitted a draft registration statement on Form S-1 with the Securities and Exchange Commission (the "SEC") relating to the proposed initial public offering. The initial public offering is expected to take place after the SEC completes its review process, subject to market and other conditions.
· MicroSalt plc ("Microsalt") continued its sales growth and announced that the company projected its 2026 sales to a total of US $7.0 million based on in-hand volume estimations and its current customer base, rising to more than US $15.0 million in 2027. The Company also strengthened its balance sheet through the December 2025 Subscription and Retail Offer of ~£1.7m, providing the Company with funding for increased production to support anticipated orders from leading snack manufacturers.
· Innovative Eyewear Inc ("Innovative Eyewear") continued to grow their sales in 2025 and strengthened their balance sheet. They set the foundation for more growth with strong relationships with big box stores throughout the U.S. consistent with their focus on product placement with large national retailers. The well received launch of the world's first smart safety eyewear, Lucyd Armor®, expanded Innovative Eyewear's sales further. After period-end, Innovative Eyewear received the Red Dot Award for its Lucyd Armor product. The Red Dot Design Award is widely regarded as one of the top-tier global design competitions. Its stature is comparable to the very best in the field and carries meaningful credibility with designers, manufacturers, and investors. Prior award winners have included leading companies like Apple, Dyson, Sony and BMW.
· GenIP plc ("GenIP")'s revenue accelerated as prepaid AI-powered analytical assessments were delivered, reaching US$408K for the 10 months to 31 October 2025 (up from US$126K in H1 2025), while gross margin increased to 27% from 18%, with further margin improvements targeted through new contracts and strategic partnerships.
· Belluscura plc ("Belluscura") experienced a severe financial downturn in late 2025 following the Chapter 7 bankruptcy filing of its wholly owned U.S. operating subsidiary, Belluscura LLC on 29 October 2025. Subsequent foreclosure and sale of the subsidiary's assets by its secured lender materially impaired the group's financial position. The parent company further disclosed that the subsidiary's bankruptcy constituted an event of default under its outstanding convertible loan notes, which it was unable to repay. Considering these developments, Belluscura plc announced its intention to appoint an administrator. Its nominated adviser subsequently resigned, and the company's admission to trading on the AIM market of the London Stock Exchange was cancelled on 2 December 2025. Tekcapital invested approximately US$2.0 million in the company and, over an approximately five-year period, monetized ~US$2.5 million through periodic sales of Belluscura common stock, representing a ~25% return on invested capital. Following the company's delisting, Tekcapital wrote down the remaining 8,378,057 shares it held in Belluscura to £nil.
PORTFOLIO REVIEW[2]
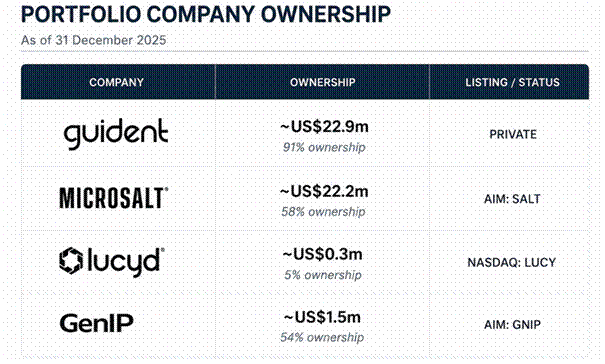
MicroSalt plc
MicroSalt is a leading manufacturer of full-flavour natural salt with approximately 50% less sodium. As of 31 December 2025, Tekcapital owned 58.26% of Microsalt plc.
INVESTMENT RATIONALE:
The food industry is focused on developing and providing better-for-you products that both taste good and help reduce sodium intake. Excess sodium consumption contributes to cardiovascular disease, a leading cause of premature death globally. The World Health Organization has indicated that reducing sodium consumption to 2,300 mg/day can save upwards of 2 million lives per year. To help address this problem, MicroSalt provides a patented, low-sodium salt that has all the flavour of salt with roughly half the sodium for topical applications such as crisps, pretzels, nuts, popcorn and other salty snacks, bakery products and precooked meals.
2025 DEVELOPMENTS:
· Announced that it had received increased North America volume projections from whom it describes as Customer 3, one of the world's largest food, soft drink and snack manufacturers. The volume projections for this product in North America indicate commencing rollout in Q2 2026 and resultant sales exceeding $5.0 million in 2026, expanding to US$11.0 million in 2027.
· Announced that the company is now projecting 2026 sales of US$7.0 million based on in-hand volume estimations and anticipated to increase to more than US$15.0 million in 2027.
· Announced a new strategic relationship with Daiya Foods, a global leader in dairy-free and plant-based innovation. MicroSalt has received an initial order of US$50k to begin production and its projected 2026 volume to approximately US$500k.
· Announced that the December 2025 Subscription and Retail Offer raised approximately £1.72 million to support increased production requirements to meet expected orders from leading snack manufacturers, new hires to support the Company's QSR and FSR initiatives, marketing, R&D and general working capital purposes.
· Received the Low Sodium Salt Technology of the Year 2025 award from Food Business Review and named #9 in the "Small but Mighty" category (companies under 50 employees) by Fast Company.

Innovative Eyewear Inc.
Innovative Eyewear is a developer of cutting-edge AI enabled smart eyewear, under the Lucyd®, Lucyd Armor®, Nautica®, Eddie Bauer® and Reebok® brands. True to its mission to Upgrade Your Eyewear®, its Bluetooth audio glasses allow users to stay ergonomically connected to their digital lives and are offered in hundreds of frame and lens combinations to meet the needs of the optical, sunglass, sport and safety eyewear markets.
As of 31 December 2025, Tekcapital owned ~5% of NASDAQ quoted Innovative Eyewear Inc.
Innovative Eyewear Inc. was the first developer of ChatGPT enabled smart eyewear under the Lucyd®, Nautica®, Eddie Bauer® and Reebok® brands and was the first eyewear brand to deliver prescription glasses with Bluetooth® technology in 2019. Their smart eyeglass frames help you stay connected safely and conveniently, by enabling many common smartphone tasks to be performed handsfree with Bluetooth®, voice assistants and GenAI.
INVESTMENT RATIONALE:
In the first 9 months of 2025, the National Highway Traffic Safety Administration (NHTSA) estimated that 27,365 people died in traffic crashes.[3] We believe that open ear audio found in Lucyd smart glasses can help pedestrians maintain situational awareness whilst walking, running and cycling as there is nothing in the ear canal blocking the sounds of adjacent traffic. According to a survey by The Vision Council, approximately 75% of Americans need some form of vision correction[4]. Advancements in Bluetooth technology have enabled it to be incorporated into traditional eyeglass form factors. Lucyd smart eyewear allows the wearer to forego headphones and use their glasses to listen to audio content and talk to others and digital assistants. As the speakers are open-ear, Lucyd smart glasses enables the wearer to stay connected to their digital life whilst helping to maintain situational awareness.
2025 DEVELOPMENTS:
· Innovative Eyewear Inc. (NASDAQ: LUCY) reported preliminary full-year 2025 sales of approximately US$2.7 million, a substantial increase of approximately 69% year-over-year from US$1.6 million in 2024.¹ Q4 2025 sales were approximately $1 million, up roughly 45% compared with Q4 2024. Growth was driven primarily by strong sales of the Lucyd Armor® smart safety glasses (launched October 2024) and the Reebok® Powered by Lucyd sport smart eyewear collection (launched April 2025).[5]
· In April 2025, Innovative Eyewear Inc. (NASDAQ: LUCY) launched Reebok Smart Eyewear, positioning the brand in the fast-growing smart glasses market. According to Citi Research, smart-glass market revenues could reach US$40 billion by 2030, growing at a 112% compound annual growth rate from 2024.[6]
· Announced a partnership with SmartBuyGlasses, a global online eyewear provider, to offer Reebok smart eyewear with prescription options and international shipping, enabling fast delivery of custom-lens frames to customers across its global markets.
· Reported significant progress in its European expansion strategy following successful participation at SILMO Paris 2025, one of the world's leading eyewear trade shows.
· Receipt of the Retailer's Choice Award for Lucyd Armor, at the National Hardware Show event in Las Vegas.

Guident Corp.
Guident Corp ("Guident") has developed and provides remote monitoring and control software services to improve safety of autonomous vehicles and robots. Guident's software incorporates artificial intelligence and advanced network technologies to minimize signal latency and improve the safety of autonomous vehicles.
As of 31 December 2025, Tekcapital owned ~ 91% of Guident Corp.
INVESTMENT RATIONALE:
Vehicles of all types are rapidly becoming electric and autonomous. Whilst some Autonomous Vehicles ("AVs") are significantly safer than traditional vehicles, there will still be mishaps and in most instances, there will be no vehicle operator present to help resolve these problems. Guident believes remote human interaction will be needed to address and help resolve many of these mishaps. Guident's remote monitoring and control centre monitors autonomous vehicles and robots, and when necessary, can provide additional support such as calling first responders, taking over control of the vehicle to move it out of harm's way as well as provide real-time communication with passengers and pedestrians. Currently, several states in the U.S., France, Germany, Switzerland and Japan require remote monitoring of AV's. Over time, Guident believes remote monitoring will be required in most jurisdictions where AVs and autonomous robots operate.
2025 DEVELOPMENTS:
· Announced the filing of a registration statement on Form S-1 with the U.S. Securities and Exchange Commission for a proposed initial public offering of its common stock in the United States.
· Announced the appointment of Michael Tessler to its Board of Directors, bringing more than three decades of technology and communications leadership experience, including serving as CEO of BroadSoft prior to its US$1.9 billion acquisition by Cisco Systems.
· Announced a signed agreement with the City of Boca Raton, Florida, to deploy an autonomous shuttle public transportation service operating on a 2.6-mile loop between Mizner Park and Royal Palm Place.
· Announced a partnership with Coastal Waste & Recycling Inc., a leading waste and recycling services provider across Florida, Georgia, and South Carolina, to deploy Guident's WatchBot™ solution for autonomous patrol validation, AI-driven inspections, and real-time safety alerts.
· Guident Achieved ISO/IEC 27001:2022 Certification, Strengthening Commitment to Cybersecurity and Data Protection.
GenIP plc
GenIP Ltd ("GenIP") provides generative artificial intelligence analytic services to help organisations assess and commercialise new discoveries. They offer expert human technical review combined with GenAI algorithms to rapidly provide insightful and verified solutions.
As of 31 December 2025, Tekcapital owned 53.86% of GENIP plc.
INVESTMENT RATIONALE
The generative AI market is experiencing rapid growth, with estimates ranging from approximately US$37.9 billion[7] to US$103.6 billion[8] in 2025 and projected to grow at compound annual growth rates of 34-46% over the coming decade. GenIP (LSE: GNIP) provides two complementary services, enhanced with generative AI, to help organizations evaluate and commercialize new technologies: Invention Evaluator, which combines expert human technical review with AI-driven proprietary software to rapidly assess the market potential of innovations; and Vortechs, which provides executive recruitment services to identify experienced leaders with a track record in technology commercialization. The incorporation of GenAI and large language models into these services is designed to help companies, research institutions, and venture funds mitigate adverse selection, improve returns on invested capital, and more efficiently deploy capital to produce commercially viable businesses that contribute to the quality of life of the customers they serve.
The company has delivered more than 5,800 evaluation reports to over 300 research institutions and corporations worldwide and has recently expanded its offerings to include a Competitive Intelligence Report (in use by a Big Four accounting firm) and an Invention Validator product for market-adoption testing.[9]
2025 DEVELOPMENTS:
· Secured a US$0.35M contract with a research organization in Saudi Arabia for the delivery of 400 GenAI-enhanced analytical assessments and technology commercialization consulting services.
· Expanded into Chile through an engagement with a leading research institution for 30 analytical assessment orders, bringing the total value of Invention Evaluator orders since the October 2024 IPO to over US$850K.
· Secured a US$65K contract with a Singapore-based research institute to deliver 100 GenAI-enhanced analytical assessments, supporting expansion into Asian markets through technology transfer sponsorships, with fulfilment expected within the current financial year.
· Revenue accelerated as prepaid AI-powered analytical assessments were delivered, reaching US$408K for the 10 months to 31 October (up from US$126K in H1 2025), while gross margin increased to 27% from 18%, with further margin improvements targeted through new contracts and strategic partnerships.
· Initiated transition from a project-based service provider to a scalable AI-powered innovation platform, positioning the company for accelerated revenue growth and broader market penetration.
POST PERIOD-END HIGHLIGHTS
On 10 February 2026, Tekcapital plc raised US$2.05 million (£1.5 million) before expenses, through the issue of 18,750,000 new ordinary shares at a price of 8 pence per share.
On 7 January 2026 Innovative Eyewear Inc announced record-breaking 65% annual sales growth for FY 2025. The Company believes this performance reflects growing awareness of their brand portfolio and increasing demand for eyewear that integrates smart features alongside vision correction and protection, and the ability to easily use their eyewear with several leading AI platforms.
On 14 May 2026 Innovative Eyewear Inc also announced it achieved Q1 2026 sales of $0.77 million, an increase of approximately 70% over Q1 2025. This marks the highest first-quarter revenue in the Company's history and extends its progress of year-over-year quarterly revenue growth to more than eleven consecutive quarters.
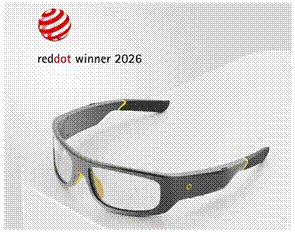
Innovative Eyewear received the prestigious Red Dot Design Award for the design of its Lucyd Armor product.
The Company also believes its efforts in 2025 to build a robust global fulfilment network have helped to position the Company for faster scale up across hardware stores, retail, and optical chains worldwide.[10] The Company also reported that it is beginning a pilot product launch with a top 5 national optical retailer in the US, and is in negotiations with a major Canadian optical chain for a rollout of Lucyd Armor® in approximately 300 stores. In addition, A leading energy company is conducting a pilot of Lucyd Armor® for workforce communication applications.
Microsalt announced its 2025 sales exceeded the Board's original revenue expectations of US$2.0 million, increasing by 187% year-on-year to US$2.14 million (2024: US$745k). The Company continues to project 2026 sales to total US$7.0 million based on in-hand volume estimations and its current customer base, rising to more than US$15.0 million in 2027. Also in early 2026, Microsalt announced it has entered into a formal Joint Development Agreement ("JDA") with Customer 3, one of the world's largest food, soft drink and snack manufacturers (the "Partner").
On 5 March 2026, Guident announced that the 5th Annual Autonomous Vehicle Conference Announced Guident Corp., in partnership with the Jacksonville Transportation Authority, will take place on 29 May 2026, at the Boca Raton Innovation Campus (BRiC).[11]
Guident completed a private placement of US$2m senior secured convertible loan note on May 1, 2026, as they continue to work diligently to complete their Initial Public Offering in 2026.
Vesari Inc ("Vesari")
On 22 May 2026, the Group announced it secured a 51% equity stake in Vesari Inc. ("Vesari"), for no cash consideration[12]. Vesari is a new U.S. incorporated company (Vesari.ai) established to acquire, develop and commercialise intellectual property in the field of geothermal-powered hyperscale data centres.
Strategic Rationale
Vesari's investment thesis is that access to reliable, scalable power rather than semiconductor availability is the principal constraint on AI infrastructure growth. Demand for AI compute continues to expand at a pace that is outstripping available power infrastructure and increasing the cost of electricity to consumers worldwide:
- Data centre electricity consumption in the United States has risen to approximately 4-5% of total national electricity usage and is projected to reach 9-17% by 2030.[13]
- U.S. data centre power consumption has tripled since 2014[14], and Global data centre power consumption is projected to reach 800 TWh by 2028.[15]
- Grid interconnection queues in major markets frequently exceed five years, with transmission upgrades adding significant cost and delay.
- Goldman Sachs Research projects global data centre power demand to increase by approximately 165% by 2030 relative to 2023 levels.[16]
Vesari seeks to address this bottleneck by co-locating hyperscale AI compute directly with geothermal power generation in a fully integrated, behind-the-meter configuration. The architecture is designed to operate independently from traditional grid infrastructure and to use low-Earth-orbit ("LEO") satellite connectivity in place of conventional terrestrial fibre networks. If successfully developed, this model is expected to deliver:
- 24/7 carbon-free baseload compute;
- Elimination of transmission constraints;
- Reduced exposure to power price volatility;
- Improved efficiency and,
- No incremental burden on public electricity grids.
Intellectual Property Strategy
Subject to the submission to the United States Patent and Trademark Office, Vesari is expected to hold a portfolio of eleven patent applications. Once these patent applications are filed, the applications will be assigned from Dr. Gross to Vesari (the "Patent Portfolio"). Dr. Gross believes the applications address core inefficiencies in the conversion of geothermal energy into scalable AI compute infrastructure. The patent specifications have been omitted at this stage to avoid premature disclosure ahead of formal patent filings.
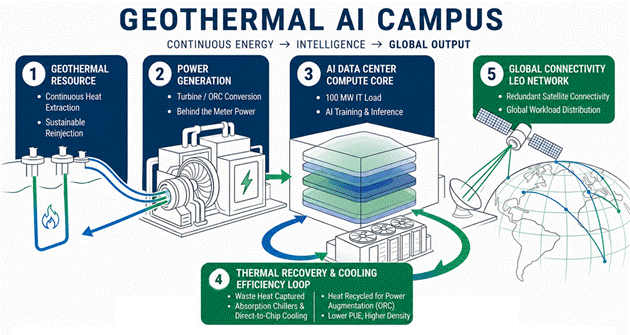
The hypothetical Geothermal AI Campus block diagram below depicts a fully integrated, behind-the-meter architecture in which continuous geothermal heat is converted by turbines and ORC[17] systems into 100 MW of carbon-free electrical power that directly feeds a hyperscale AI data centre. Waste heat from the compute core is captured by a closed-loop thermal recovery and cooling system estimated to deliver improved power utilization effectiveness (PUE).[18]
Efficiency and Value Creation Framework
Vesari's prototype architecture is designed as a closed-loop system integrating power generation, cooling, compute orchestration and commercial monetisation into a single operating framework. Unlike conventional infrastructure, in which these elements operate independently, Vesari's approach is intended to generate compounding efficiency gains across four layers:
- Geothermal integration and islanded architecture
- Cooling and thermal management
- Energy-aware compute orchestration and,
- Commercial and deployment optimisation.
The Company believes the principal advantage of Vesari's model lies not in any single efficiency gain in isolation, but in the interaction of these integrated systems, forming a reinforcing feedback loop between power, cooling, compute, pricing and power utilisation. If successful, the mode is expected to enhance energy efficiency, compute throughput and returns on invested capital.
For further information, please contact:
|
|
About Tekcapital plc
Tekcapital creates value from investing in new, university-developed discoveries that can enhance people's lives and provides a range of technology transfer services to help organisations evaluate and commercialise new technologies. Tekcapital is quoted on the AIM market of the London Stock Exchange (AIM: symbol TEK) and is headquartered in the UK. For more information, please visit www.tekcapital.com
General Risk Factors and Forward-Looking Statements
The information contained in this document has been prepared and distributed by the Company and is subject to material updating, completion, revision, verification and further amendment. This Report is directed only at Relevant Persons and must not be acted on or relied upon by persons who are not Relevant Persons. Any other person who receives this Report should not rely or act upon it. By accepting this Report, the recipient is deemed to represent and warrant that: (i) they are a person who falls within the above descrip-tion of persons entitled to receive the Report; (ii) they have read, agree and will comply with the contents of this notice. The securities mentioned herein have not been and will not be, registered under the U.S. Securities Act of 1933, as amended (the "Securities Act"), or under any U.S. State securities laws, and may not be offered or sold in the United States of America or its territories or possessions (the "United States") unless they are registered under the Securities Act or pursuant to an exemption from or in a transaction not subject to the registration requirements of the Securities Act. This Report is not being made available to persons in Australia, Canada, Japan, the Republic of Ireland, the Republic of South Africa or any other jurisdiction in which it may be unlawful to do so and it should not be delivered or distributed, directly or indirectly, into or within any such jurisdictions.
Investors must rely on their own examination of the legal, taxation, financial and other consequences of an investment in the Com-pany, including the merits of investing and the risks involved. Prospective investors should not treat the contents of this Report as advice relating to legal, taxation or investment matters and are advised to consult their own professional advisers concerning any acquisition of shares in the Company. Certain information contained in this Report has been obtained from published sources prepared by other parties. Certain other information has been extracted from unpublished sources prepared by other parties which have been made available to the Company. The Company has not carried out an independent investigation to verify the accuracy and completeness of such third-party information. No responsibility is accepted by the Company or any of its directors, officers, em-ployees or agents for the accuracy or completeness of such information.
All statements of opinion and/or belief contained in this Report and all views expressed represent the directors' own current as-sessment and interpretation of information available to them as at the date of this Report. In addition, this Report contains certain "forward-looking statements", including but not limited to, the statements regarding the Company's overall objectives and strategic plans, timetables and capital expenditures. Forward-looking statements express, as at the date of this Report, the Company's plans, estimates, valuations, forecasts, projections, opinions, expectations or beliefs as to future events, results or performance. Forward-looking statements involve a number of risks and uncertainties, many of which are beyond the Company's control, and there can be no assurance that such statements will prove to be accurate. No assurance is given that such forward looking statements or views are correct or that the objectives of the Company will be achieved. Further, valuations of the Company's portfolio investments and net asset value can and will fluctuate over time due to a wide variety of factors both company specific and macro-economic. Changes in net asset values can have a significant impact on revenue and earnings of the Company and its future prospects. Additionally, the current Coronavirus pandemic may produce negative economic activities which could reduce the company's economic performance and the performance of its portfolio companies in ways that are difficult to quantify at this juncture. It may cause a downturn in the markets in which the Company operates, reduce the Company's net asset values, revenue, cash flow, access to investment capital and other factors which could negatively impact the Company. As a result, the reader is cautioned not to place reliance on these statements or views and no responsibility is accepted by the Company or any of its directors, officers, employees or agents in respect thereof. The Company does not undertake to update any forward-looking statement or other information that is contained in this Report. Neither the Company nor any of its shareholders, directors, officers, agents, employees or advisers take any responsibility for, or will accept any liability whether direct or indirect, express or implied, contractual, tortious, statutory or otherwise, in respect of, the accuracy or completeness of the information contained in this Report or for any of the opinions contained herein or for any errors, omissions or misstatements or for any loss, howsoever arising, from the use of this Report. Neither the issue of this Report nor any part of its contents is to be taken as any form of contract, commitment or recommendation on the part of the Company or the directors of the Company. In no circumstances will the Company be responsible for any costs, losses or expenses incurred in connection with any appraisal, analysis or investigation of the Company. This Report should not be considered a recommendation by the Company or any of its affiliates in relation to any prospective acquisition or disposition of shares in the Company. No undertaking, Report, warranty or other assurance, express or implied, is made or given by or on behalf of the Company or any of its affiliates, any of its directors, of-ficers or employees or any other person as to the accuracy, completeness or fairness of the information or opinions contained in this Report and no responsibility or liability is accepted for any such information or opinions or for any errors or omissions.
Intellectual Property Risk Factors
Tekcapital mission is to create valuable products from university intellectual property that can improve people's lives. Therefore, our ability to compete in the market may negatively affected if our portfolio companies lose some or all of their intellectual property rights. If patent rights that they rely on are invalidated, or if they are unable to obtain other intellectual property rights. Our success will depend on the ability of our portfolio companies to obtain and protect patents on their technology and products, to protect their trade secrets, and for them to maintain their rights to licensed intellectual property or technologies. Their patent applications or those of our licensors may not result in the issue of patents in the United States or other countries. Their patents or those of their licensors may not afford meaningful protection for our technology and products. Others may challenge their patents or those of their licensors by proceedings such as interference, oppositions and re-examinations or in litigation seeking to establish the invalidity of their patents. In the event that one or more of their patents are challenged, a court may invalidate the patent(s) or determine that the patent(s) is not enforceable, which could harm their competitive position and ours. If one or more of our portfolio company patents are invalidated or found to be unenforceable, or if the scope of the claims in any of these patents is limited by a court decision, our portfolio companies could lose certain market exclusivity afforded by patents owned or in-licensed by us and potential competitors could more easily bring products to the market that directly compete with our own. The uncertainties and costs surrounding the prosecution of their patent applications and the cost of enforcement or defence of their issued patents could have a material adverse effect on our business and financial condition.
To protect or enforce their patent rights, our portfolio companies may initiate interference proceedings, oppositions, re-examinations or litigation against others. However, these activities are expensive, take significant time and divert management's attention from other business concerns. They may not prevail in these activities. If they are not successful in these activities, the prevailing party may obtain superior rights to our claimed inventions and technology, which could adversely affect their ability of our portfolio companies to successfully market and commercialize their products and services. Claims by other companies may infringe the intellectual property rights on which our portfolio companies rely, and if such rights are deemed to be invalid it could adversely affect our portfolio companies and ourselves as investors in these companies.
From time to time, companies may assert, patent, copyright and other intellectual proprietary rights against our portfolio company's products or technologies. These claims can result in the future in lawsuits being brought against our portfolio companies or their holding company. They and we may not prevail in any lawsuits alleging patent infringement given the complex technical issues and inherent uncertainties in intellectual property litigation. If any of our portfolio company products, technologies or activities, from which our portfolio companies derive or expect to derive a substantial portion of their revenues and were found to infringe on another company's intellectual property rights, they could be subject to an injunction that would force the removal of such product from the market or they could be required to redesign such product, which could be costly. They could also be ordered to pay damages or other compensation, including punitive damages and attorneys' fees to such other company. A negative outcome in any such litigation could also severely disrupt the sales of their marketed products to their customers which in turn could harm their relationships with their customers, their market share and their product revenues. Even if they are ultimately successful in defending any intellectual property.
STRATEGIC REPORT
CHAIRMAN'S SUMMARY
The Company reported a reduction in its Net Assets by US$15.0m due primarily to unrealized depreciation of our portfolio. This resulted in a loss after tax in 2025 of US$ 17.1m, which was due to this unrealised depreciation in portfolio company values as compared with a gain of US $19.2m in 2024. Most of the unrealized depreciation was driven by the reduction in the share price of Microsalt plc, which has partially recovered post period end.
As part of its ongoing focus on cost discipline and operational efficiency, the Company reduced its total expenses by approximately 7% in 2025, from $2.02 million in 2024 to $1.88 million. This builds on a previously reported 26% reduction in 2024, when expenses declined from $2.7 million in 2023 to $2.0 million, underscoring a sustained and disciplined approach to overhead optimization.
Financial performance
Net Assets US$55.1m (2024: US$70.1m) NAV per share US$0.23 (2024: US$0.33) Portfolio valuation US$46.9m (2024: US$61.5m) Loss after tax: US$(17.1)m, resulting primarily from unrealised fair value decrease of portfolio valuation (2024: gain of US$19.2m). |
Capital raised during the period
In 2025 we completed share placements totalling US$ 2.8m (2024: US$ 2.7m), excluding expenses. Proceeds were used primarily to accelerate commercial progress of select portfolio companies and provide additional working capital for the Group.
Outlook
Tekcapital has a demonstrated track record of sourcing and commercializing university-derived technologies, repeatedly scaling them from inception to publicly listed companies, and is actively progressing the anticipated IPO of Guident Corp in the near term.
The Company is also strategically expanding its investment focus in generative artificial intelligence, which it views as a once-in-a-generation transformational opportunity.
Tekcapital's long-term objective is to drive sustained growth in net asset value while delivering strong, consistent returns on invested capital.
CONSOLIDATED STATEMENT OF COMPREHENSIVE INCOME FOR THE YEAR ENDED 31 DECEMBER 2025
| Year ended | Year ended | |
Group | Note | 31 December | 31 December |
|
| 2025 | 2024 |
| US $ | US $ | |
Portfolio return and revenue |
| ||
|
| ||
Changes in fair value on financial assets at fair value though profit or loss | 12 | (16,209,115) | 20,016,771 |
Revenue from services | 6 | 279,402 | 425,986 |
Interest from financial assets at fair value through profit or loss | 12.3 | 734,013 | 743,205 |
(15,195,700) | 21,185,962 | ||
Administrative expenses and other expenses |
| ||
Cost of sales | 7 | - | (147,203) |
Operating expenses | 7 | (1,883,437) | (1,879,773) |
Operating (loss)/profit before tax | (17,079,137) | 19,158,986 | |
Income tax expense | 9 | (800) | (2,961) |
(Loss)/profit after tax for the year | (17,079,937) | 19,156,025 | |
|
| ||
Other comprehensive loss |
| ||
Total other comprehensive loss | (593,497) | (589,195) | |
|
|
| |
Total comprehensive (loss)/income for the year | (17,673,434) | 18,566,830 | |
|
|
| |
Earnings per share |
|
| |
Basic earnings per share | 10 | (0.10) | 0.10 |
Diluted earnings per share | 10 | (0.10) | 0.10 |
All comprehensive income as presented above belongs to the owners of the Group.
This should be read in conjunction with the accompanying notes set out in the full 2025 Annual Report, available on the Company's website at: https://www.tekcapital.com/results-centre/
CONSOLIDATED STATEMENT OF FINANCIAL POSITION AT 31 DECEMBER 2025
| As at 31 December | As at 31 December | |
Group | Note | 2025 | 2024 |
|
| US$ | US$ |
Assets |
| ||
Non-current assets |
| ||
Financial assets at fair value through profit and loss | 12 | 54,252,769 | 69,201,744 |
Property, plant and equipment | 13 | 5,241 | 7,152 |
54,258,010 | 69,208,896 | ||
Current assets |
| ||
Trade and other receivables | 14 | 1,175,291 | 644,365 |
Cash and cash equivalents | 15 | 529,193 | 786,290 |
1,704,484 | 1,430,655 | ||
Total assets | 55,962,494 |
70,639,551 | |
Current liabilities |
| ||
Trade and other payables | 18 | 859,674 | 548,725 |
Deferred revenue | 19 | 22,576 | 22,844 |
| |||
Total liabilities | 882,250 | 571,569 | |
Net assets | 55,080,244 | 70,067,982 | |
Equity attributable to owners of the Parent |
| ||
Ordinary shares | 17 | 1,282,926 | 1,142,071 |
Share premium | 17 | 34,808,340 | 32,297,956 |
Retained earnings | 17 | 19,268,747 | 36,314,227 |
Translation reserve | 17 | (207,600) | 385,897 |
Merger reserve | (72,169) | (72,169) | |
Total equity | 55,080,244 | 70,067,982 |
The financial statements should be read in conjunction with the accompanying notes set out in the full 2025 Annual Report, available on the Company's website at: https://www.tekcapital.com/results-centre/
The financial statements were approved and authorised for issue by the Board of Directors on 26 May 2026 and were signed on its behalf.
 | |||
 | |||
CONSOLIDATED STATEMENT OF CHANGES IN EQUITY FOR YEAR ENDED 31 DECEMBER 2025
Attributable to equity holders of the parent company | ||||||||||||
| Ordinary | Share | Translation | Other | Retained | Total | ||||||
Group | Note | Shares | Premium Account | Reserve | Reserve | Earnings | Equity | |||||
|
| US $ | US $ | US $ | US $ | US $ | US $ | |||||
| ||||||||||||
At 31 December 2023 |
| 973,329 | 28,937,011 | 975,092 | (72,169) | 17,073,617 | 47,886,880 | |||||
| ||||||||||||
Profit for the year | 19,156,025 | 19,156,025 | ||||||||||
Other comprehensive loss | - | - | (589,195) | - | (589,194) | |||||||
Total comprehensive (loss)/income for the year | - | - | (589,195) | - | 19,156,025 | 18,566,830 | ||||||
Transactions with owners, recorded directly in equity |
| |||||||||||
Share issue | 17 | 168,742 | 3,626,796 | - | - | - | 3,795,538 | |||||
Cost of share issue | - | (265,851) | - | - | - | (265,851) | ||||||
Share based payments | 23 | - | - | - | - | 84,585 | 84,585 | |||||
Total transactions with owners | 168,742 | 3,360,945 | - | - | 84,585 | 3,614,272 | ||||||
At 31 December 2024 |
| 1,142,071 | 32,297,956 | 385,897 | (72,169) | 36,314,227 | 70,067,982 | |||||
| ||||||||||||
Loss for the year |
| (17,079,937) | (17,079,937) | |||||||||
Other comprehensive loss | (593,497) | (593,497) | ||||||||||
Total comprehensive loss for the year |
|
| (593,497) | - | (17,079,937) | (17,673,434) | ||||||
Transactions with owners, recorded directly in equity |
| |||||||||||
Share issue | 17 | 140,855 | 2,664,492 | 2,805,347 | ||||||||
Cost of share issue | (154,108) | (154,108) | ||||||||||
Share based payments | 23 | 34,457 | 34,457 | |||||||||
Total transactions with owners | 140,855 | 2,510,384 | - | - | 34,457 | 2,685,696 | ||||||
At 31 December 2025 |
| 1,282,926 | 34,808,340 | (207,600) | (72,169) | 19,268,747 | 55,080,244 | |||||
Share premium - amount subscribed for share capital in excess of nominal value, net of directly attributable costs.
Translation reserve - foreign exchange differences recognized in other comprehensive income.
Other reserve - historic other reserve outside of share premium, translation reserve and share premium.
Retained earnings - cumulative net gains and losses recognised in the consolidated statement of comprehensive income, net of dividends paid.
The financial statements should be read in conjunction with the accompanying notes set out in the full 2025 Annual Report, available on the Company's website at: https://www.tekcapital.com/results-centre/
CONSOLIDATED STATEMENT OF CASH FLOWS FOR THE YEAR ENDED 31 DECEMBER 2025
Note | Year ended 31 December 2025 | Year ended 31 December 2024 | ||
| US $ | US $ | ||
Cash flows from operating activities |
| |||
(Loss)/profit after income tax | (17,079,937) | 19,156,025 | ||
Adjustments for |
| |||
- Depreciation | 13 | 2,980 | 7,119 | |
- Amortisation | - | 34,911 | ||
- Share based payment expense | 34,456 | 84,585 | ||
- Management services income | 6 | (279,402) | (326,144) | |
- Interest from financial assets at FVTP&L | 12.3 | (734,013) | (743,205) | |
- Unrealised (gains) on foreign exchange | (44,413) | (8,473) | ||
- Fair value losses/(gains) on financial assets at FVTP&L | 12 | 16,209,115 |
(20,016,772) | |
Movement in working capital: | ||||
- Movement in trade and other receivables | (530,926) | 470,388 | ||
- Deferred revenue movement | (268) | (194,548) | ||
- Movement in trade and other payables | 310,949 | 31,568 | ||
Net cash outflows from operating activities | (2,111,459) | (1,504,545) | ||
Cash flows from investing activities |
| |||
Additions to financial assets at fair value through profit and loss | 12 | (1,408,923) | (3,200,305) | |
Proceeds from disposals of financial assets at fair value through profit and loss | 12 | 582,267 | 1,381,440 | |
Purchases of property, plant and equipment | 13 | (1,070) | - | |
Net cash outflows from investing activities | (827,726) | (1,818,865) | ||
Cash flows from financing activities |
| |||
Proceeds from issuance of ordinary shares | 17 | 2,805,347 | 3,795,538 | |
Costs of raising finance | 17 | (154,108) | (265,851) | |
Net cash inflows from financing activities | 2,651,239 | 3,529,687 | ||
Net (decrease)/increase in cash and cash equivalents |
| (287,946) | 206,277 | |
Cash and cash equivalents at beginning of year | 15 | 786,290 | 620,248 | |
Exchange gains/(losses) on cash and cash equivalents | 30,849 | (40,235) | ||
Cash and cash equivalents at end of period/year | 15 | 529,193 | 786,290 | |
The financial statements should be read in conjunction with the accompanying notes set out in the full 2025 Annual Report, available on the Company's website at: https://www.tekcapital.com/results-centre/
NOTES TO THE FINANCIAL STATEMENTS
1. GENERAL INFORMATION
Tekcapital plc (Companies House registration number: 08873361) is a Company incorporated in England and Wales and domiciled in the UK. The address of the registered office is detailed on page 36 of the financial statements. The Company is a public limited company limited by shares, which listed on the AIM market of the London Stock Exchange in 2014. The principal activity of the Group is to provide universities and corporate clients with valuable technology transfer services. The Group also acquires exclusive licences to university technologies that it believes can positively impact people's lives, for subsequent commercialisation.
The material accounting policies applied in the preparation of these consolidated financial statements are set out below. These policies have been consistently applied to all the years presented, unless otherwise stated. The amounts presented in the consolidated financial statements are comparable to consolidated financial statements for the year ended 31 December 2024. While the financial information included in this preliminary announcement has been prepared in accordance with the recognition and measurement criteria of International Financial Reporting Standards, this announcement does not itself contain sufficient information to comply with those standards. The Company expects to publish full financial statements that comply with International Financial Reporting Standards in June 2026.
Amounts presented in this report are rounded to nearest US$1.
2. MATERIAL ACCOUNTING POLICIES
2.1 STATEMENT OF COMPLIANCE
The consolidated financial statements of Tekcapital have been prepared in accordance with the UK-adopted International Financial Reporting Standard ("UK adopted IFRS") and those parts of the Companies Act 2006 that are relevant to companies which report in accordance with UK adopted IFRS. The consolidated financial statements have been prepared under the historical cost convention. The consolidated financial statements comprise the financial statements of Tekcapital plc and its subsidiaries, Tekcapital Europe Ltd and Tekcapital LLC.
The preparation of financial statements in accordance with UK-adopted International Financial Reporting Standards requires the use of certain critical accounting estimates. It requires management to exercise its judgement in the process of applying the Group's accounting policies. The areas involving a higher degree of judgment or complexity, or areas where assumptions and estimates are significant to the consolidated financial statements are disclosed in note 4.
2.1.1 GOING CONCERN
The financial statements have been prepared on a going concern basis.
The Group and Company meet their day-to-day working capital requirements through service offerings, monetisation of quoted equity stakes and monies raised through issues of equity. As disclosed in note 26, the Group announced a new placement of 18,750,000 new ordinary shares of 0.4 pence each in the Company at a price of 8 pence per share to raise £1.5m in February 2026.
The Directors have prepared detailed cash flow projections for the period to 31 May 2027 ("going concern assessment period"). In preparing these projections the directors have taken into account the Group's available cash as at the date of signing of these financial statements, combined with the ability to sell down shares in the Group's quoted equity investments, and are satisfied this provides the Group and Company with more than adequate headroom. The cash flow projections have been subjected to sensitivity analysis which demonstrate that the Group and Company will maintain a positive cash balance through the going concern assessment period. The forecasts and projections included assumptions and estimation uncertainties related to Group's service revenues, cost of goods sold and operating expenses. Most significant material assumptions include Company's payroll, which is limited to a handful of employees. The Group has no third-party debt facilities.
The Directors have also considered the geo-political environment, including rising inflation, and whilst the impact on the Group is currently deemed minimal, the Directors remain vigilant. On this basis, the Directors have therefore concluded that it is appropriate to prepare the financial statements on a going concern basis.
2.1.2 CHANGES IN ACCOUNTING POLICY AND DISCLOSURES
Standards and Interpretations effective from 1 January 2025
The Group has applied the following standards and amendments for the first time for its annual reporting period commencing 1 January 2025:
• Amendments to IAS 21 "Lack of Exchangeability". Effective from 1 January 2025, these amendments require entities to assess exchangeability and, if lacking, estimate a spot rate reflecting market participant conditions, enhancing consistency in financial reporting.
The amendments listed above did not have any impact on the amounts recognised in prior periods and are not expected to significantly affect the current or future periods.
There are a number of standards, amendments to standards, and interpretations which have been issued that are effective in future accounting periods that the Group has decided not to adopt early as they will not have a significant impact on the presentation of the Group financial statements.
Standards and Interpretations not yet effective
The following standards and amendments are effective for annual periods beginning on or after 1 January 2026 (unless otherwise stated):
· IFRS 18 Presentation and Disclosure in Financial Statements (effective 1 January 2027)
· IFRS 19 Subsidiaries without Public Accountability: Disclosures (effective 1 January 2027)
· Amendments to classification and measurement requirements for financial instruments (Amendments to IFRS 9 and IFRS 7) - Effective 1 January 2026
· Amendments to Illustrative Examples on IFRS 7, IFRS 18, IAS 1, IAS 8, IAS 36 and IAS37- Provisions, Contingent Liabilities and Contingent Assets - Effective from November 1 2025 but transition reliefs are provided.
At the reporting date, there are no other new standards or amendments issued but not yet effective that are expected to have a material impact on the Group. The Group does not expect that the adoption of the above standards will have a material impact on its consolidated financial statements, other than changes to presentation and disclosure
2.2 CONSOLIDATION
The consolidated financial statements comprise the financial statements of Tekcapital plc and all subsidiaries controlled by it, except for indirect subsidiaries. These indirect subsidiaries are classified as equity investments based on their purpose, as those subsidiaries represent investment assets for the Group. Please refer to Note 11 for detail of indirect subsidiaries.
Subsidiaries are entities that are controlled by the Group. Control is achieved when the Group has the power to govern the financial and operating policies of an entity so as to obtain economic benefit from its activities. Intercompany transactions, balances and unrealised gains on transactions between Group companies are eliminated. Unrealised losses are also eliminated when necessary amounts reported by subsidiaries have been adjusted to conform to the Group's accounting policies.
2.3 FOREIGN CURRENCIES
(a) Functional and presentation currency
These consolidated financial statements are presented in US Dollars which is the presentation currency of the Group. The Directors consider this to be the most appropriate presentational currency. Each subsidiary within the Group has its own functional currency which is dependent on the primary economic environment in which that subsidiary operates. The functional currency of Tekcapital lc is UK sterling as this is the currency the entity undertakes its primary economic activity.
(b) Transactions and Balances
Foreign currency transactions are translated into functional currency using the exchange rates prevailing at the dates of the transactions or valuation where items are re-measured.
Foreign exchange gains and losses resulting from the settlement of such transactions and from the translation at the year-end exchange rates of monetary assets and liabilities denominated in foreign currencies are recognised in the income statement.
(c) Group companies
The results and financial position of all Group entities (none of which has the currency of a hyper-inflationary economy) that have a functional currency different from the presentation currency are translated into the presentation currency as follows:
(i) Monetary assets and liabilities for each balance sheet presented are translated at the closing exchange rates at the date of that balance sheet.
(ii) Income and expense for each income statement are translated at the average rates of exchange during the period (unless this average is not a reasonable approximation of the cumulative effect of the rates prevailing on the transaction dates, in which case income and expenses are translated at the rate on the dates of the transactions)
(iii) All resulting exchange differences are recognized in other comprehensive income.
2.4 INVESTMENT IN PORTFOLIO COMPANIES
Investments in portfolio companies are held at fair value through the profit and loss. Directors' judgment was exercised in determination that the Group meets the following criteria and should be recognized as an investment entity under IFRS 10 par. 27. Directors re-evaluated the below criteria and concluded they were met as at 31 December 2025:
· Obtains funds from one or more investors for the purpose of providing clients with investment management services
· Commits to its investors that its business purpose is to invest funds solely for return from capital appreciation, investment income or both
· Measures and evaluate the performance of substantially all of its investments on a fair value basis.
Tekcapital's IP search and technology transfer investment services represent investment advisory services, and therefore Tekcapital Europe Limited and Tekcapital LLC continue to be consolidated, as subsidiaries, and provide investment advisory services. These services may be provided to investors, clients and third parties. The Board considers that the criteria are met in the group's current circumstances.
The Board envisages that Tekcapital's shareholder returns will derive primarily from mid to long-term capital appreciation of a portion of its intellectual property investments, as well as from providing IP investment services to clients. Consequently, the Group's portfolio companies are measured at fair value in accordance with IFRS 9 as disclosed in Note 2.6.3.
2.5 PROPERTY, PLANT AND EQUIPMENT
Property, plant and equipment are stated at historical cost less accumulated depreciation. Historical cost includes expenditure that is directly attributable to the acquisition of the items. Subsequent costs are included in the asset's carrying amount or recognised as a separate asset, as appropriate, only when it is probable that future economic benefits associated with the item will flow to the Group and the cost of the item can be measured reliably. All other repairs and maintenance are charged to the income statement during the financial period in which they are incurred. Depreciation of assets are calculated to write off the cost less the estimated residual value of tangible fixed assets by equal instalments over the estimated useful economic lives as follows:
Furniture 3 years
Computer equipment 3 years
Leasehold improvements 5 years
The assets' residual values and useful lives are reviewed, and adjusted if appropriate, at the end of each reporting period. The asset's carrying amount is written down immediately to its recoverable amount if the asset's carrying value is greater than its estimated recoverable amount. Gains and losses on disposals are determined by comparing proceeds with the carrying amount and are recognised within 'Operating expenses' in the income statement.
2.6 FINANCIAL INSTRUMENTS
2.6.1 CLASSIFICATION AND MEASUREMENT
The Group classifies its financial assets depending on the purpose for which the asset was acquired. Management determines the classification of its financial assets at initial recognition.
During the financial year the Group held investments in portfolio companies classified as equity investments. They are included in non-current assets and are measured at fair value through profit and loss in accordance with IFRS 9.
The Group has convertible loan note receivables. These financial assets are classified and measured at fair value through profit and loss in accordance with IFRS 9.
The Group also has receivables carried at amortised cost. They are included in current assets. The Group's service income receivables comprise 'trade and other receivables' in the balance sheet, also held at amortised cost. The Group also has cash and cash equivalents.
All short-term liabilities are measured at amortised cost, the Group does not hold any long-term financial liabilities.
2.6.2 DERECOGNITION
Financial Assets
Loans and receivables are recognised and carried at amortised cost. In accordance with IFRS 9 Financial Instruments, a financial asset is derecognised when, and only when:
(a) the contractual rights to the cash flows from the financial asset expire; or
(b) the Group transfers the financial asset in accordance with IFRS 9 requirements and the transfer qualifies for derecognition.
A transfer of a financial asset qualifies for derecognition where the Group transfers substantially all the risks and rewards of ownership of the asset. Where the Group neither transfers nor retains substantially all the risks and rewards of ownership, the Group determines whether it has retained control of the financial asset. If control is not retained, the financial asset is derecognised; if control is retained, the financial asset continues to be recognised to the extent of the Group's continuing involvement.
On derecognition of a financial asset, the difference between the carrying amount and the consideration received is recognised in profit or loss.
Financial Liabilities
In accordance with IFRS 9 Financial Instruments, a financial liability is derecognised when, and only when, the obligation specified in the contract is discharged, cancelled, or expires.
Where an existing financial liability is replaced by another from the same lender on substantially different terms, or the terms of an existing liability are substantially modified, such an exchange or modification is accounted for as the derecognition of the original liability and the recognition of a new liability.
The difference between the carrying amount of the financial liability derecognised and the consideration paid, including any non-cash assets transferred or liabilities assumed, is recognised in profit or loss.
2.6.3 FAIR VALUE
Financial instruments are initially measured at fair value including investments in portfolio companies, cash and cash equivalents, trade and other receivables, trade and other payables, and convertible loan note receivables. This measurement policy does not apply to subsequent measurement at amortised cost of short term financial liabilities and trade receivables.
The Group measures portfolio companies using valuation techniques appropriate in the circumstances and for which sufficient data are available to measure fair value, maximising the use of relevant observable inputs and minimising the use of unobservable inputs. Our fair value valuation policy is as follows:
The fair value of new portfolio companies is estimated at the cost of the acquired IP or equity plus associated expenses to facilitate the acquisition.
Existing portfolio companies are valued as follows:
· If a market transaction such as third-party funding has occurred during the past 12 months, we will value our ownership in the portfolio Company at this observed valuation, taking account of any observed material changes during the period, including quoted prices in active markets. Where quoted prices in active markets are available, these represent Level 1 inputs
· In the absence of a recent market transaction, fair value will be estimated by alternative methods and where appropriate by an external, qualified valuation expert. The valuation techniques fall under Level 2 - Observable techniques other quoted prices and Level 3 - other techniques as defined by IFRS 13.
Due to their short-term nature, the carrying value of cash and cash equivalents, trade and other receivables, and trade and other payables approximate their fair value.
2.7 OFFSETTING FINANCIAL INSTRUMENTS
Financial assets and liabilities are offset and the net amount reported in the balance sheet when there is a legally enforceable right to offset the recognised amounts and there is the intention to settle on a net basis or realise the asset and settle the liability simultaneously.
2.8 IMPAIRMENT OF FINANCIAL ASSETS
Impairment provisions for trade receivables are recognized based on the simplified approach within IFRS 9 using the lifetime expected credit losses. During this process the probability of the non-payment of the trade receivables is assessed, including forward-looking information on customers standing and macroeconomic information including sector specific circumstances This probability is then multiplied by the amount of the expected loss arising from default to determine the lifetime expected credit loss for the trade receivables. For trade receivables, which are reported net, such provisions are recorded in a separate provision account with the loss being recognized within operating expenses in the consolidated statement of comprehensive income. On confirmation that the trade receivable will not be collectable, the gross carrying value of the asset is written off against the associated provision.
Financial assets held at amortised cost comprise trade and other receivables, and cash and cash equivalents in the consolidated statements of financial position.
2.9 CASH AND CASH EQUIVALENTS
In the consolidated statement of cash flows, cash and cash equivalents includes cash in hand, deposits held at call with banks and other financial institutions, and other short term highly liquid investments with maturities of three months or less from inception. These amounts are subject to insignificant risk of changes in value and are held to meet short-term cash needs.
2.10 SHARE CAPITAL
Ordinary Shares
Ordinary Shares are classified as equity.
Share Premium
The share premium account has been established to represent the excess of proceeds over the nominal value for all share issues, including the excess of the exercise share price over the nominal value of the shares on the exercise of share options as and when they occur. Incremental costs directly attributable to the issue of new ordinary shares and new shares options are shown in equity as a deduction, net of tax, from the proceeds.
2.11 TRADE PAYABLES
Trade payables are obligations to pay for goods and services that have been acquired in the ordinary course of business from suppliers. Accounts payable are classified as current
liabilities if payment is due within one year or less (or in the normal operating cycle of business if longer). If not, they are presented as non-current liabilities.
Trade payables are recognised initially at fair value and subsequently measured at amortised cost using the effective interest rate method.
2.12 SHARE BASED PAYMENTS
The Group operates a number of equity-settled, share-based compensation plans, under which the entity receives services from employees as consideration for equity instruments (options) of the Group. The fair value of the employee services received in exchange for the grant of options is recognised as an expense. The total amount to be expensed is determined by reference to the fair value of the options granted:
• Including any market performance conditions;
• excluding the impact of any service and non-market performance vesting conditions (for example, profitability, sales growth targets and remaining an employee of the entity over a specified time period);
• excluding the impact of any non-vesting conditions (for example the requirement of the employees to save).
Assumptions about the number of options that are expected to vest include consideration of non-market vesting conditions. The total expense is recognised over the vesting period, which is the period over which all of the specified vesting conditions are to be satisfied. At the end of each reporting period, the entity revises its estimates of the number of options that are expected to vest based on the non-market vesting conditions. It recognises the impact of the revision to the original estimates, if any, in the income statement, with a corresponding adjustment to equity.
When the options are exercised, the Group issues new shares. The proceeds received net of any directly attributable transactions costs are credited to share capital (nominal value) and share premium when the options are exercised.
2.13 CURRENT AND DEFERRED TAX
The tax expense for the year comprises current and deferred tax. Tax is recognised in the consolidated income statement, except to the extent that it relates to items recognised in other comprehensive income or directly in equity. In this case, the tax is also recognised in other comprehensive income or directly in equity, respectively.
The current income tax charge is calculated on the basis of tax laws enacted or substantively enacted at the balance sheet date in the countries where the Company and its subsidiaries operate and generate taxable income. Management periodically evaluates positions taken in tax returns with respect to situations in which applicable tax regulation is subject to interpretation. It establishes provisions where appropriate on the basis of amounts expected to be paid to the tax authorities.
Deferred income tax is recognised on temporary differences arising between the tax bases of assets and liabilities and their carrying amounts in the consolidated financial statements. However, deferred tax liabilities are not recognised if they arise from the initial recognition of goodwill; deferred income tax is not accounted for if it arises from initial recognition of an asset or liability in a transaction other than a business combination that at the time of the transaction effects neither accounting nor taxable profit or loss.
Deferred income tax is determined using tax rates (and laws) that have been enacted or substantively enacted by the balance sheet date and are expected to apply when the related deferred income tax asset is realised or the deferred income tax liability is settled.
Deferred income tax assets are recognised only to the extent that it is probable that future taxable profit will be available against which the temporary differences can be utilised.
Deferred income tax liabilities are provided on taxable temporary differences arising from investments in subsidiaries except for deferred income tax liability where the timing of the reversal of the temporary difference is controlled by the Group and it is probable that the temporary difference will not reverse in the foreseeable future.
Deferred income tax assets are recognised on deductible temporary differences arising from investments in subsidiaries only to the extent that it is probable the temporary difference will reverse in full in the future and there is sufficient taxable profit available against which the temporary difference can be utilised.
Deferred income tax assets and liabilities are offset when there is a legally enforceable right to offset current tax assets against current tax liabilities and when the deferred income tax assets and liabilities relate to income taxes levied by the same taxation authority on either the same taxable entity or different taxable entities where there is an intention to settle balances on a net basis.
2.14 REVENUE RECOGNITION
Revenue is measured at the fair value of the consideration received or receivable, and represents amounts receivable for the services supplied, stated net of discounts, and value added taxes. The Group recognises revenue when the contract is identified, performance obligation is determined, transaction price (as defined for each service below) is determined and allocated to performance obligation in accordance with IFRS 15.
Provision of services
The Group provided following lines of services during the period:
• Management services: accounting, tax, legal and other services provided to portfolio companies. Revenue is recognized upon delivery of services (with the use of output method to measure delivery over time) to each portfolio Company and performance obligation is met as defined in the management service contract. Directors consider the transaction price to be clearly determined by amounts specified in the management service agreements. Directors considered uncertainty of cash flows from sales to be limited, considering payments are made by companies with excellent track record of payments and clear definition of performance obligation upon which such payment is made.
For breakdown of revenue from services recognised over time and at point of time, please refer to Note 6 to Financial Statements.
2.15 INTEREST INCOME
Interest income is accrued on a time basis, by reference to the principal outstanding and at the effective interest rate applicable (10%).
3. FINANCIAL RISK MANAGEMENT
3.1 FINANCIAL RISK FACTORS
(a) Portfolio risk/investment management
Investment in portfolio companies held by the Group requires a long-term commitment with no certainty of return. The Group's portfolio primarily comprises equity investments in early-stage and growth-stage technology businesses, which are subject to a high degree of valuation risk, including the risk of fair value reductions (impairment risk) if portfolio companies do not perform in line with expectations or if market conditions deteriorate.
.
The fair value of each portfolio company represents management's best estimate at the reporting date and is determined in accordance with IFRS 9 Financial Instruments using appropriate valuation techniques and assumptions. These include forecast revenues, expected growth rates, comparable company multiples, and discount rates. Given the inherent uncertainty in these assumptions, actual outcomes may differ, potentially resulting in material downward adjustments to carrying values.
The Group manages valuation (impairment) risk in part through portfolio diversification. As the number of investments increases, the Group's exposure to adverse performance in any single portfolio company is reduced, as losses in individual investments may be offset by stable or improved performance in others. While diversification does not eliminate the risk of fair value reductions, it reduces the overall volatility of portfolio returns and limits the impact of any single underperforming investment on the Group's net assets and results.
(b) Credit risk management
Credit risk is the risk of financial loss to the Group if a counterparty fails to meet its contractual obligations. The Group's exposure to credit risk is limited, as it does not have material trade receivables from external customers. Instead, credit risk arises primarily from receivables due from portfolio companies and related parties, including loan notes and intercompany balances, as well as cash deposits held with financial institutions.
The Group manages this risk through ongoing monitoring of the financial position and performance of its portfolio companies. Given the nature of these counterparties-being entities in which the Group holds equity interests-credit risk is closely linked to overall portfolio performance. The Directors regularly review financial information, funding requirements, and commercial progress of portfolio companies to assess the recoverability of outstanding balances.
The Group does not typically hold collateral over balances due from portfolio companies or related parties. Instead, credit exposure is mitigated through structural and strategic factors, including:
· the Group's equity ownership and influence over portfolio companies;
· alignment of interests in supporting portfolio companies to achieve successful commercialization and exit outcomes.
Certain loan instruments, such as convertible loan notes, may provide downside protection through conversion rights; however, these do not constitute collateral in the traditional sense. Accordingly, the Group's maximum exposure to credit risk generally remains equal to the carrying amount of the relevant financial assets.
Cash balances are held with reputable financial institutions with high credit ratings, which reduces the risk of counterparty default.
(c) Liquidity risk management
Cash flow forecasting is performed on a Group basis. The Directors monitor rolling forecasts of the Group's liquidity requirements to ensure it has sufficient cash to meet operational needs. Post period end, the Group announced placing to raise GBP 1.5m in February 2026. At the reporting date the Group held bank balances of approximately US$541,648. All amounts shown in the consolidated statement of financial position under current assets and current liabilities mature for payment within one year, with Trade and Other Receivables exceeding Trade and Other Payables by US$ 374,956. Additionally, the Group's investment portfolio includes significant amount of liquid investments available as an alternative funding strategy.
(d) Financial risk management
The Company's Directors review the financial risk of the Group. Due to the early stage of its operations the Group has not entered into any form of financial instruments to assist in the management of risk during the period under review.
(e) Market risk management
Due to low value and number of financial transactions that involve foreign currency and the fact that the Group has no borrowings to manage, the Directors have not entered into any arrangements, adopted or approved the use of derivative financial instruments to assist in the management of the exposure of these risks. It is their view that any exchange risks in such transactions are negligible.
The Group also regularly monitors risk related to fair value of financial instruments held such as convertible loan notes held.
(f) Foreign exchange risk management
Foreign exchange risk arises when individual Group entities enter transactions denominated in a currency other than their functional currency. The Group's policy is, where possible, to allow Group entities to settle liabilities denominated in their functional currency, with the cash generated from their own operations in that currency. Where Group entities have liabilities denominated in a currency other than their functional currency (and have insufficient reserves of that currency to settle them), cash already denominated in that currency will, where possible, be transferred from elsewhere within the Group.
A sensitivity analysis has been performed to assess the exposure of the Group to foreign exchange movements. The Group only has exposure to movements of the US dollar against UK Sterling. As at 31 December 2025, the Group's UK Sterling net exposure relating to cash, receivables and payables denominated in UK Sterling totals $541,648. A 10% strengthening or weakening of the US dollar against the UK Sterling would have result in the increase/decrease of Group's net profit by US$1,113,051.
(g) Interest rate risk management
The Group has no borrowings.
3.2 CAPITAL MANAGEMENT
The Group's objectives when managing capital are to safeguard the Group's ability to continue as a going concern in order to provide returns for shareholders, benefits for other stakeholders and to maintain an optimal capital structure to reduce the cost of capital.
In order to adjust or maintain the capital structure, the Group may adjust the level of dividends paid to its shareholders, return capital to shareholders, issue new shares or sell assets to reduce borrowings. The Group has no external borrowings. This policy is periodically reviewed by the Directors, and the Group's strategy remains unchanged for the foreseeable future.
The capital structure of the Group consists of cash and bank balances and equity consisting of issued share capital, reserves and retained losses of the Group. The Directors regularly review the capital structure of the Company and consider the cost of capital and the associated risks with each class of capital.
The Company's historic cost of capital has been the cost of securing equity financings, which have averaged around 10%. The Company's long-term financial goal is to optimise its returns on invested capital (ROIC) in excess of our weighted average cost of capital (WACC) and as such create value for our shareholders. The method the Company seeks to employ for achieving this is to utilise its structural intellectual capital developed through its decade long expertise in intellectual property and early stage incubation process to mitigate selection bias and improve returns on invested capital. Ultimately, management will seek to monetise these returns with exits from its investments in portfolio companies.
4. CRITICAL ACCOUNTING ESTIMATES AND JUDGEMENTS
Estimates and judgements are continually evaluated and are based on historical experience and other factors, including expectations of future events that are believed to be possible under the circumstances. The Directors made the following judgements:
- determination as to the classification of the Group as an investment entity as discussed in Note 2.4
The Directors also make estimates and assumptions concerning the future. The resulting accounting estimates will by definition, seldom equal the related actual results. The estimates and assumptions that have a significant risk of causing a material adjustment to the carrying value of the assets and liabilities within the next financial year are detailed below.
Key estimate/ judgment area | Key assumption | Potential impact within the next financial year | Potential impact in the longer term | Note reference for sensitivity analysis |
Valuation of unquoted equity investments | In applying valuation techniques to determine the fair value of unquoted equity investments the Group makes estimates and assumptions regarding the future potential of the investments. The policy of the Group is to value new portfolio companies at cost of the acquired IP or equity plus associated expenses to facilitate the acquisition. Existing portfolio companies are valued using either a market transaction such as third-party funding or, in the absence of a recent market transaction, by alternative methods and where appropriate by an external, qualified valuation expert. The fair value of Guident Limited reflects input in the form of value of Guident Ltd's shares in its US subsidiary (Guident Corp) as determined by recent market transactions of these shares. | Yes | Yes | Note 12
|
Valuation of unquoted equity investments | This input was corroborated by Guident's enterprise valuation by applying valuation of comparable companies to Company's sales projections (EV/Sales multiple).
Key assumptions used are projected sales including remote monitor sales and a comparable company multiple applied to company's projected sales.
| Yes | Yes | Note 12 |
Valuation of convertible loan notes
| In applying valuation techniques to determine the fair value of convertible loan notes the Group and Company make estimates and assumptions regarding the future potential of the investments, including discount factor applied for the net present value of future cashflows from the loan.
| Yes | Yes | Note 12
|
5. SEGMENTAL REPORTING
The Directors consider the business to have two segments for reporting purposes under IFRS 8 which are:
· professional services, including the provision of management services to its portfolio companies. The activities grouped under this segment share similar economic characteristics of provision of intellectual property services to third party services.
· licensing and investment activities, including acquiring licences for technologies, portfolio Company investment, development and commercialisation. The activities share the goal of increasing the fair value of investments made into portfolio companies by the Group.
Year ended 31 December 2025 | Professional | Licensing and | TOTAL |
Consolidated income statement | Services | Investment |
|
US $ | US $ | US $ | |
Revenue from Services | 279,402 | - | 279,402 |
Changes in fair value on financial assets at fair value though profit or loss | - | (16,209,115) | (16,209,115) |
Interest Income | - | 734,013 | 734,013 |
Administrative Expenses | (468,599) | (1,412,458) | (1,881,057) |
Depreciation and Amortization | (745) | (1,635) | (2,380) |
Group operating loss | (189,942) | (16,889,195) | (17,079,137) |
Loss on ordinary activities before income tax | (189,942) | (16,889,195) | (17,079,137) |
Income tax expense | (200) | (600) | (800) |
Loss after tax | (190,142) | (16,889,795) | (17,079,937) |
Year ended 31 December 2024 | Professional | Licensing and | TOTAL |
Consolidated income statement | Services | Investment |
|
US $ | US $ | US $ | |
Revenue from Services | 425,986 | - | 425,986 |
Changes in fair value on financial assets at fair value though profit or loss | - | 20,016,771 | 20,016,771 |
Cost of Sales | (147,203) | - | (147,203) |
Interest Income | - | 743,205 | 743,205 |
Administrative Expenses | (446,854) | (1,390,889) | (1,837,743) |
Depreciation and Amortization | (10,508) | (31,522) | (42,030) |
Other Income | 425,986 | - | 425,986 |
Group operating (loss)/income | (178,579) | 19,337,565 | 19,158,986 |
(Loss)/Income on ordinary activities before income tax |
(178,579) |
19,337,565 | 19,158,986 |
Income tax expense | (740) | (2,221) | (2,961) |
(Loss)/profit after tax | (179,319) | 19,335,345 | 19,156,025 |
Segment assets and liabilities |
| ||
2025 | Professional | Licensing and | TOTAL |
Consolidated statement of | Services | Investment |
|
financial position | US $ | US $ | US $ |
Assets | 1,709,725 | 54,252,769 | 55,962,494 |
Liabilities | (882,250) | (882,250) | |
Net Assets | 827,475 | 54,252,769 | 55,080,244 |
2024 | Professional | Licensing and | TOTAL |
Consolidated statement of | Services | Investment |
|
financial position | US $ | US $ | US $ |
Assets | 1,437,807 | 69,201,744 | 70,639,551 |
Liabilities | (571,568) | - | (571,568) |
Net Assets | 866,239 | 69,201,744 | 70,067,983 |
|
| Year ended 31 December 2025 | Period ended 31 December 2024 |
|
| US $ | US $ |
United Kingdom |
|
| |
Changes in fair value on financial assets at fair value though profit or loss | (15,475,102) | 21,086,120 | |
Revenue from Services |
|
| 326,143 |
United States |
|
| |
Revenue from Services | 279,402 | 99,842 | |
Portfolio return and revenue | (15,195,699) | 21,185,962 | |
|
| ||
| 2025 | 2024 | |
|
| US $ | US $ |
United Kingdom | |||
Assets | 54,252,769 | 69,201,744 | |
Liabilities | (134,428) | (125,213) | |
United States | |||
Assets | 1,709,725 | 1,437,807 | |
Liabilities | (747,822) | (446,355) | |
Total Net Assets | 55,080,244 | 70,067,983 |
6. REVENUE FROM SERVICES
The table below discloses disaggregated revenue from services by their nature/categories as well as timing of the revenue. Please refer to Note 12 for disaggregation of Group's Unrealised (loss)/profit on the revaluation of investments.
Group | Transferred at a point in time | Transferred over time | Total 2025 | Transferred at a point in time | Transferred over time | Total 2024 |
US $ | US $ | |||||
Major service lines: |
|
|
| |||
- Sales of Invention Evaluator reports | - | - |
| (59,509)
| - | (59,509) |
- Tech transfer recruitment services | - | - |
|
(40,333)
| - | (40,333) |
- Management services | - | 279,402 | 279,402 | - | (326.144)
| (326,144)
|
Total Revenue from Services | - | 279,402 | 279,402 | (99,842)
| (326,144)
| (425,986)
|
All of the Group's major service lines are sold directly to consumers and not through intermediaries. All revenue recognised in the reporting period represent performance obligations satisfied in the current period. For services transferred over time, output method was used to measure the fulfilment of the performance obligation. Considering the nature of the accounting, tax, legal and other services being provided under the agreements, this method most faithfully depicts the transfer of the services to the customer. Payment is typically due on a Net 30 days basis.
7. OPERATING EXPENSES AND COST OF GOODS SOLD
Group |
|
|
|
| 2025 | 2024 | ||||||||
|
|
|
| US $ | US $ | |||||||||
Cost of goods related to services | - | 147,203
| ||||||||||||
Depreciation of property plant and equipment | 2,981 | 7,120 | ||||||||||||
Research and development expenses | - | -
| ||||||||||||
Amortisation of intangible assets | - | 34,911
| ||||||||||||
Marketing and PR | 49,023 | 47,157
| ||||||||||||
IT & Software | 44,426 | 82,817
| ||||||||||||
Audit and accounting | 179,715 | 157,765
| ||||||||||||
Share based payments | 34,457 | 84,584
| ||||||||||||
Nominated Advisor and other exchange listing expenses | 147,651 | 139,261
| ||||||||||||
Director emoluments | 445,802 | 691,993
| ||||||||||||
Employee salaries | 379,424 |
| 717,807 | |||||||||||
Other administration expenses | 599,958 | 257,893 | ||||||||||||
Foreign exchange movements | - |
| (328,651)
| |||||||||||
Total expenses |
| 1,883,437 | 2,026,975 | |||||||||||
7.2 AUDITOR REMUNERATION
Group |
|
|
|
| 2025 | 2024 | ||||
US $ | US $ | |||||||||
Fees payable to the group's auditor and its associates for the audit of the Group and Company financial statements | 113,867 | 124,022 | ||||||||
Audit of company's subsidiaries | 15,818 | 32,306 | ||||||||
|
| 129,685 | 156,328 | |||||||
8. EMPLOYEES
8.1 DIRECTOR'S EMOLUMENTS
Group |
| 2025 | 2024 | ||
| US $ | US $ | |||
Directors emoluments* | 445,802 | 661,013 | |||
Directors portion of Share Based Payments | 3,915 | 1,400 | |||
Total | 449,717 | 662,413 | |||
*excludes Directors NI of US$17,170 (2024:US$30,980).
The highest paid Director received a salary of US$272,052 (2024: $261,976) and benefits of US$30,322 (2024: US$24,475). The highest paid Director received a bonus of US$ 34,000 (2024: US$ 264,727). The highest paid Director did not exercise any share options. The share-based payments associated with the highest paid Director amounted to US$3,915 (2024: US$1,400).
Key management personnel (including Directors and Group Chief Financial Officer) received salary of US$492,626 (2024: US$736,538), excluding Employers National Insurance, Benefits in Kind and Share Base Compensation disclosed in Directors Remuneration Report. Please also refer to Director's Report. No Directors exercised their share options during the year. No post- employment benefits or other long-term benefits are applicable for Directors.
8.2 EMPLOYEE BENEFIT EXPENSES
Group |
| 2025 | 2024 | ||
US $ | US $ | ||||
Wages and salaries | 338,165 | 656,149 | |||
Directors' remuneration | 445,802 | 661,013 | |||
Social security costs | 53,841 | 92,638 | |||
Share options granted to directors and employees | 34,456 | 84,584 | |||
| 872,264 | 1,494,384 | |||
8.3 AVERAGE NUMBER OF PEOPLE EMPLOYED
Group | 2025 | 2024 | |||
Number of employees | |||||
Average number of people (including executive directors) employed | |||||
Operations | 3 | 4 | |||
Management | 2 | 2 | |||
Total average headcount | 5 | 6 | |||
9. INCOME TAX EXPENSE
Group |
|
|
| 2025 | 2024 | ||
US $ | US $ | ||||||
Current tax |
| ||||||
Current tax on profits for the year | 800 |
| 2,961 | ||||
Total current tax |
|
| 800 | 2,961 | |||
|
|
|
| ||||
Income tax expense | 800 | 2,961 | |||||
Group |
|
|
| 2025 | 2024 | ||
US $ | US $ | ||||||
(Loss)/profit before tax | (17,079,137) | 19,158,986 | |||||
Tax calculated at domestic tax rates applicable to profits | (4,269,784) |
| 4,789,746 | ||||
Tax effects of: | |||||||
- Expenses not deductible for tax purposes | 4,045,996 |
| (4,975,597) | ||||
- Movement in deferred taxes not recognized | 224,588 |
| 188,812 | ||||
Total income tax expense |
|
| 800 |
| 2,961 | ||
The weighted average applicable tax rate was 25% (2024: 19%).
Unused tax losses of US$2,317,997 (FY24: US$2,301,814) of which a deferred tax asset of US$ nil (FY24: US $ nil) has not been recognised due to uncertainty over the recoverability of those losses through future profits.
10. EARNINGS PER SHARE (EPS)
Basic earnings per share are calculated by dividing the earnings attributable to ordinary shareholders by the weighted average number of Ordinary Shares outstanding during the period. The Group has only issued ordinary shares in issue, and as such no profit reconciliation was disclosed.
2025 | 2024 | |||||
US $ | US $ | |||||
Earnings attributable to equity holders of the Group (US$) | (17,079,937) | 19,156,025 | ||||
Weighted average number of ordinary shares in issue: | ||||||
Basic | 174,020,150 | 196,539,893 | ||||
Effect of employee share options |
|
|
|
| - | 100,000 |
Diluted | 174,020,150 | 196,639,893 | ||||
Basic earnings per share | (0.10) | 0.10 | ||||
Diluted earnings per share | (0.10) | 0.10 | ||||
Diluted earnings per share is calculated by dividing the earnings attributable to ordinary shareholders by the sum of weighted average number of (1) Ordinary Shares outstanding during the period and (2) any dilutive potential Ordinary Shares outstanding as at 31 December 2025.
Diluted EPS includes impact of vested Employees Share Option Awards whose strike price was below Tekcapital's share price as quoted on the AIM market, which would have no dilutive impact on shares.
The Group completed placements of total of 26,554,397 new ordinary shares during the financial year.
11. INVESTMENTS OF THE GROUP
Entity name | Country of incorporation | Proportion of ordinary shares directly and indirectly held |
| Nature of business | Capital and reserves as at 31 Dec 2025 | Net Profit/(Loss) for year ended 31 Dec 2025 | ||||
The following are under ownership of Tekcapital Europe Limited | US$ | US$ | ||||||||
Lucyd Limited | England and Wales | 100% | Provider of high-tech eyewear | (1,947,549) | (1,052,402) | |||||
Innovative Eyewear Inc1 | United States of America | 5% | Provider of high-tech eyewear | N/A5 | N/A | |||||
MicroSalt plc | England and Wales | 58% | Developer of low sodium salt and snack foods | N/A | N/A | |||||
MicroSalt Inc2* | United States of America | 92% | Developer of low sodium salt and snack foods | N/A | N/A | |||||
Guident Limited | England and Wales | 100% | Developer of autonomous vehicle software safety solutions | N/A | N/A | |||||
Guident CORP3* | United States of America | 91% | Developer of autonomous vehicle software safety solutions | (5,484,994) | (7,504,776) | |||||
GENIP plc | England and Wales | 54% | Developer of GenAI IP services | |||||||
Smart Food Tek Limited[19] | England and Wales | 100% | Developer for baked food coating to reduce fat | (116,114) | - | |||||
(1) owned by Lucyd Limited
(2) owned by MicroSalt plc
(3) owned by Guident Limited
(4) Smart Food Tek Ltd was dissolved on 20 June 2024
(5) not available as of date of this report
As at the year end, the Group has no interest in the ownership of any other entities or exerts any significant influence over or provides funding which constitutes an "unconsolidated structured entity".
All UK subsidiaries are exempt from the requirement to file audited accounts by virtue of section 479A of the Companies Act 2006.
Tekcapital Europe Ltd (registered address 12 New Fetter Lane, London, United Kingdom, EC4A 1JP) and Tekcapital LLC (registered address 11900 Biscayne Blvd, Suite 630, Miami, Florida, 33181, United States) are consolidated by Tekcapital plc because they continue to provide IP search services and management services. Tekcapital plc owns 100% of both entities.
All other entities are measured at fair value through profit and loss based in IFRS 10 as referenced in Note 2.4, including 100% owned Lucyd Ltd and Guident Ltd which represent portfolio companies of the Group. The Group provides management service support to Lucyd Limited, and Guident Limited, as well as has provided working capital assistance through convertible loan note financing (see also Note 12) to Guident and Microsalt. The Group also assists the entities with their fundraising activities.
12. FINANCIAL ASSETS AT FAIR VALUE THROUGH PROFIT AND LOSS
The Group's financial assets at fair value through profit and loss consist of equity investments (2025:US $46,945,647, 2024:US $61,454,673) and convertible loan notes (2025:US$ 7,869,442 2024:US $7,747,071) totalling US $54,252,769 (2024:US $69,201,744).
12.1 EQUITY INVESTMENTS
The Group's investments in portfolio companies in the years ended 31 December 2025 and 31 December 2024 are listed below. The principal places of business for portfolio companies listed below is the UK and in the U.S.
Group | Proportion of ordinary shares as at 31 Dec 2025 | 1 Jan 2025 | Additions | Disposal | Foreign Exchange movement | Fair Value change | 31 Dec 2025 |
|
| US $ | US $ | US $ | US $ | US $ | US $ |
Guident Limited | 100% | 18,083,264 | 2,282,356 | - | - | 2,557,544 | 22,923,164 |
Lucyd Limited | 100% | 1,297,275 | - | - | (1,038,729) | 258,547 | |
MicroSalt plc | 58% | 36,928,090 | (582,267) | 2,701,052 | (16,799,089) | 22,247,785 | |
Belluscura plc | 0% | 970,362 | - | - | (970,362) | - | |
Smart Food Tek Ltd | 100% | 38,422 | - | - | 38,422 | ||
GEN IP plc | 54% | 4,137,260 | - | 304,470 | (2,964,000) | 1,477,729 | |
Total Balance |
| 61,454,673 | 2,282,356 | (582,267) | 3,005,522 | (19,214,637) | 46,945,647 |
Group | Proportion of ordinary shares as at 31 Dec 2024 | 1 Jan 2024 | Additions | Disposal | Foreign Exchange movement | Fair Value change | 31 Dec 2024 |
| US $ | US $ | US $ | US $ | US $ | US $ | |
Guident Limited | 100% | 18,083,264 | - | - | - | - | 18,083,264 |
Lucyd Limited | 100% | 2,189,794 | - | - | - | (892,519) | 1,297,275 |
MicroSalt Limited | 69% | 16,671,147 | 1,397,557 | - | (306,412) | 19,165,798 | 36,928,090 |
Belluscura Plc | 5% | 4,142,941 | - | (1,047,122) | (42,968) | (2,082,489) | 970,362 |
GEN IP plc | 63% | - | 319,133 | - | (7,855) | 3,825,982 | 4,137,260 |
Smart Food Tek Limited | 100% | 38,422 | - | - | - | - | 38,422 |
Total Balance |
| 41,125,568 | 1,716,690 | (1,047,122) | (357,235) | 20,016,772 | 61,454,673 |
The valuation techniques used fall under, Level 1 - Observable inputs that reflect quoted prices (unadjusted) for identical assets or liabilities in active markets, Level 2 - inputs other than quoted prices included in Level 1 that are observable for the asset or liability either directly or indirectly, and Level 3- Other techniques as defined by IFRS 13. These techniques were deemed to be the best evidence of fair values considering the early stage of portfolio companies.
Due to the Group being a majority shareholder for Microsalt plc and GenIP plc as of 31 December 2025, the control premium of 15% was applied to both companies and the Group's investment in both companies was classified under Level 3, unchanged from 31 December 2024 classification. Fair value measurement hierarchy for financial assets as at 31 December 2025 with comparative amounts as of 31 December 2024:
Total | Level 1 | Level 2 | Level 3 | ||
31 December 2025 | US$ | US$ | US$ | US$ | |
Belluscura plc | - | - | - | - | |
Lucyd Limited | 258,547 | 258,547 | - | - | |
Guident Limited | 22,923,164 | - | - | 22,923,164 | |
Microsalt plc | 22,247,785 | - | - | 22,247,785 | |
Smart Food Tek Limited | 38,422 | - | - | 38,422 | |
GEN IP plc | 1,477,729 | - | - | 1,477,729 | |
Total Balance | 46,945,647 | 258,546 | - | 46,687,100 |
|
| |||||
31 December 2024 | Total | Level 1 | Level 2 | Level 3 | |
US$ | US$ | US$ | US$ | ||
Belluscura plc | 970,362 | 970,362 | - | - | |
Lucyd Limited | 1,297,275 | - | 1,297,275 | - | |
Guident Limited | 18,083,264 | - | - | 18,083,264 | |
GENIP plc | 4,137,260 | - | - | 4,137,260 | |
Microsalt plc | 36,928,090 | - | - | 36,928,090 | |
Smart Food Tek Limited | 38,422 | - | - | 38,422 | |
Total Balance | 61,454,673 | 970,362 | 1,297,275 | 59,187,036 |
|
GUIDENT LTD (US$2.6M GAIN)
The Net Book Value of Guident Ltd of $22,923,164 as of 31 December 2025 consists of valuation of 22,586,641 shares of Guident CORP, as determined by the valuation of $25,000,000 established for the August 2025 Convertible Promissory Note sale of $421,000 to third party investors. With 5,200,267 shares held by Guident Ltd, equivalent to 91.6% of Guident CORPs issued shares, price of $4.41 per share was applied to Guident Ltd's holding resulting in valuation of $22,923,164. As a result, fair value gain of US$2,557,544 was recorded in addition to the cost basis increase of $2,282,356 due conversion of Convertible Loan Note into Guident CORP's shares in January 2025.
This input was corroborated by Guident CORP's enterprise valuation by applying the forward revenue multiple on Company's estimated revenue projections.
Key assumptions used in management's valuation are:
- Estimated revenue projections: calculated as midpoint between annualised expected 2026 revenue and 2027 projected revenues.
- Price to sales ratio of 6.3x applied to projected sales, based on an average of price-to-sales ratios of comparable companies.
The discounted cash-flow method did not provide an indication that the valuation at year end was materially misstated.
MICROSALT (US$16.8M LOSS)
The fair value of the holding decreased by US$15,082,224 during the year due to:
- movement in the Company's share price on AIM market of London Stock Exchange, and closing price of 44p as of 31 December 2025 compared to opening price of 76.50p, creating a US$17,984,109 fair value loss,
- Fair value of the control premium given Tekcapital's majority shareholding of US$2,901,885, calculated as 15% of Company's shareholding in Microsalt.
The Company disposed of 598,214 shares of Microsalt plc in February 2025 and June 2025 for total of US$582,267 and recorded a foreign exchange adjustment of US$2,701,052. With total of 32,707,535 shares held by Tekcapital Europe Ltd, a fair value of US$22,247,785 was arrived at as of 31 December 2025.
BELLUSCURA PLC (US $1M LOSS)
The fair value of the holding decreased by US$ 970,362 during the year due to write off of Tekcapital Group's investment in Belluscura. Belluscura experienced a severe financial collapse in late 2025 following the Chapter 7 bankruptcy filing of its wholly owned U.S. operating subsidiary, Belluscura LLC on 29 October 2025. Subsequent foreclosure and sale of the subsidiary's assets by its secured lender materially impaired Belluscura plc's financial position.
LUCYD (US $0.9M LOSS)
The fair value of the holding decreased by US$ 1,038,729 during the year due to the movement in the Company's share price at NASDAQ market, and closing price of US$1 as of 31 December 2025, compared to US$5 as of 31 December 2024. With 259,455 shares held by the Group, a fair value of US$ 258,547 was arrived at as of 31 December 2025. This investment is classified as Level 2 on the basis of the fact that the direct shareholding is in Lucyd Ltd, whose primary asset is the listed investment in Innovative Eyewear Inc.
GENIP PLC (US $3.0M LOSS)
The fair value of the holding decreased by US$3.0m during the year due to:
- movement in the Company's share price at AIM market of London Stock Exchange, and closing price of 0.865p as of 31 December 2025.
- Fair value of the control premium given Tekcapital's majority shareholding of US$192,747, calculated as 15% of Company's shareholding in GenIP.
With total of 11,050,769 shares held by Tekcapital Europe Ltd, a fair value of US$1.3m was arrived at as of 31 December 2025. Combined with fair value of control premium of $0.19m, total fair value of $1.5m was calculated as of 31 December 2025.
SMART FOOD TEK (NIL GAIN / NIL LOSS)
Considering early commercialisation stage, the Group records its investment in Smart Food Tek at cost. The directors do not consider that any other available information would materially change or give a more reliable representation of the value.
The Group exercised judgment in determination of sufficiency of portfolio companies' cash reserves, forecasts and ability to raise money to achieve their fair values. Directors reviewed and questioned the forecasts used, standing liquidity and working capital balances, as well as discussed capability and plans to raise money in the future with directors or management of portfolio companies. Based on the review, the Group made a positive determination as to portfolio companies' likely ability to achieve fair values considering liquidity factors.
The significant unobservable inputs used in the fair value measurement categorised within Level 3 of the fair value hierarchy, together with a quantitative sensitivity analysis as at 31 December 2024 are shown as below. No sensitivities have been disclosed on immaterial, non-listed investments as the fair value equates to cost.
Investment | Valuation | Significant | Estimate | Sensitivity of the input |
| |
Technique | unobservable | applied | to fair value |
| ||
input |
| |||||
Guident* | Forward Revenue Multiple | Forward revenue multiple | 6.3 | A 1.0x increase in the forward revenue multiple would increase the Guident enterprise valuation by approximately US$5.0m. A 1.0x decrease in the forward revenue multiple would decrease the Guident enterprise valuation by approximately US$5.0m. | ||
Microsalt | Share price per LSE including control premium | Control premium | 15% | A 5% increase in the control premium applied to valuation of Microsalt plc shares held by increase the Microsalt plc valuation by US$1m. A 5% decrease in the control premium applied to valuation of Microsalt plc shares would decrease the Microsalt valuation by US$1m.
| ||
GenIP |
Share price per LSE including control premium |
Control premium |
15% | A 5% increase in the control premium applied to valuation of GENIP plc shares held by increase the Microsalt plc valuation by US$0.1m. A 5% decrease in the control premium applied to valuation of GenIP plc shares would decrease the GenIP valuation by US$0.1m. | ||
The fair value of the Group's investment in Guident has been determined using a forward revenue multiple methodology. The valuation incorporates management's estimates of future revenues together with an assessment of market-based revenue multiples derived from comparable companies operating within the autonomous vehicle, remote monitoring and mobility technology sectors.
The selected forward revenue multiple of 6.3x was determined with reference to observable market data from comparable companies. Comparable company revenue multiples observed during the valuation assessment ranged from 4.9x to 12.4x. In determining the selected multiple, management considered the relative stage of commercial development, market positioning, growth expectations and execution risks associated with Guident.
Revenue forecasts applied within the valuation model represent significant unobservable inputs and are inherently judgemental. These forecasts have not been separately disclosed as they are considered commercially sensitive forward-looking information in light of ongoing strategic and capital markets considerations.
The sensitivity analysis presented above reflects management's assessment of reasonably possible changes in the selected valuation multiple at the reporting date. The valuation remains sensitive to changes in both market valuation conditions and the achievement of forecast operational performance.
12.2 CONVERTIBLE LOAN NOTES
During the year, the Group also held multiple convertible loans issued by its portfolio companies, including:
• Convertible note issued by Guident Ltd for the total of US$5,000,000, issued at 10% coupon rate including option to convert the debt into shares at market price (no discount against future equity placements offered). The note can be converted into Guident's equity upon occurrence of certain conversion events including future share placements. The US$3,000,000 note originated in September 2023 or can be converted into Guident's equity upon occurrence of certain conversion events. No conversions occurred during the period. As of 31 December 2025, US$5,000,000 was outstanding.
• A convertible loan note issued by Microsalt Inc was constituted on 1 March 2023. The principal amount of convertible loan notes was limited to US$2,000,000. The convertible loan notes carry interest at the rate of 10 per cent per annum. As of 31 December 2025, US$2,000,000 was outstanding on the convertible loan notes, compared to US$2,000,000 as of 31 December 2024.
• A convertible loan note issued by Microsalt Inc was constituted by the Company on 7 November 2023. The principal amount of convertible loan notes was limited to US$2,000,000. The convertible loan notes carry interest at the rate of 10 per cent. per annum. As of 31 December 2025, US$869,442 was outstanding on the convertible loan notes, compared to US$747,072 as of 31 December 2024.
The Group's investments in convertible notes in the years ended 31 December 2025 and 31 December 2024, as well as their fair value hierarchy, are listed in tables below:
Group | 31 Dec 2024 | Additions | Disposal | FX reval | Fair Value change | 31 Dec 2025 |
| US $ | US $ | US $ | US $ | US $ | US $ |
Guident Corp | 5,000,000 | 2,282,356 | (2,282,356) | - | - | 5,000,000 |
Microsalt plc | 2,747,072 | 139,982 | - | (17,612) | - | 2,869,442 |
Total Balance | 7,747,072 | 2,422,338 | (2,282,356) | (17,612) | - | 7,869,442 |
Group | 31 Dec 2023 | Additions | Disposal | FX reval | Fair Value change | 31 Dec 2024 |
| US $ | US $ | US $ | US $ | US $ | US $ |
Guident Corp | 3,000,000 | 2,000,000 | - | - | - | 5,000,000 |
Microsalt plc | 2,528,427 | 552,964 | (334,319) | - | - | 2,747,072 |
Total Balance | 5,528,427 | 2,552,964 | (334,319) | - | - | 7,747,072 |
Included in additions are non-cash movements for both, in relation to management services income of US$140,329 (Guident CORP) and interest income of US$743,013 (US$464,559 for Guident CORP and US$269,454 for Microsalt Inc).
Total | Level 1 | Level 2 | Level 3 | |
31 December 2025 | US $ | US $ | US $ | US $ |
Guident Corp | 5,000,000 | - | - | 5,000,000 |
Microsalt plc | 2,869,442 | - | - | 2,869.442 |
Total Balance | 7,869,442 | - | - | 7,869,442 |
|
|
|
| |
31 December 2024 | Total | Level 1 | Level 2 | Level 3 |
| US $ | US $ | US $ | US $ |
Guident Corp | 5,000,000 | - | - | 5,000,000 |
Microsalt Inc | 2,747.072 | - | - | 2,747,072 |
Total Balance | 7,747,072 | - | - | 7,747,072 |
The fair value of the convertible loans issued by Guident Corp and MicroSalt has been calculated using a Discounted Cash Flow Analysis. The unobservable input used in the fair value assessment is the discount rate of 10%. Increasing or decreasing the discount rate by 2% used would not result in material changes in the fair value of the assets for Guident and Microsalt.
12.3 INTEREST FROM FINANCIAL ASSETS AT FAIR VALUE THROUGH PROFIT AND LOSS
The Group earned following interest income from its portfolio companies during the period:
31/12/2025 | 31/12/2024 | |
Microsalt Inc | 269,454 | 303,900 |
Guident Corp | 464,559 | 439,068 |
Gen IP plc | - | 237 |
Total Balance | 734,013 | 743,205 |
13. PROPERTY, PLANT AND EQUIPMENT
GROUP | Leasehold Improvements | Office equipment | Computer Equipment | Total |
US $ | US $ | US $ | US $ | |
Opening cost 1 December 2023 | 17,541 | 37,066 | 31,269 | 85,877 |
Additions | - | - | - | - |
Closing cost 31 December 2024 | 17,541 | 37,066 | 31,269 | 85,877 |
Additions | - | - | 1,070 | 1,070 |
Closing cost 31 December 2025 | 17,541 | 37,066 | 32,339 | 86,47 |
|
|
|
|
|
Accumulated depreciation and impairment |
| |||
Accumulated depreciation at 31 Dec 2023 | (13,775) | (27,482) | (30,348) | (71,605) |
Depreciation charge | (3,766) | (2,556) | (797) | (7,119) |
Accumulated depreciation at 31 December 2024 | (17,541) | (30,038) | (31,145) | (78,724) |
Depreciation charge | - | (2,557) | (424) | (2,981) |
Accumulated depreciation at 31 December 2025 | (17,541) | (32,595) | (31,569) | (81,705) |
| ||||
Closing net book value 31 December 2024 | - | 7,028 | 124 | 7,152 |
Closing net book value 31 December 2025 | - | 4,471 | 770 | 5,241 |
14. TRADE AND OTHER RECEIVABLES
|
| 2025 |
| 2024 | ||
|
| US $ | US $ | |||
Trade receivables |
|
| - | |||
Trade receivables - net |
|
|
| - | ||
Vat recoverable | - |
| 47,848 | |||
Prepayments | 26,084 |
| 25,121 | |||
Receivables from related parties | 1,149,207 |
| 571,396 | |||
Total trade and other receivables | 1,175,291 |
| 644,365 | |||
The fair value of trade and other receivables are not materially different to those disclosed above. The credit loss allowance was assessed for the Group as at 31 December 2025 and there was no increase/decrease in the expected credit loss allowance (2024: $nil). Group's exposure to credit risk related to receivables from related parties is detailed in Note 3 to the consolidated financial statements.
15. CASH AND CASH EQUIVALENTS
GROUP | 2025 | 2024 | |||
| US $ | US $ | |||
Cash at bank and in hand | 529,193 |
| 786,290 | ||
Total cash and cash equivalents | 529,193 | 786,290 | |||
16. CATEGORIES OF FINANCIAL ASSETS AND FINANCIAL LIABILITIES
GROUP | 2025 | 2024 | |||||
|
| US $ | US $ | ||||
Financial assets at fair value through profit and loss | 54,252,771 |
| 69,201,744 | ||||
Financial assets at amortised cost | 1,149,207 |
| 571,396 | ||||
Cash and equivalents at amortised cost | 529,193 |
| 786,290 | ||||
55,931,170 | 70,559,430 | ||||||
Financial liabilities | |||||||
Trade and other payables at amortised cost | 843,901 | 538,800 | |||||
17. SHARE CAPITAL
| Number | Ordinary | Total | |
Group and Company | of shares | Share US$ | US $ | |
Issued and fully paid up |
|
|
| |
As at 31 December 2023 | 178,088,262 | 973,329 | 973,329 | |
Shares issued in further public offering | 33,331,709 | 168,742 | 168,742 | |
As at 31 December 2024 | 211,419,971 | 1,142,071 | 1,142,071 | |
Shares issued in further public offering | 26,554,397 | 140,855 | 140,855 | |
As at 31 December 2025 | 237,974,268 | 1,282,926 | 1,282,926 | |
The shares have full voting, dividend and capital distribution (including on winding up) rights; they do not confer any rights of redemption. The following shares were issued during the year:
• January 2025: 5,128,205 shares were issued in the placing of new ordinary shares at £0.098. Total proceeds of US$611,850 were netted against cost of raising finance in the amount of US$18,539.
• June 2025: 17,857,144 shares were issued in the placing of new ordinary shares at £0.07. Total proceeds of US$1,690,058 were netted against cost of raising finance in the amount of US$120,224.
• October 2025: 3,569,048 shares issued in the placing of new ordinary shares at £0.10. Total proceeds of US$503,439 were netted against cost of raising finance in the amount of US$15,345.
The Company has authorised share capital of 237,974,268 with a nominal value of £0.004. Of these shares, 237,974,268 were issued and fully paid up.
18. TRADE AND OTHER PAYABLES
The fair values of trade and other payables are not materially different to those disclosed below.
The Group's exposure to currency and liquidity risk related to trade and other payables is detailed in note 3 to the accounts.
| 2025 | 2024 | ||
Group | US $ | US $ | ||
Trade creditors | 79,695 |
| 105,530 | |
Amounts due to related parties | 624,632 |
| 307,556 | |
Social security and other taxes | 15,774 |
| 10,423 | |
Accruals and other creditors | 139,573 |
| 125,216 | |
| 859,674 | 548,725 |
19. DEFERRED REVENUE
No material changes to the Group's deferred revenue balance of US$22,844 as of 31 December 2024 were made. The deferred revenue is expected to be recognized during next 2 years.
20. DEFERRED INCOME TAX
Unused tax losses for which no deferred tax assets have been recognised are attributable to the uncertainty over the recoverability of those losses through future profits and do not expire. A tax rate of 25% has been used to calculate the potential deferred tax.
|
| 2025 | 2024 | |
Deferred tax |
| US $ | US $ | |
Depreciation in excess of capital allowances | (745) | (10,508) | ||
Short term timing difference | - | - | ||
Tax losses | (2,090,017) |
| (2,291,306) | |
Unprovided deferred tax asset | 2,089,272 | 2,301,814 | ||
| - |
| - |
21. DIVIDENDS
No dividend has been recommended for the period ended 31 December 2025 (2024: Nil) and no dividend was paid during the year (2024: Nil).
22. COMMITMENTS
Capital commitments
The Group entered into multiple convertible loan note agreements with its portfolio companies. Please see note 12 for details regarding outstanding commitments from these agreements.
Lease commitments
The Group did not have any material contracts withing the scope of IFRS 16. Consequently, the Group did not recognise any right-of-use assets and lease liabilities during the period.
23. SHARE BASED PAYMENTS
The Group operates an approved Enterprise management scheme and an unapproved share option scheme. Both schemes include typically 3-year vesting period and 5-year option life, with exercise price based on the grant date.
The fair value of the equity settled options granted is expensed over the vesting period and is arrived at using the Black-Scholes model. The assumptions inherent in the use of this model are as follows:
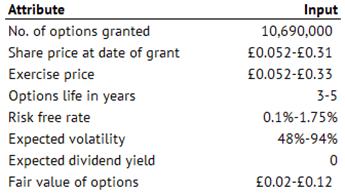
The weighted average fair value of options outstanding was £0.05p. Volatility was calculated using Group's historical share price performance since 2017. The share-based payment expense for the year was US$34,456 (2024: US$84,585). Details of the number of share options and the weighted average exercise price outstanding during the year as follows:
2025 | 2025 | 2024 | 2024 | |
Avg. Exercise | Options | Avg. Exercise | Options | |
| price per | (Number) | price per | (Number) |
Group and Company | share £ | share £ | ||
As at 1 January 2025 |
0.26 |
9,785,000 | 0.2746 | 8,865,000 |
Granted | - | - | 0.111 | 2,400,000 |
Exercised | - | - | - | - |
Forfeited/expired | 0.17 | (5,635,000)** | 0.0783 | (1,480,000) |
As at 31 December 2025 | 0.21 | 4,150,000 | 0.26 | 9,785,000 |
Exercisable as at period end |
| 2,166,667 | 6,696,667 |
The weighted average exercise price for the options exercisable as at 31 December 2025 and 31 December 2024 was £0.17p and £0.17p respectively.
*includes primarily options expiring "out-of-the-money".
The weighted average remaining contractual life is 2.4 years (2024: 2.0 years).
The range of exercise prices for options outstanding at the end of the year was £0.11p - £0.325p (2024: £0.052p - £0.325p).
24. RELATED PARTY TRANSACTIONS
Details of Directors' remuneration and grant of options are given in the Directors' report. Please also refer to Note 8.1 for payments related to key management personnel.
Please refer to tables below for detail of relationships and transactions between The Group and its subsidiaries.
Convertible note receivable |
| |||||||||
|
|
| 2025 | 2024 | ||||||
Group |
|
| US $ | US $ | ||||||
Guident Corp | 5,000,000 | 5,000,000 | ||||||||
MicroSalt Inc | 2,869,442 | 2,747,072 | ||||||||
| 7,869,442 | 7,747,072 | ||||||||
Balances with related parties |
| |||||||||
|
|
| 2025 | 2024 | ||||||
Group |
|
| US $ | US $ | ||||||
Guident Corp | 1,136,556 | 444,651 | ||||||||
Smart Food TEK | - | 66,429 | ||||||||
Lucyd Ltd | (43,583) | (74,170) | ||||||||
Innovative Eyewear Inc | (322,820) | (11,585) | ||||||||
MicroSalt plc | (192,051) | (188,862) | ||||||||
GenIP plc | (5,707) | 11,887 | ||||||||
Other | (47,820) | 3,573 | ||||||||
| 524,575 | 263,840 | ||||||||
| ||||||||||
Management fees |
| |||||||||
|
|
| 2025 | 2024 | ||||||
Group |
|
| US $ | US $ | ||||||
Guident Corp | 140,328 | 139,842 | ||||||||
Innovative Eyewear Inc | 139,074 | 147,475 | ||||||||
| 279,402 | 326,144 | ||||||||
Interest Income |
|
| ||||||||
|
|
| 2025 | 2024 |
| |||||
Group |
|
| US $ | US $ |
| |||||
Guident Corp | 464,559 | 439,068 |
| |||||||
MicroSalt Inc | 269,454 | 303,900 |
| |||||||
GenIP plc | - | 237 |
| |||||||
| 734,013 | 743,205 |
| |||||||
Related party transactions were made on terms equivalent to those that prevail in arm's length transactions and are made only if such terms can be substantiated.
25. EVENTS AFTER THE REPORTING PERIOD
Post period end, Group announced a new placement of 18,750,000 new ordinary shares of 0.4 pence each in the Company at a price of 8 pence per share to raise £1.5m in February 2026.
On 22 May 2026, the Group announced it secured an equity stake in Vesari Inc. ("Vesari"), a new U.S. incorporated company (Vesari.ai) established to acquire, develop and commercialise artificial intelligence ("AI") related intellectual property in the field of geothermal-powered hyperscale data centres.
[1] Unrealised depreciation is the paper loss on an investment whose current market value has fallen below its previously recorded carrying value, but which has not yet been sold
[2] Post period end, the Group announced it secured an equity stake in Vesari Inc. ("Vesari"), a new U.S. incorporated company (Vesari.ai) established to acquire, develop and commercialise artificial intelligence ("AI") related intellectual property in the field of geothermal-powered hyperscale data centres.
[3] https://crashstats.nhtsa.dot.gov/Api/Public/ViewPublication/813778
[4] https://thevisioncouncil.org/
[5] https://www.prnewswire.com/news-releases/innovative-eyewear-inc-announces-record-breaking-65-annual-sales-growth-in-2025--insider-buying-intent-302654534.html
[6] https://www.citigroup.com/global/insights/ai-glasses-the-next-fast-growing-edge-device
[7] https://www.precedenceresearch.com/generative-ai-market
[8] https://www.fortunebusinessinsights.com/generative-ai-market-107837
[9] https://genip.ai/
[10] https://www.prnewswire.com/news-releases/innovative-eyewear-inc-announces-record-breaking-65-annual-sales-growth-in-2025--insider-buying-intent-302654534.html
[11] https://www.globenewswire.com/
[12] https://polaris.brighterir.com/public/tekcapital_plc/news/rns/story/r7k8mjw
[13] Powering Intelligence 2026: Updated Scenarios of U.S. Data Center Electricity Use and Power Strategies
[14] https://eta-publications.lbl.gov/sites/default/files/2024-12/lbnl-2024-united-states-data-center-energy-usage-report_1.pdf
[15] https://www.iea.org/reports/key-questions-on-energy-and-ai/executive-summary
[16] https://www.goldmansachs.com/insights/articles/ai-to-drive-165-increase-in-data-center-power-demand-by-2030
[17] ORC stands for Organic Rankine Cycle
[18] Power Usage Effectiveness is the data centre industry's standard metric for measuring how efficiently a facility uses electricity, defined as: PUE = Total facility energy ÷ IT equipment energy
Related Shares:
TekCapital