6th Oct 2025 07:00
THE INFORMATION CONTAINED IN THIS ANNOUNCEMENT IS RESTRICTED AND IS NOT FOR PUBLICATION, RELEASE OR DISTRIBUTION IN THE UNITED STATES OF AMERICA, ANY MEMBER STATE OF THE EUROPEAN ECONOMIC AREA, CANADA, AUSTRALIA, JAPAN OR THE REPUBLIC OF SOUTH AFRICA.
6 October 2025
ALTERNATIVE INCOME REIT PLC
(the "Company" or the "Group")
Annual Report and Financial Statements for the year ended 30 June 2025
The Board of Directors of Alternative Income REIT PLC (ticker: AIRE), the owner of a diversified portfolio of UK commercial property assets predominantly let on long leases with index-linked reviews, is pleased to announce its annual report and financial statements for the year ended 30 June 2025.
Financial Highlights
At 30 June
| 2025 | 2024 | Change |
Net Asset Value ('NAV') | £67.3 million | £65.1 million | 3.4% |
NAV per share | 83.64p | 80.90p | 3.4% |
Share price | 74.00p | 66.00p | 12.1% |
Share price discount to NAV A | 11.5% | 18.4% | -6.9% |
Investment property fair value (based on external valuation) | £107.4 million | £102.7 million | 4.6% |
Loan to gross asset value ('GAV') A | 36.9% | 37.7% | -0.8% |
Loan facility | £41.0 million | £41.0 million | - |
For the year ended 30 June
| 2025 | 2024 | Change |
Dividends per share | 6.20p | 5.90p | 5.1% |
Earnings per share ('EPS') | 9.02p | 2.93p | 207.8% |
EPRA EPS A | 6.57p | 5.89p | 11.5% |
Operating profit | £6.7 million | £6.2 million | 8.1% |
Dividend cover A | 108.4% | 101.5% | 6.8% |
Share price total return A | 21.6% | 11.6% | 10.0% |
Gross passing rental income | £8.1 million | £7.7 million | 5.2% |
Adjusted EPS A | 6.72p | 5.99p | 12.2% |
Profit before tax | £7.3 million | £2.4 million | 204.2% |
Dividend yield A | 8.4% | 8.9% | -0.5% |
NAV total return A | 11.1% | 3.5% | 7.6% |
Ongoing charges A | 1.57% | 1.46% | 11bps |
A Alternative Performance Measure, please see the Annual Report for further details.
Financial Highlights
· At the year end the Group is fully invested in 20 properties having acquired one property in the year.
· The net asset value ('NAV') increased 3.4% from 80.90 pence per share ('pps') to 83.64pps, mainly due to the increase in property values as a result of uplifts in rents following rent reviews.
· The dividend for the year of 6.2pps is in line with the Board's target annual dividend, and is a 5.1% increase on prior year's dividend of 5.9pps.
· Profit before tax of £7.3 million, equivalent to 9.02pps, is after a £2.0 million increase in the Group's property portfolio.
· The Group's portfolio benefits from having a strong tenant profile, being fully let, with all rent due from its tenants collected as it falls due and with over 90% of rent reviews being index linked.
· Loan to GAV of 36.9% and interest cover ratio ('ICR') of 599.8% give significant headroom on the lender's loan covenants.
Group Operational Overview
At the year end of 30 June 2025:
· The property portfolio had a fair value of £107.4 million across 20 properties (2024: £102.7 million across 19 properties).
· The European Public Real Estate Association ('EPRA') Net Initial Yield A ('NIY') was 7.1% (2024: 6.9%).
· 92.3% (2024: 95.8%) of rental income is inflation linked to the Retail Price Index or the Consumer Price Index.
· The property portfolio was fully let at both the current and previous year end.
· The weighted average unexpired lease term ('WAULT') was:
- 15.6 years to the earlier of break and expiry (2024: 16.5 years); and
- 17.2 years to expiry (2024: 18.4 years).
A Alternative Performance Measure, please see Annual Report for further details.
Income and expense during the year
· Rent recognised amounted to £7.9 million (2024: £7.4 million).
· A total of ten rent reviews took place during the year, which resulted in a combined rental uplift of £167,000, which represents a 2.2% increase on contracted rent across the portfolio.
Property transactions during the year
· One property was purchased during the year, namely Champneys Beauty School, part of the Champneys Tring Spa Resort in Tring, in December 2024 for a consideration of £2.5 million. The price reflects a net initial yield of 6.5% and, at purchase, had a weighted unexpired lease term of 14.9 years.
Significant changes to leases
· BGEN, one of the tenants at our St Helens industrial asset, has agreed to continue in occupation of their building for a further two years. In addition, a new five year lease, with annual RPI linked rent reviews was agreed at £63,750 per annum with BGEN for the adjacent land at St Helens on expiry of their previous lease.
· Active management continues with Pure Gym in London, re-gearing their lease to remove the tenant's break in 2027 with the lease extending to 2032. In Crawley, the lease to Petrogas Group UK Limited was assigned to Rontec Properties No 4 Limited, guaranteed by Rontec Roadside Retail Limited, one of the leading players in the UK forecourt industry.
Events after the reporting date
· The Group currently has borrowings of £41 million under a loan facility repayable on 20 October 2025 (the 'Loan') with Canada Life. The Board has secured long-term debt facilities with HSBC UK Bank plc (the 'New HSBC Bank Facilities'), as announced on 3 September 2025. The New HSBC Bank Facilities consist of both a fixed term loan of £31 million and a £10 million revolving credit facility, both on floating rates for a fixed term of five years with an option to extend by two years if mutually acceptable. Further details of the New HSBC Bank Facilities are contained in both the Chairman's Statement and Note 20 to the Consolidated Financial Statements - Events after the reporting date.
· Over the past few years the Group has maintained an enviable record of collecting 100% of its rent. Provided this remains the case and in the absence of any unforeseen circumstances, the Board has announced that it is targeting a dividend of no less than 5.6pps for the year ending 30 June 2026†. The resetting of this dividend target, which is lower than the previous year, is entirely due to increase in financing costs of the new facilities, which will rise significantly to approximately £2.2 million, as compared with £1.4 million in previous financial years.
† This is a target and not a formal dividend forecast or a profit forecast.
Simon Bennett, non-executive chairman of Alternative Income REIT PLC, comments:
"During the year under review, the portfolio value has increased by £4.7 million (2024: £4.3 million reduction) and at 30 June 2025 was valued at £107.4 million (2024: £102.7 million). On a like-for-like basis, the value of the Group's properties increased to £104.9 million from £102.7 million.
Over the past few years the Group has maintained an enviable record of collecting 100% of its rent. Provided this remains the case and in the absence of any unforeseen circumstances, the Board has announced that it is targeting a dividend of no less than 5.6pps for the year ending 30 June 2026† . The resetting of this dividend target, which is lower than the previous year, is entirely due to increase in financing costs of the new facilities.
The Group currently has borrowings of £41 million under a loan facility repayable on 20 October 2025 (the 'Loan') with Canada Life. As previously announced, the Board has secured new long-term debt facilities with HSBC UK Bank plc (the 'New HSBC Bank Facilities'). The New HSBC Bank Facilities consist of both a fixed term loan of £31 million and a £10 million revolving credit facility, both on floating rates for a fixed term of five years with an option to extend by two years, if mutually acceptable to both parties. The Group will use the amount drawn down under its New HSBC Bank Facilities to simultaneously repay its existing debt facilities in full.
The Group's index-linked portfolio, with its properties let on predominantly long dated and high yielding leases, has continued to perform relatively well, when compared with its peer group. On a macro level, it appears that the pathway for interest rates continues to be downwards. This should benefit the property market in general. This, in conjunction with the active asset management initiatives being undertaken by the Group and the successful refinancing of AIRE's banking facilities, give the Board confidence that the portfolio will continue to deliver an attractive yield as a result of its secure and growing rental income."
ENQUIRIES
Alternative Income REIT PLC Simon Bennett - Chairman | Via AIRE's Company Secretary, Hanway Advisory: 0207 409 0181 or by email: |
Martley Capital Real Estate Investment Management Ltd Richard Croft | 020 4551 1240 |
Jane Blore | |
Panmure Liberum Limited | 020 3100 2000 |
Alex Collins | |
Tom Scrivens | |
The Company's LEI is 213800MPBIJS12Q88F71.
Further information on Alternative Income REIT PLC is available at www.alternativeincomereit.com1
1 Neither the content of the Company's website, nor the content of any website accessible from hyperlinks on its website or any other website, is incorporated into, or forms part of, this announcement nor, unless previously published on a Regulatory Information Service, should any such content be relied upon in reaching a decision as to whether or not to acquire, continue to hold, or dispose of, securities in the Company.
NOTES
Alternative Income REIT PLC aims to generate a sustainable, secure and attractive income return for shareholders from a diversified portfolio of UK property investments, predominately in alternative and specialist sectors. The majority of the assets in the Group's portfolio are let on long leases which contain index-linked rent review provisions.
Chairman's Statement
Overview
I am pleased to present the annual audited results of Alternative Income REIT PLC (the 'Company') together with its subsidiaries (the 'Group') for the financial year ended 30 June 2025.
The year under review was one characterised by a fall in consumer and business confidence, declining inflation, low rental growth and falling interest rates. These factors were reflected in the real estate sector, where transactions have been scarce, with both investors and occupiers cautiously playing a waiting game. This has proved to be beneficial for the Group. From an income standpoint, the economic environment has seen our portfolio continuing to perform well, benefiting from its long dated and high yielding leases with index-linked rental increases. The portfolio value has increased by £4.7 million (2024: £4.3 million reduction) and at 30 June 2025 was valued at £107.4 million (2024: £102.7 million). On a like-for-like basis, the value of the Group's properties increased to £104.9 million from £102.7 million.
The portfolio should continue to perform relatively well during a period of higher inflation, as 92.3% of its rental income is subject to index-linked reviews and 25.6% of rental income is not subject to any cap on rental increases. During the financial year, a total of 10 rent reviews took place, resulting in a combined rental uplift of £167,000, that represents a 2.2% increase on contracted rent across the Company's portfolio.
During the year, one property transaction completed, being the purchase of Champneys Beauty College in Tring, for a consideration of £2.5 million (net of acquisition costs).
The Board has been working, in conjunction with its debt adviser, to refinance the Group's existing debt. Largely as a result of AIRE's excellent track record in recent years, its outstanding record on rent collection and the very low Loan To Value ('LTV') of its portfolio, AIRE secured separate offers of long-term finance from several different lending institutions, all on a competitive basis.
Consequently, the Board announced on 3 September 2025 that the Group has secured new long-term debt facilities with HSBC UK Bank plc ('HSBC'). The facilities consisting of both a fixed term loan of £31 million and a £10 million revolving credit facility.
Together with the active asset management initiatives being undertaken, the Board considers that the portfolio will continue to deliver an attractive yield as a result of its secure and improving rental income. These, together with less volatile inflation and the anticipated continued downward trajectory of UK interest rates provides a stabilising background for the property market.
At the year end, the portfolio has maintained the net initial yield at 7.1% and a WAULT to the first break of 15.6 years and 17.2 years to expiry (30 June 2024: 16.5 and 18.4 years, respectively).
Refinancing of the Group's Debt
The Group today has a fully utilised £41.0 million loan facility with Canada Life, with a weighted average interest cost of 3.19%. This facility will be repaid on its due date of 20 October 2025. There are currently no penalties projected for repaying this existing loan facility.
As mentioned above, the Group has now secured new long term-debt facilities with HSBC ('New HSBC Bank Facilities') totalling £41 million, which are for a fixed term of five years from the date of drawdown, which can be extended on request by a further two years, should this be mutually acceptable to both parties. The New HSBC Bank Facilities consist of a fixed term loan of £31 million and a £10 revolving credit facility ('RCF').
Whilst there is no present intention, AIRE have the right, through an accordion mechanism, to request an increase in the size of the RCF by up to a further £10 million, over the course of the facility.
The Board is also pleased to report that the margin on the New HSBC Bank Facilities of 170 basis points (1.7% per annum) over SONIA (sterling overnight index average rate), represents a significant reduction in margin when compared with the Group's existing debt facilities, albeit against a backdrop of higher base interest rates, as set out below. In addition, the financial covenants in the New HSBC Bank Facilities represent improved terms to the Group, being based on a Loan to Value covenant which is not to exceed 60% and an Interest Cover Ratio to be greater than 160%.
The Board intend to take advantage of the lower interest rates on AIRE's existing debt facilities, until these facilities are repaid on 20 October 2025. The Group will use the amount drawn down under its New HSBC Bank Facilities to simultaneously repay its existing debt facilities in full.
Dividends and Earnings
During this financial year, the Company declared four interim dividends totalling 6.2 pence per share ('pps') (30 June 2024: 5.9pps), which is in line with the previously announced dividend target of 6.2pps (30 June 2024: 5.9pps), representing a 5.1% increase on the previous year. I am pleased to report that these dividends were covered by cash earnings.
As set out in Note 8 to the Consolidated Financial Statements, dividends were covered by the Group's Adjusted EPS (representing cash) of 6.72pps (2024: 5.99pps). All dividends were paid as Property Income Distributions ('PIDs').
Historically the Board has paid dividends in four instalments each financial year. The Board intends to continue with this practice by making dividend payments in November, February, May and August each year. In order to do this, all dividends need to be declared and paid as interim dividends. The Board, however, recognises that this precludes shareholders from having the opportunity to vote on a final dividend. Recognising this, and although not required to do so, Resolution 8 in the AGM notice gives shareholders the opportunity to vote on this dividend policy.
Over the past few years, including during the global COVID pandemic, AIRE has maintained an enviable record of collecting 100% of its rent. Provided this remains the case, and in the absence of any other unforeseen circumstances, the Board is targeting a dividend of no less than 5.6† pps for the year ending 30 June 2026. The resetting of this dividend target, which is lower than the previous year, is entirely due to the increase in financing costs on the new facilities, which will rise significantly to approximately £2.2 million, compared with £1.4 million in previous financial years.
† This is a target and not a formal dividend forecast or a profit forecast.
Discount
The discount of the share price to NAV at 30 June 2025 narrowed to 11.5% (30 June 2024: 18.4%). The Board monitors the discount level throughout the year and has the authority to both issue and buy back shares. Although these powers have not been used to date, the Board believes these authorities are important powers for it to have available, if required, and therefore recommends that shareholders vote in favour of their continuance at the forthcoming AGM.
Investment Policy
The change in the Group's Investment Policy was approved by shareholders at the November 2024 AGM and all references to the Group Investment Policy within this Annual Report relate to the updated policy, which included revised sector allocation limits and minimum portfolio targets (including WAULT and inflation-linked rent thresholds). Investors
should refer to the changes outlined in the 2024 Annual Report for full details.
AGM
The Company will hold its AGM at 10:00am on Monday 10 November 2025 at the offices of JTC, The Scalpel 18th Floor, 52 Lime Street, London EC3M 7AF. As usual, the Investment Adviser will give a presentation on the Group prior to proceeding with the formal business of the AGM.
I always welcome engagement with shareholders, who should be aware that, if they are unable to attend in person, they can submit questions to the Board by emailing the Company Secretary at [email protected] or by writing to me at the Group's registered office, namely, Alternative Income REIT PLC, The Scalpel 18th Floor, 52 Lime Street, London EC3M 7AF.
Outlook
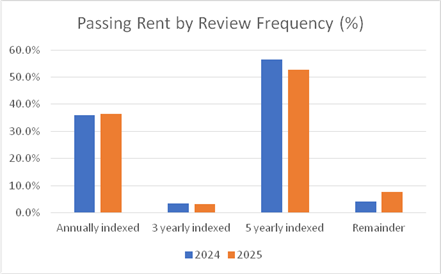
The Group's index-linked portfolio, with its properties let on predominantly long dated and high yielding leases, has continued to perform relatively well, when compared with its peer group. In the coming financial year, approximately 44.6% of the Group's income will be subject to rent reviews (36.4% as annual index-linked rent reviews and the remaining 8.2% being periodic three or five yearly index-linked rent reviews).
On a macro level, it appears that the pathway for interest rates continues to be downwards. This should benefit the property market and in conjunction with the active asset management initiatives being undertaken by the Group and the successful refinancing of AIRE's banking facilities. These factors give the Board confidence that the portfolio will continue to deliver an attractive yield as a result of its secure and growing rental income.
I would like to take this opportunity to thank my colleagues on the Board, the Investment Adviser, the Company Secretary and our other advisers and service providers, who have provided professional support and services to the Group during this financial year. The Group has a good team, to whom a large proportion of the Company's success can be attributed.
Simon Bennett
Chairman
3 October 2025
Business Model and Strategy
Business Model
Alternative Income REIT PLC is a real estate investment trust listed on the closed-ended investment funds category of the Official List of the Financial Conduct Authority ('FCA') and traded on the Main Market of the London Stock Exchange. As part of its business model and strategy, the Group has maintained and intends to maintain its UK REIT status.
The Company is governed by a Board of non-executive directors (the 'Board') and has no employees. The Board is responsible for determining the Company's investment objective and investment policy. Like many other REITs and investment companies, the day-to-day management and administration of the Company is outsourced by the Board to third party providers, including Martley Capital Real Estate Investment Management Limited ('Martley Capital') as Investment Adviser, Langham Hall Fund Management LLP as AIFM and JTC Limited as Company Secretary.
Investment Objective
The investment objective of the Group is to generate a secure and predictable income return, sustainable in real terms, whilst at least maintaining capital values, in real terms, through investment in a diversified portfolio of UK properties, predominantly within the alternative and specialist sectors.
Investment Policy
In order to achieve the investment objective, the Group invests in freehold and long leasehold properties across the whole spectrum of the UK property sector. The Group's emphasis is on alternative and specialist property sectors in order to access the attractive value and capital preservation qualities which such sectors offer.
The Group invests in properties that can generate predictable income streams through long leases which have contractual exposure to inflation rates, focussing on properties which have the ability to deliver secure income and preserve capital value, with an attractive entry yield.
The Group will supplement this with active asset management initiatives for certain properties.
Permitted sectors include, but are not limited to the following, subject at all times to the assessment of their appeal and specific asset investment opportunities: healthcare; leisure; hotels and serviced apartments; education; automotive; car parks; residential; supported living; student accommodation; logistics; storage; communications; supermarkets (within the alternative and specialist real estate sectors). In addition, permitted sectors include: offices; shopping centres; retail and retail warehouses; and industrial (being defined as 'Traditional' real estate sectors), subject to the limitations on sector exposure below.
The Group is not permitted to invest in land assets, including development land which does not have a development agreement attached, agriculture or timber.
Each investment must enable the portfolio to comply with the following minimum targets at the time of investment:
· a weighted average unexpired lease term ('WAULT') in excess of ten years;
· at least 75% of the gross passing rent being from leases with rent reviews linked to a commonly used measure of inflation (typically RPI or CPI);
· at least 50% of the gross asset value ('GAV') of properties being in alternative and specialist sectors; and
· over 90% of properties being freehold or very long leasehold (over 100 years).
Whilst each acquisition is made on a case-by-case basis, properties typically offer the following characteristics:
· a value of between £2 million and £30 million;
· existing tenants with strong business fundamentals and profitable operations;
· depth of tenant/operator demand;
· alternative use value;
· current passing rent close to or below rental value; and
· long-term demand drivers, including demographics, use of technology or built-for-purpose real estate.
The Group may invest in commercial properties or portfolios of commercial property assets which, in addition, include ancillary or secondary utilisations.
The Group may invest in corporate and other entities that hold property and the Group may also invest in conjunction with third-party investors.
The Group may engage in full or partial interest rate hedging or use derivatives to seek to mitigate the risk of interest rate increases as part of the Group's portfolio management.
Investment limits
The Group will invest and manage its assets with the objective of spreading investment risk through the following:
· Investment in a single property limited to 15% of GAV (measured at the time of investment).
· Exposure to a single tenant covenant will be limited to 15% of GAV.
· The Group may commit up to a maximum of 10% of its GAV (measured at the point of capital commitment) in development activities.
· Investment in unoccupied and non-income producing assets will, at the time of investment, not exceed 5% of Estimated Rental Value ('ERV').
The Group will not invest in other closed-ended investment companies.
If the Group invests in derivatives for the purposes of efficient portfolio and cash management, the total notional value of the derivatives at the time of investment will not exceed, in aggregate, 20% of GAV.
Borrowings
The Group may utilise borrowings with a view to enhancing returns over the medium term. Borrowings, where utilised will be on a limited recourse basis for each investment on all or part of the total portfolio and will not exceed 40% of GAV (measured at drawdown) of each relevant investment or of the portfolio.
Dividend Policy
It is the directors' intention to pay dividends in line with the Company's investment objective with interim dividends payable by four instalments quarterly in November, February, May and August in respect of each financial year to June. Additionally, the dividend policy allows for the payment of further interim dividends should compliance with the REIT rules require.
Key Performance Indicators
KPI AND DEFINITION | RELEVANCE TO STRATEGY | PERFORMANCE |
Adjusted EPS |
| 6.72pps |
Adjusted EPS from core operational activities, as adjusted for non-cash items. A key measure of a company's underlying operating results from its property rental business and an indication of the extent to which current dividend payments are supported by earnings. See Note 8 to the financial statements. | This reflects the Group's ability to generate earnings from the portfolio which underpins dividends. | For the year ended 30 June 2025 (2024: 5.99pps)
|
Dividend per share |
| 6.20pps |
Dividends declared in relation to the period are in line with the stated dividend target as set out in the Prospectus at IPO. Having achieved the target dividend of 5.70 pence per Ordinary Share per annum, the aim now is to ensure an increasing dividend in line with the Company's Investment Objective. | The Group seeks to deliver a sustainable income stream from its portfolio, which it distributes as dividends. | For the year ended 30 June 2025 (2024: 5.90pps)
|
Net Asset Value ('NAV') per share | £67.33 million / 83.64pps | |
NAV is the value of an entity's assets minus the value of its liabilities.
| Provides stakeholders with the most relevant information on the fair value of the assets and liabilities of the Group. | At 30 June 2025 (2024: £65.12 million/ 80.90pps)
|
Leverage (Loan-to-GAV) | 36.88% | |
The proportion of the Group's assets that is funded by borrowings. | The Group utilises borrowings to enhance returns over the medium term. Borrowings will not exceed 40% of GAV (measured at drawdown). | At 30 June 2025 (2024: 37.67%) |
Net Initial Yield ('NIY') | 7.07% | |
Annualised rental income based on the cash rents passing at the balance sheet date, less non-recoverable property operating expenses, divided by the market value of the property, increased with purchasers' costs estimated by the Group's External Valuers. | The NIY is an indicator of the ability of the Group to meet its target dividend after adjusting for the impacts of leverage and deducting operating costs. | At 30 June 2025 (2024: 7.06%) |
Key Performance Indicators (continued) | ||
KPI AND DEFINITION | RELEVANCE TO STRATEGY | PERFORMANCE |
Weighted Average Unexpired Lease Term ('WAULT') to break and expiry | 15.6 years to break and 17.2 years to expiry | |
The average lease term remaining to expiry across the portfolio, weighted by contracted rent. | The WAULT is a key measure of the quality of the portfolio. Long leases underpin the security of our future income. | At 30 June 2025 (2024: 16.5 years to break and 18.4 years to expiry) |
|
| |
EPRA Performance Measures
The EPRA performance measures of the Group follow. All are Alternative Performance Measures.
MEASURE AND DEFINITION | PURPOSE | PERFORMANCE |
EPRA Net Tangible Assets1 |
| £67.33 million/ 83.64pps |
The EPRA NTA deducts the break cost of bank borrowings from the EPRA NAV. | A measure that assumes entities buy and sell assets, thereby crystallising certain levels of deferred tax liability. The Group has UK REIT status and as such no deferred tax is required to be recognised in the accounts. | At 30 June 2025 (2024: £65.12 million/ 80.90pps) |
EPRA Net Reinstatement Value1 |
| £74.31 million/ 92.30pps |
The EPRA NRV adds back the purchasers' costs deducted from the EPRA NAV and deducts the break cost of bank borrowings. | A measure that highlights the value of net assets on a long-term basis.
| At 30 June 2025 (2024: £71.79 million/ 89.18pps) |
EPRA Net Disposal Value1 |
| £67.33 million / 83.64pps |
The EPRA NDV deducts the break cost of bank borrowings from the EPRA NAV. | A measure that shows the shareholder value if assets and liabilities are not held until maturity. | At 30 June 2025 (2024: £65.12 million/ 80.90pps) |
EPRA LTV2 | 34.82% | |
Debt (net of cash balances) divided by the market value of properties (including net receivables). | A key (shareholder-gearing) metric to determine the percentage of debt comparing to the appraised value of the properties. | At 30 June 2025 (2024: 35.50%) |
EPRA Earnings/EPS1 |
| £5.29 million/ 6.57pps |
Earnings from operational activities. | A key measure of a company's underlying operating results and an indication of the extent to which current dividend payments are supported by earnings. | For the year ended 30 June 2025 (2024: £4.74 million/ 5.89pps)
|
EPRA NIY2 - unaudited |
| 7.07% |
Annualised rental income based on the cash rents passing at the balance sheet date, less non-recoverable property operating expenses, divided by the market value of the property, increased with (estimated) purchasers' costs. | A comparable measure for portfolio valuations. This measure should make it easier for investors to judge themselves, how the valuation of two portfolios compare. | At 30 June 2025 (2024: 6.94%)
|
EPRA 'Topped-up' NIY2 - unaudited | 7.25% | |
This measure incorporates an adjustment to the EPRA NIY in respect of the expiration of rent-free periods (or other unexpired lease incentives such as discounted rent periods and step rents). | A comparable measure for portfolio valuations. This measure should make it easier for investors to judge themselves, how the valuation of two portfolios compare. | At 30 June 2025 (2024: 7.29%)
|
EPRA Vacancy2 - unaudited | 0.00% | |
Estimated Rental Value ('ERV') of vacant space divided by ERV of the whole portfolio. | A 'pure' percentage measure of investment property space that is vacant, based on ERV. | At 30 June 2025 (2024: 0.00%)
|
EPRA Cost Ratio2 - unaudited |
| 15.14% |
Administrative and operating costs (including and excluding costs of direct vacancy) divided by gross rental income. | A key measure to enable meaningful measurement of the changes in a company's operating costs. | For the year ended 30 June 2025 (2024: 16.36%)
|
1 The reconciliation of this APM is set out in Note 8 of the Notes to the Consolidated Financial Statements.
2 The reconciliation of this APM is set out in the EPRA Performance Measures Calculations section following the Notes to the Consolidated Financial Statements.
Investment Adviser's Report
Market Outlook
UK Economic Outlook
The UK economy, after a strong 0.7% growth in Q1 2025, has faced consecutive monthly contractions in Q2 2025 which caused growth to reduce by 0.3% in the quarter, driven by reductions in production and construction, and the onset of a US-driven trade warA. Though Q1 GDP was 4.2% above pre-pandemic levels (placing 5th in the G7)B, the Office of Budget Responsibility ('OBR') halved its 2025 GDP growth forecast to 1.0%, and independent forecasts reduced to 1.1%C. Despite this, the OBR remains optimistic, upgrading longer-term growth forecasts from 2026-2029.
UK unemployment continued its upward trend, reaching 4.7% in the three months to June 2025 - the highest level since August 2021D. This rise follows sharp increases in payroll taxes and a 6.7% increase to the national minimum wage. Despite, wages continuing to outpace inflation, unemployment is nearing a four-year high which is reducing wage growth to 5.0% in Q2 2025E; this rate is predicted to fall further to 4.2% for the entirety of 2025F. Reflecting these concerns, the British Chambers of Commerce raised their 2025 unemployment forecast to 4.7% in September, citing rising employment costs and worries about youth unemployment.
UK inflation, as measured by the Consumer Price Index ('CPI'), rose sharply to 3.8% in July, being the greatest increase since January 2024 and significantly exceeding the 2% target. This increase, more than double that seen in September 2024 of 1.7%, was anticipated by the OBR for mid-2025, primarily due to Ofgem's price cap increase amid higher energy costs and increases in food costs. Despite concerns, the OBR predicts this uplift will be temporary, with the rate falling to 3.1% by December 2025 and returning to target in Q2 2026.
Interest rates have been on a gradual downward trajectory since the August 2023 peak of 5.25%, with the Bank of England implementing three cuts so far in 2025, bringing the base rate down to 4.00%. This rate was cut at the August meeting despite signs that UK inflation might be persisting. ING forecasts an additional rate cut in November, which would further cut the rate to 3.75% by year-end, with a further two cuts expected in 2026, bringing the rate to 3.25%.
Economic sentiment among both businesses and consumers has seen modest, albeit notable, improvements throughout the first half of 2025. An Office for National Statistics ('ONS') survey in June 2025 revealed that the proportion of businesses anticipating a performance decline over the next year edged down to 11%, a positive shift from 12% in JanuaryG. Consumer confidence, as measured by the GfKH index, also experienced an uplift, rising encouragingly from -22 in January 2025 to -18 in June 2025I.
All of the above reflect a challenging environment, further complicated by a US-sparked trade war and rising employment costs. Despite this, consumer confidence has shown modest improvements. Through global geopolitical events and domestic policy decisions remain crucial factors shaping the UK's economic trajectory.
Sources:AONS (2025), Gross Domestic Product (GDP); BUK Parliament (2025), GDP international comparisons: Economic indicators; CHM Treasury (2025), Forecasts for the UK economy;DONS (2025), Unemployment rate (aged 16 and over, seasonally adjusted);EONS (2025), Average weekly earnings in Great Britain: June 2025;FBritish Chambers of Commerce, BCC Economic Forecast; GONS (2025), Business Insights and Conditions Survey (BICS); HGrowth from Knowledge Index; IUK Parliament (2025), Business and consumer confidence: Economic indicators
UK Real Estate Outlook
The UK real estate market showed mixed signals in the first half of 2025. While the latter half of 2024 saw transaction volumes recover to a two-year high, H1 2025 experienced a 28% drop in deal volume, reaching only £18.1 billion and falling below the long-term trendA. This decline was primarily due to a shortage of large-scale transactions, even though the number of deals remained relatively stable. An exception was Blackstone's acquisition of the Arch Co portfolio, the UK's largest transaction since mid-2022. The "flight to quality" continues to dominate the occupier market, with businesses prioritizing properties that boast strong Environmental, Social and Governance ('ESG') credentials and high energy efficiency. This, coupled with reduced speculative development, is fuelling increases in prime rents. Despite ongoing challenges like high operating costs and economic uncertainty, which are leading to cautious investment, the availability of flexible leases is offering occupiers crucial adaptability.
Despite ongoing economic uncertainty and market volatility, the outlook for real estate has significantly improved over the past year. CBRE's European Investor Intentions survey reveals that three-quarters of investors anticipate a market rebound by year-end, and 90% expect their purchasing activity to either increase or remain stable, injecting crucial liquidity and bolstering confidenceB. This positive sentiment is supported by a 0.9% increase in capital value across all property types in H1 2025, alongside a 12bps inwards shift for yieldsC. The improved market conditions, coupled with the ING's prediction of two further rate cuts, is likely to drive further yield compression, intensifying competition for assets and pushing prices higher in the transaction market. Investors saw a total return of 4.2% in H1, and Colliers forecasts a strong 9.8% total return for the yearD. Considering the relative stability of real estate compared to equities, particularly given potential global trade tariffs, this outlook presents a highly attractive proposition for global investment.
The UK real estate investment landscape shifted significantly in 2024, with the living sector leading the way by attracting £18.26 billion. Even with a slower first half, its appeal held strong, seeing a surge in deal activity, largely driven by overseas buyers. Investors are increasingly eyeing operational and alternative asset classes, with 75% actively exploring areas like real estate debt, purpose-built student accommodation, data centres, and life science assets. Despite strong investor preference for the industrial and logistics sector, its H1 2025 volume plummeted to £2.9 billion, well below trend, mirroring the broader market's decline in large-scale transactions. Interestingly, retail emerged as the top-performing sector in H1 2025 and is expected to maintain this over the next five years. Shopping centres and retail warehouses are forecast to generate impressive total annual returns of 10.9% and 9.4% respectively. This growth is fuelled by evolving retail concepts that cater to experiential consumer demand, coupled with limited new development due to the structural shift away from traditional retail, resulting in low vacancy rates and strong rental growth potential.
The UK REIT market experienced a strong recovery in the first six months of 2025, with the FTSE EPRA Nareit UK Index rising by 11.8%, a significant rebound from the 11.7% decline in 2024E. This positive trend saw over 76% of listed UK REITs realise share price gains. Investments in the Living space performed exceptionally well, dominating the top performers. KCR Residential REIT led the way, and key players in the care home market also contributed strongly, with Assura REIT and Target Healthcare REIT placed amongst the top five performers. AIRE also saw a positive movement, increasing by 5% to 74.0pps in the first half of the year
The UK commercial property market is undergoing a significant transformation, requiring resilience and innovation for future success. Recent challenges have necessitated a fundamental reassessment of industry practices, demanding creative investment strategies, bold occupier choices, and the agility to adapt to rapidly evolving market demands. Moving forward, interdisciplinary collaboration will be essential to unlocking value and fostering sustainable growth within the sector.
Sources:ALSH (2025), UKIT Q2 2025; BCBRE (2025), European Investor Intentions Survey 2025;CMSCI (2025), UK Monthly Data;DColliers (2025), Real Estate Investment Forecasts Quarter 2 2025;EFTSE Russell Factsheet (2025), FTSE EPRA Nareit UK Index
Portfolio Activity During the Year
The following asset management initiatives were undertaken during the year:
· The acquisition of Champneys Beauty School, part of the Champneys Tring Spa Resort in Tring, in December 2024 for £2.5 million completed the investment of the net proceeds of previous Group asset disposals. The price reflects a net initial yield of 6.5% and, at purchase, had a weighted unexpired lease term of 14.9 years.
· BGEN, one of the tenants of our St Helens industrial asset, has agreed to continue in occupation of their building for a further two years. In addition, a new five year lease, with annual RPI linked rent reviews was agreed at £63,750 per annum with BGEN for the adjacent land at St Helens on expiry of their previous lease.
· Active management continues with Pure Gym in London, re-gearing their lease to remove the tenant's break in 2027. Their lease now extends to 2032. In Crawley, the lease to Petrogas Group UK Limited was assigned to Rontec Properties No 4 Limited, guaranteed by Rontec Roadside Retail Limited, one of the leading players in the UK forecourt industry.
NAV Movements
For the year ended 30 June | 2025 | 2024 | ||
Pence per share |
£ million | Pence per share | £ million | |
NAV at beginning of year | 80.90 | 65.12 | 84.16 | 67.75 |
Change in fair value of investment property | 2.45 | 1.97 | (3.71) | (2.98) |
Income earned for the year | 10.64 | 8.57 | 9.82 | 7.90 |
Gain on disposal of property | - | - | 0.74 | 0.60 |
Finance costs for the year | (1.78) | (1.44) | (1.75) | (1.41) |
Other expenses for the year | (2.29) | (1.84) | (2.17) | (1.75) |
Dividends paid during the year | (6.28) | (5.05) | (6.19) | (4.99) |
NAV at the end of the year | 83.64 | 67.33 | 80.90 | 65.12 |
Valuation
At 30 June 2025 the Group owned 20 property assets (2024: 19) and the portfolio was valued at £107.4 million (2024: £102.7 million).
Summary by Sector at 30 June 2025
Gross | ||||||||
WAULT | Passing | |||||||
Market | Occupancy | to | Rental | |||||
Number of | Valuation | Value | by ERV | break | Income | ERV | ERV 1 | |
Sector | Properties | (£m) | (%) | (%) | (years) | (£m) | (£m) | (%) |
Industrial Warehouse | 4 | 26.6 | 24.8 | 100.0 | 22.9 | 1.9 | 1.8 | 24.7 |
Healthcare | 3 | 17.1 | 15.9 | 100.0 | 23.5 | 1.3 | 1.1 | 15.6 |
Automotive & Petroleum | 3 | 15.5 | 14.4 | 100.0 | 11.0 | 1.1 | 1.0 | 13.4 |
Hotel | 2 | 12.4 | 11.6 | 100.0 | 12.0 | 0.9 | 0.8 | 11.4 |
Residential | 1 | 10.9 | 10.1 | 100.0 | 16.1 | 0.8 | 0.8 | 11.3 |
Leisure | 3 | 10.4 | 9.7 | 100.0 | 8.5 | 1.0 | 0.8 | 10.4 |
Retail Warehouse | 1 | 5.6 | 5.2 | 100.0 | 3.8 | 0.5 | 0.4 | 5.3 |
Power Station | 1 | 4.6 | 4.3 | 100.0 | 6.7 | 0.3 | 0.3 | 4.5 |
Education | 2 | 4.3 | 4.0 | 100.0 | 16.0 | 0.3 | 0.3 | 3.4 |
Total/Average | 20 | 107.4 | 100.0 | 100.0 | 15.6 | 8.1 | 7.3 | 100.0 |
Summary by Geographical Area at 30 June 2025
Gross | ||||||||
WAULT | Passing | |||||||
Market | Occupancy | to | Rental | |||||
Geographical | Number of | Valuation | Value | by ERV | break | Income | ERV | ERV 1 |
Area | Properties | (£m) | (%) | (%) | (years) | (£m) | (£m) | (%) |
West Midlands | 4 | 27.2 | 25.3 | 100.0 | 9.6 | 2.1 | 1.9 | 26.7 |
The North West & Merseyside | 2 | 22.7 | 21.1 | 100.0 | 33.9 | 1.6 | 1.4 | 19.2 |
Rest of South East | 5 | 21.6 | 20.1 | 100.0 | 8.3 | 1.5 | 1.4 | 19.2 |
South West | 2 | 12.2 | 11.4 | 100.0 | 21.0 | 0.9 | 0.9 | 11.8 |
London | 3 | 10.4 | 9.7 | 100.0 | 8.5 | 1.0 | 0.8 | 10.4 |
Eastern | 2 | 7.1 | 6.6 | 100.0 | 9.1 | 0.5 | 0.4 | 6.1 |
Yorkshire and the Humber | 2 | 6.2 | 5.8 | 100.0 | 16.5 | 0.5 | 0.5 | 6.5 |
Total/Average | 20 | 107.4 | 100.0 | 100.00 | 15.6 | 8.1 | 7.3 | 100.0 |
1 The ERV (%) in the summary by sector and geographical area is calculated using the precise unrounded ERV figures, not the rounded ERV (£m).
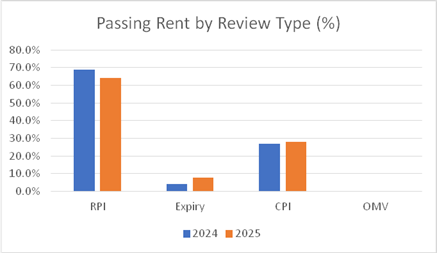
The table below illustrates the weighting of the Group's contracted rental income, based on the type of rent review associated with each lease.
Income Allocation by Type |
| |
Inflation linked - RPI Inflation linked - CPI Expiry or Open Market Value Reviews | 64.2% (2024: 69.0%) 28.1% (2024: 26.9%) 7.7% (2024: 4.1%) | |
% of Passing Rent by Rent Review Type
% of Passing Rent by Review Frequency
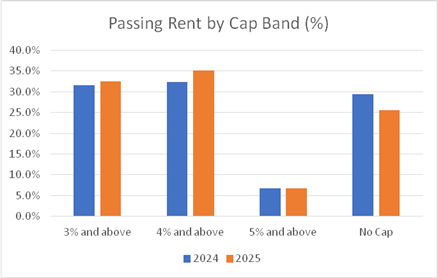
% of Passing Rent by Cap Band
Property Portfolio at 30 June 2025
Property | Sector | Region | Market Value |
1. Pocket Nook Industrial Estate, St Helens | Industrial Warehouse | The North West & Merseyside | £11.85m |
2. Bramall Court, Salford | Residential | The North West & Merseyside | £10.85m |
3. Grazebrook Industrial Estate, Works 1 & 2, Dudley | Industrial Warehouse | West Midlands | £8.05m |
4. Motorpoint, Birmingham | Automotive & Petroleum | West Midlands | £7.35m |
5. Premier Inn, Camberley | Hotel | Rest of South East | £7.00m |
6. Silver Trees, Bristol | Healthcare | South West | £6.83m |
7. Prime Life Care Home, Solihull | Healthcare | West Midlands | £6.15m |
8. Droitwich Spa Retail Park, Droitwich | Retail Warehouse | West Midlands | £5.60m |
9. Duke House, Swindon | Hotel | South West | £5.40m |
10. Virgin Active, London | Leisure | London | £5.15m |
11. Hoddesdon Energy, Hoddesdon | Power Station | Eastern | £4.63m |
12. Unit 2, Dolphin Park, Sittingbourne | Industrial Warehouse | Rest of South East | £4.60m |
13. Volvo Slough, Slough | Automotive & Petroleum | Rest of South East | £4.15m |
14. Prime Life Care Home, Brough | Healthcare | Yorkshire and the Humber | £4.10m |
15. Applegreen Petrol Station, Crawley | Automotive & Petroleum | Rest of South East | £4.00m |
16. Pure Gym, London | Leisure | London | £3.57m |
17. Champneys Beauty College, Tring | Education | Eastern | £2.50m |
18. Unit 14, Provincial Park, Sheffield | Industrial Warehouse | Yorkshire and the Humber | £2.10m |
19. YMCA Nursery, Southampton | Education | Rest of South East | £1.82m |
20. Snap Fitness, London | Leisure | London | £1.65m |
Total | £107.4m |
Top Ten Tenants at 30 June 2025
|
Annual Contracted Rental Income (£'000) | % of Portfolio Total Passing Rental Income |
WAULT to break (Years) | |
Tenants | Property | |||
Mears Group Plc | Bramall Court, Salford | 809 | 10.0% | 16.1 |
Meridian Steel Ltd | Grazebrook Industrial Estate, Dudley & Sheffield | 799 | 9.9% | 1.9 |
Prime Life Ltd | Prime Life Care Home, Brough & Solihull | 781 | 9.7% | 23.4 |
Motorpoint Ltd | Motorpoint, Birmingham | 568 | 7.0% | 12.0 |
Virgin Active Health Clubs Ltd | Virgin Active, London | 521 | 6.5% | 9.3 |
Premier Inn Hotels Ltd | Premier Inn, Camberley | 504 | 6.2% | 6.7 |
Handsale Ltd | Silver Trees, Bristol | 491 | 6.1% | 23.6 |
Travelodge Hotels Ltd | Duke House, Swindon | 403 | 5.0% | 18.9 |
B&M Bargains | Droitwich Spa Retail Park, Droitwich | 364 | 4.5% | 4.2 |
Biffa Waste Services Ltd | Pocket Nook Industrial Estate, St Helens | 353 | 4.4% | 108.2 |
Total |
| 5,593 | 69.3% | 19.1** |
\* The WAULT calculations includes an additional three years reflecting a landlord's option to extend until 31 May 2044.
*\* This WAULT calculation, which considers income solely from the top ten tenants, differs from the portfolio-wide WAULT of 15.6 years.
Tenancy Schedule
Tenant | Property | Annual Contracted Rental Income (£ '000) | Break Date | Expiry Date |
Mears Group Plc | Bramall Court | 809 | 16/08/2041 | |
Motorpoint Ltd | Motorpoint | 568 | 24/06/2037 | |
Virgin Active Health Clubs Ltd | Virgin Active | 521 | 28/09/2034 | |
Premier Inn Hotels Ltd | Premier Inn | 504 | 25/03/2032 | 24/03/2037 |
Handsale Ltd | Silver Trees | 491 | 14/01/2049 | |
Prime Life Ltd | Prime Life Care Home | 457 | 21/11/2048 | |
Travelodge Hotels Ltd | Duke House | 403 | 31/05/2044 | |
Meridian Steel Ltd | Grazebrook Industrial Estate, Works 1 & 2 | 388 | 21/05/2027 | |
B&M Bargains | Droitwich Spa Retail Park | 364 | 31/08/2029 | |
Hoddesdon Energy Ltd | Hoddesdon Energy | 333 | 27/02/2032 | 26/02/2050 |
Prime Life Ltd | Prime Life Care Home | 324 | 21/11/2048 | |
Doré Metal Services Southern Ltd | Unit 2, Dolphin Park | 307 | 13/09/2028 | 12/09/2033 |
Pure Gym Ltd | Pure Gym | 287 | 10/12/2032 | |
Volvo Car UK Ltd | Volvo Slough | 281 | 16/03/2037 | |
Meridian Steel Ltd | Grazebrook Industrial Estate, Works 1 & 2 | 259 | 21/05/2027 | |
Rontec Properties No 4 Ltd | Applegreen Petrol Station | 256 | 16/07/2033 | |
Biffa Waste Services Ltd | Pocket Nook Industrial Estate | 203 | 24/02/2133 | |
Secretary of State for Communities & Local Government | Pocket Nook Industrial Estate | 200 | 30/01/2033 | 29/01/2048 |
Champneys Tring | Champneys Beauty College | 175 | 18/04/2039 | |
MSG Life Realty Ltd | Snap Fitness | 158 | 28/03/2033 | |
Meridian Steel Ltd | Unit 14, Provincial Park | 152 | 21/05/2027 | |
Biffa Waste Services Ltd | Pocket Nook Industrial Estate | 150 | 31/03/2134 | |
YMCA Fairthorne Group | YMCA Nursery | 145 | 17/02/2044 | |
BGEN Ltd | Pocket Nook Industrial Estate | 145 | 04/04/2027 | |
Pets at Home | Droitwich Spa Retail Park | 113 | 13/01/2028 | |
BGEN Ltd | Pocket Nook Industrial Estate | 64 | 04/04/2030 | |
The Salvation Army Trustee Company | Duke House | 27 | 17/07/2032 | |
Kingscrown Land & Commercial Ltd | Pocket Nook Industrial Estate | - | 28/09/2045 | |
Camberley Properties Ltd | Premier Inn | - | 23/06/3010 | |
Southern Electric Parcel Distribution Plc | Premier Inn | - | 20/02/2111 |
*Ground rents less than £150 per annum.
Environmental, Social and Governance Report
The Group recognises that Environmental, Social and Governance ('ESG') matters are of utmost importance to sustainable investment and a focus for the business and investor community. The Group is committed to understanding how best to consider ESG factors in all facets of its business, from business strategy to investment decisions and company operations.
In order to meet investors' expectations, the Group and its advisers adopt both financial and non-financial strategies to drive long-term value with an innovative yet disciplined and conscientious approach to ESG in respect of the property portfolio management including but not limited to:
Environmental
· | A proactive approach to procurement of Energy Performance Certificate ('EPC') reassessments ahead of Minimum Energy Efficiency Standards 2023, maintaining quarterly reviews of EPC schedules, identification of opportunities to improve energy efficiency, and working closely with tenants who occupy under full repairing and insuring leases.
|
· | Ongoing environmental reviews and audits as part of regular due diligence, including regular asset inspections to avoid any breach in environmental legislation.
|
· | Responsible refurbishment in respect of all works to assets with consideration of the best approach to improving the EPC rating against potential spend, liaising with tenants in respect of any fit-out or alterations to reuse existing materials where feasible to reduce waste.
|
· | Leverage technology for data management being used to monitor and drive efficiency.
|
Social
· Commitment to occupier engagement.
· Encourage improvements to each asset such as installing defibrillators & electrical charging points.
· Provision of regular training and awareness to all managers on issues, such as wellbeing and mental health.
Governance
· Client checks being completed on all tenants as well as new suppliers and contractors.
· Regular tenant engagement and inspections to ensure assets are used as agreed within leases.
· Effective tracking of legislative requirements to assess and monitor risks and opportunities.
The Group is limited in its ability to influence ESG factors for the Group's properties as the properties are fully let on commercial full repairing leases in accordance with the Group's strategy to hold long leases.
Diversity
As an externally managed business, the Company does not have any employees or office space. As such, the Group does not operate a diversity policy with regards to any administrative, management and supervisory functions. A description of the Board's policy on director diversity can be found in the Corporate Governance Report of the Annual Report.
Employees
The Group has no employees and accordingly no requirement to report separately in this area as the management of the portfolio has been delegated to the AIFM and Investment Adviser.
The AIFM and Investment Adviser are equal opportunities employers who respect and seek to empower each individual and the diverse cultures, perspectives, skills and experiences within their workforce.
Human Rights
The Group is not within the scope of the Modern Slavery Act 2015 because it has not exceeded the turnover threshold and therefore no further disclosure is required in this regard.
Business Relationships
As well as the critical day-to-day portfolio management, the Group has service providers that ensure the smooth running of the Group's activities. The Group's key service providers are listed in the Annual Report, and the Management Engagement Committee ('MEC') annually review the effectiveness and performance of these service providers, taking into account any feedback received.
The Group, AIFM and Investment Adviser and other third-party service providers maintain high standards of business conduct by acting in a collaborative and responsible manner with all business partners that protects the reputation of the Group as a whole.
Greenhouse Gas Emissions
As an investment company, the Group's own direct environmental impact is minimal and greenhouse gas ('GHG') emissions are negligible. The GHG emissions in relation to the Group's property portfolio is disclosed below.
The Group has followed UK Government environmental reporting guidelines and used the UK Government 2025 greenhouse gas reporting conversion factors for company reporting to identify and report relevant GHG emissions over which it has Operational Control (where data is available) for the 12-month period to 30 June 2025.
An independent consultancy specialising in the application of sustainability in commercial real estate was appointed to calculate the GHG statement and provide verification on the approach used.
Scopes
GHG emissions have been reported against the following 'Scopes', as defined by the GHG Protocol and where relevant:
Scope 1 (not relevant to AIRE): Direct emissions from owned vehicles, controlled boilers and fugitive emissions from air conditioning systems under landlord control.
Scope 2: Indirect emissions from electricity purchased by the Company and consumed within real estate assets owned by the Company.
Scope 3: Indirect emissions from electricity and gas purchased/consumed within AIRE assets, by tenants, where the tenant is counterparty to the energy supply.
Statement of GHG Emissions
The table below sets out the emissions per sector and for the Group overall in the year ended 30 June 2025. The approach taken follows guidance provided by the GHG Reporting Guidelines and EPRA Best Practice Recommendations of Sustainability Reporting 2024.
Sector | Scope | Absolute tonnes of carbon dioxide equivalent (tCO2e) | Like-for-like comparison of carbon dioxide equivalent (tCO2e)* | Tonnes of Carbon dioxide equivalent per m2 (tCO2e) | |||
2024/25 | 2023/24 | Difference (tCO2e) | % change | 2024/25 | 2023/24 | ||
Retail Park | Scope 2 | 1.43 | 0.43 | 1.00 | 232% | n/a | n/a |
Industrial warehouse | Scope 3 - Elec. | 72.95 | 84.43 | -11.48 | -14% | 0.012 | 0.013 |
Total | Scope 2 & 3 | 74.38 | 84.86 | -10.48 | -12% | 0.012 | 0.013 |
*Like-for-like requires 24 months of data for the current and previous reporting year (July 2023 - June 2025). Both assets provided 24 months of data therefore like-for-like calculations were possible.
Statement of Energy Usage
The table below sets out the energy use per sector and for the Group overall. The approach follows guidance provided by the GHG Reporting Guidelines (DESNZ, 2025) and the EPRA Best Practice Recommendations on Sustainability Reporting 2024.
Sector | Energy Source | Absolute energy usage (kWh) | Like-for-like energy usage (kWh) | ||
2024/25 | 2023/24 | Difference (kWh) | % change | ||
Retail park | Electricity | 8,085 | 2,100 | 5,985 | 285%* |
Industrial warehouse | Electricity | 412,171 | 407,792 | 4,379 | 1% |
Total | Electricity | 420,256 | 409,892 | 10,364 | 3% |
*Whilst the kWh usage is low, the high increase in usage reflects rectifications to faults in specific lights in the common parts of the retail park. All the lights are now working and usage is expected to be stable in future.
Intensity Ratios
In addition to reporting relevant absolute GHG emissions (per scope and per sector), the Group has chosen to report intensity ratios, where appropriate. An intensity measure is reported for assets within the like-for-like portfolio, where:
- No major renovation or refurbishment has taken place i.e. affecting more than 50% of the building by area or number of occupants
- Occupancy is at least 75%
- At least 24 months data is available
- Emissions reported relate to an indoor area
Whilst no landlord meters reflect the above criteria for an intensity metric, the Group has applied an intensity figure for one asset, Pocket Nook, where the landlord procures the energy and directly recharges this to the tenant. An intensity metric has not been produced for Droitwich Spa retail park on the basis that the landlord-controlled meter does not reflect the above criteria (emissions reported relate to an indoor area).
No normalisation factors have been considered for this annual report.
Assurance Statement
The Group's GHG emissions have been calculated and verified by an independent third-party in accordance with the principles of ISO 14064. A full copy of the methodology used, including scope, source or data and conversion factors, is available on request.
Property Portfolio ESG Activity
During the year ended 30 June 2025, the Group has worked closely with its tenants to encourage improvements in ESG activities within the property portfolio.
Two new EPC's ratings have been carried out for BGEN in St Helens which fell from C68 to E121 due to changes in EPC grading for gas heating and for Salvation Army, Swindon which improved from D93 to B31 as a result of tenant's internal refurbishment works.
Following inspections by EPC assessors, works identified at four properties to improve EPC levels are due for completion in the year to 30 June 2026 including new LED lighting, replacement of an oil-fired boiler, solar panels and installation of secondary glazing. The costs of other enhancements will be also be borne by the occupiers. EPCs will be updated once works have been concluded.
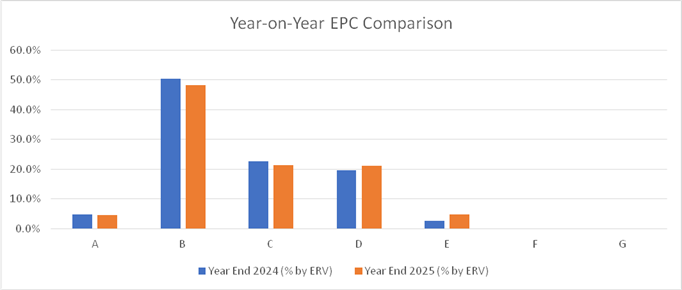
Other than the changes for BGEN's and Salvation Army's EPC rating and the introduction of the new acquisition at Tring (C) the changes within the graph above are as a result of changes to relative ERV levels particularly in rating D where ERVs for assets in Salford and Dudley have seen increases.
In the histogram above, the highest EPC rating of E applies to Unit 14 Provincial Park, Sheffield where the tenant is considering the cost efficiency of replacing their oil-fired boiler to electric and Unit 2 Pocket Nook, St Helens. Here the nature of the open-ended industrial process does not conform to EPC standard assessment, an exemption can be sought. The remaining properties in the portfolio have an EPC rating of D or above. More than half of the portfolio, at 52.8%, fall between A and B.
Section 172(1) statement
The following disclosure describes how the directors have had regard to the matters set out in section 172(1)(a) to (f) of the Companies Act 2006, in promoting the success of the Company for the benefit of members as a whole.
This section describes how the Board has regard to the likely consequences of any decision in the long term, the need to foster the Company's business relationships with suppliers, customers and others, the desirability of the Company maintaining a reputation for high standards of business conduct, and the need to act fairly as between members of the Company. The Company does not have any employees and therefore s172(1)(b) is not applicable to the Company. The impact of the Company's operations on the community and the environment is set out more fully in the Environmental, Social and Governance section above.
Stakeholder | Issues of importance | Engagement | Effect of engagement on key decisions |
Shareholders The Group's investment objective is to deliver an attractive total return to shareholders. Shareholders are directly impacted by changes to the Company's NAV and thus the share price and dividends. | · Attractive and sustainable level of income, earnings and dividends. · Long-term income stream linked to inflationary growth. · Robust corporate governance structure and well-performing service providers. · Strategic direction of the Company. · Execution of investment objective. · Value for money - low ongoing charges. | · Shareholder engagement is set out in the Corporate Governance Report in the Annual Report. · As a publicly listed Company, the Company is subject to Listing Rules and other regulatory disclosure requirements which the Board abides by with the assistance of the Company Secretary and Corporate Broker. | The effect of shareholder engagement has fed into each aspect of the Board's decision-making. The total aggregate dividends for the year have increased compared to the prior year and the Board has also worked to keep expenses under control. |
Service Providers As an externally managed REIT, the Company conducts all its business through its service providers, the key ones being the Investment Adviser, Property Manager, Company Secretary, AIFM, depositary and corporate broker. | · Reputation of the Company and maintaining high standards of business conduct. · Productive working relationships with the Company. · Fair and transparent service agreements. · Collaboration. | · Effective and consistent engagement both through formal Board meetings and regularly outside the meetings. · Annual evaluation of key service providers. · Culture set by the Board and communicated to all providers. | Clear and effective strategic oversight and culture by the Board has been crucial to enhancing the effectiveness of the Company's key service providers. The Board has worked closely with its service providers to maintain and continually improve processes and to ensure that the Company's values are aligned with them.
|
Tenants Tenants with strong business fundamentals and profitable operations are one of the key components to ensure a consistent income stream and ability to pay dividends to the Company's shareholders. | · Positive working relationship with the Board, Investment Adviser and Property Manager. · Rent reviews. · Fair lease terms. · Long-term strategy and alignment with the tenant's business operations. · Financial stability of tenants. | · To ensure the Investment Adviser and Property Manager generate and foster good relationships with our tenants. · Focus on asset management initiatives to assist our tenants where applicable. | There is regular contact between the Property Manager and all the Group's tenants. Rent reviews have all been completed on time and collection of rent at 100% is indicative of good tenant relations.
|
Debt provider The Board and the Investment Adviser maintain a positive working relationship with its current debt provider, Canada Life, and intends to continue this with the Group's new debt provider, HSBC UK Bank plc. | · Compliance with loan covenants. · Responsible portfolio management. | · Ongoing engagement by the Investment Adviser throughout the year and by the Board. | In addition to the Board and the Investment Adviser's engagement with the Company's current lender, the Board has established a good relationship and communications with the Group's new debt provider. |
Society and the environment As an investor in real estate, the Company's assets have an impact on the built environment. Environmental, Social and Governance ('ESG') factors increasingly apply alongside of financial returns. | · Responsible investing together with sustainability. · Long-term strategy to take account of ESG considerations without negatively impacting financial returns. | · Starting regular engagement with tenants in respect of EPC requirements. · Ensuring shareholder engagement covers ESG. | The Board has encouraged both the Investment Adviser and Property Manager to consider ESG on investment and on an ongoing basis. |
Principal Decisions
Principal decisions are those that have a material impact to the Group and its key stakeholders. In taking these decisions, the directors considered their duties under section 172 of the Act.
Dividend and Dividend Policy
Given the Company's Investment Objective, dividends are a key matter for the Board to consider and have a material impact on shareholders, as a key stakeholder. For the year ended 30 June 2025, the Board declared four interim dividends totalling 6.2pps (2024: 5.9pps), representing a 5.1% increase on the previous year.
Subsequent to the year end, further to the securing of refinancing of the Group's £41 million debt, the Board has announced a year ending 30 June 2026 target dividend of at least 5.6 pps†. This reflects the increased financing costs of the new debt, whilst being set at a level that meets the Group's investment objective, and was declared following consultation with the Group's major shareholders.
As last year, the Board paid four interim dividends at quarterly intervals to provide shareholders with a consistent and timely income stream. However, this dividend policy means shareholders do not have the opportunity to vote on a final dividend. Consequently, the Board is once again inviting shareholders to vote on the Company's dividend policy at the Annual General Meeting.
Property Transactions
In the year the Group acquired the Champneys Beauty School, part of the Champneys Tring Spa Resort in Wigginton, Tring for £2.5 million (net of acquisition costs to the Company). The price reflects a net initial yield of 6.5% and was acquired with a weighted unexpired lease term of 14.9 years. The acquisition reinvested the remaining proceeds from the Group's last property disposal.
Debt Refinancing
The Board considered the Company's financing and its available routes for refinancing its debt, with the Canada Life £41 million senior loan due to mature on 20 October 2025. In Q4 2025 the Board appointed Panmure Liberum as its debt adviser to assist with the refinancing. Subsequent to the year end the Board announced that it has secured £41 million of long term debt facilities with HSBC UK Bank Plc. Details of the new debt facilities are contained in both the Chairman's Statement and Note 20 to these financial statements.
† This is a target and not a formal dividend forecast or a profit forecast
Principal Risks and Uncertainties
The Group's assets consist of UK commercial property. Its principal risks are therefore related to the commercial property market in general, but also to the particular circumstances of the individual properties and the tenants within the properties.
The Board has overall responsibility for reviewing the effectiveness of the system of risk management and internal control which is operated by the AIFM and, where relevant, the Investment Adviser. The Group's ongoing risk management process is designed to identify, evaluate and mitigate the risks the Group faces.
The Board undertakes a semi-annual risk review with the assistance of the Audit Committee, to assess the adequacy and effectiveness of the AIFM's, and where relevant the Investment Adviser's, risk management and internal control systems.
The Board has carried out a robust assessment of the principal and emerging risks facing the Group, including those that would threaten its business model, future performance, solvency or liquidity.
An analysis of the principal risks and uncertainties is set out in the table below. This does not purport to be exhaustive as some risks are not yet known and some risks are currently not deemed material but could turn out to be material in the future.
PRINCIPAL RISKS AND THEIR POTENTIAL IMPACT | HOW RISK IS MANAGED | RISK ASSESSMENT | |
REAL ESTATE RISKS | |||
1. Tenant default Failure by tenants to comply with their rental obligations could affect the income that the properties earn and the ability of the Group to pay dividends to its shareholders.
Macroeconomic trends discussed through the report, including rising interest rates, higher inflation and the possibility of recession have the ability to materially impact on a tenant's business. This could result in tenants being unable to comply with their rental obligations. |
The Group's investment policy limits its exposure to any one tenant to 15% of Gross Asset Value. The maximum exposure to any one tenant (calculated by GAV) is 10.1% at 30 June 2025. The Group benefits from a balanced portfolio with a diversified tenant base and is therefore not reliant on a single tenant or sector.
In the due diligence process prior to acquiring a property, covenant checks are carried out on tenants which are repeated on a regular basis.
The Investment Adviser and Property Manager conduct ongoing monitoring and liaise with tenants to manage potential bad debt risk.
| Probability: Moderate to high
Impact: High
Movement: No change | |
2. Portfolio concentration Any downturn in the UK and its economy or regulatory changes in the UK could have a material adverse effect on the Group's operations or financial condition. Greater concentration of investments in any sector or exposure to the creditworthiness of any one tenant or tenants may lead to greater volatility in the value of the Group's investments, NAV and the Company's share price.
|
The Group has investment restrictions in place to invest and manage its assets with the objective of spreading and mitigating risk.
Having a diversified portfolio in respect of both sector and tenants provides reduced potential volatility in the portfolio and the impact rating for this risk is accordingly set at low to moderate.
| Probability: Low to moderate
Impact: Low to moderate
Movement: No change | |
3. Property defects Due diligence may not identify all the risks and liabilities in respect of an acquisition (including any environmental, structural or operational defects) that may lead to a material adverse effect on the Group's profitability, the NAV and the Company's share price. |
The Group's due diligence relies on the work (such as legal reports on title, property valuations, environmental, building surveys) outsourced to third parties that have appropriate Professional Indemnity cover in place. Both the AIFM and Board review the report produced by the Investment Manager for each prospective acquisition and will challenge accordingly.
| Probability: Low to Moderate
Impact: Moderate
Movement: No change | |
4. Rate of inflation Rent review provisions may have contractual limits to the increases that may be made as a result of the rate of inflation. If inflation is in excess of such contractual limits, the Group may not be able to deliver targeted returns to shareholders. |
The inflation linked (RPI/CPI) leases in the portfolio have contractual rent review collars, with the lowest floor being 0%, and caps that range from 3% to no cap. The majority of caps are in excess of RPI and CPI forecasts during the next five-year rent review cycle. Specifically: - Majority of caps are 4.00% or above, including a number with no caps - RPI forecast for next five years of 2.9% - CPI forecast for next five years of 2.0%
The risk of inflation is somewhat mitigated by the leases that have no cap. In addition, a total of eight leases undergo reviews annually which will allow inflation changes to be reflected expeditiously.
| Probability: Moderate
Impact: Moderate
Movement: No change | |
5. Property market Any recession or future deterioration in the property market could, inter alia, (i) lead to an increase in tenant defaults, (ii) make it difficult to attract new tenants for its properties, (iii) lead to a lack of finance available to the Group, (iv) cause the Group to realise its investments at lower valuations; and (v) delay the timings of the Group's realisations.
Any of these factors could have a material adverse effect on the ability of the Group to achieve its investment objective.
|
The Group has investment restrictions in place to invest and manage its assets with the objective of spreading and mitigating risk.
Most of the leases provide a relatively long unexpired term and contain upward only rent reviews which are linked to either RPI or CPI. Because of these factors, the Group expects that the assets will show less volatile valuation movement over the long term. | Probability: Moderate to high
Impact: Moderate to high
Movement: No change. | |
6. Property valuation Property is inherently difficult to value due to the individual nature of each property.
There may be an adverse effect on the Group's profitability, the NAV and the Company's share price in cases where properties are sold whose valuations have previously been materially overstated.
|
The Group uses an independent valuer (Knight Frank LLP) to value the properties on a quarterly basis at fair value in accordance with the accepted Royal Institution of Chartered Surveyors ('RICS') appraisal and valuation standards.
| Probability: Low to moderate
Impact: Moderate to high
Movement: No change | |
7. Investments are illiquid The Group invests in commercial properties. Such investments are illiquid; they may be difficult for the Group to sell and the price achieved on any realisation may be at a discount to the prevailing valuation of the relevant property.
|
The Group aims to hold the properties for long-term income and all property investment/ disinvestment is managed carefully to ensure there is no undue pressure on cash flow that would require a quick sale of assets.
The Company's dividend is funded from net revenue and is not affected by the portfolio's (il)liquidity.
| Probability: Low
Impact: Moderate
Movement: No change | |
8. Environment The Group is subject to environmental regulations. In addition to regulatory risk, there is a growing importance being placed on ESG credentials by tenants, which could lead to difficulty in letting vacant space.
Properties could be impacted by extreme environment events such as flooding. Climate change could accelerate more quickly leading to adverse physical impacts as well as regulatory change.
Failure by the Group to meet current or future environmental targets could result in penalties, increased costs, a reduction in asset values and have an adverse effect on the Company's reputation, leading to loss of good quality tenants.
|
The current regulations require annual mandatory Green House Gas (GHG) reporting, which will be carried out as part of the annual report and will result in minimal expenditure for the Group.
Furthermore, the Investment Adviser has prepared an ESG strategy to ensure it meets legal requirements and remains attractive to current and future tenants. Please see the 'Environmental, Social and Governance' section for further information.
In depth research is undertaken on each property at acquisition. The Investment Adviser has adopted an environmental policy which it is in the process of applying to all properties within the portfolio. | Probability: Moderate
Impact: Moderate
Movement: No change | |
BORROWING RISKS | |||
9. Breach of borrowing covenants The Group has a £41 million fixed rate loan facility, maturing 20 October 2025. Subsequent to the year end the Board has secured the refinancing of the Group's debt facilities for a minimum of five years at a floating rate of SONIA plus a margin of 1.7%. The covenants for the current and new loan facilities are shown in Notes 18 and 20, respectively.
Material adverse changes in valuations and net income, and material increases in interest rates, may lead to breaches in the LTV and interest cover ratio covenants.
If the Group is unable to operate within its debt covenants, this could lead to default and the loan facility being recalled. This could result in the Group being forced to sell properties to repay the loan facility, possibly resulting in a substantial fall in the NAV.
|
The Group monitors the borrowing covenants on a regular ongoing basis by cash flow forecasting, quarterly risk reports and a quarterly compliance certificate.
The Group's gearing at 30 June 2025 was 36.9%, materially below the default LTV maximum of 60%. On the same date the Group's Interest Cover Ratio ICR was 592.4%, materially above the default ICR minimum of 250%.
Borrowing is carefully monitored by the Group, and action will be taken to conserve cash where necessary to ensure that this risk is mitigated.
It is ensured that there is significant headroom in the LTV and interest cover covenants as part of the monitoring process.
Diversification of both the portfolio and tenants limit the risk to the Group of any one geographic or sector property event and any one tenant default.
| Probability: Low to moderate
Impact: High
Movement: No change | |
10. Inability to refinance the current loan facility The inability of the Group to obtain new borrowings - of the amount required at an aggregate finance cost and on acceptable terms - to refinance the current £41million loan facility on 20 October 2025 will have a significant impact on the ability of the Group to generate rental income and thus returns to shareholders.
† This risk rating applies at 30 June 2025 prior to the successful refinancing of the Group |
The Board appointed Panmure Liberum an independent third-party debt specialist firm, to advise and facilitate the refinancing of the Company's borrowing facility in Q4 2024. The Board has been working, in conjunction with its debt adviser, to refinance the Group's existing debt. Subsequent to the year end, the Board has secured £41 million of long term debt facilities with HSBC. Details of the new debt facilities are contained in both the Chairman's Statement and Note 20.
|
Probability: Low to moderate
Impact: High
Movement: Probability has moved downwards from Moderate to High to Low to Moderate †.
| |
CORPORATE RISKS | |||
11. Failure of service providers The Group has no employees and is reliant upon the performance of third-party service providers.
Failure by any service provider to carry out its obligations to the Group in accordance with the terms of its appointment could have a materially detrimental impact on the operation of the Group.
Should the Group pursue litigation against service providers, there is a risk that the Company may incur costs that are irrecoverable if litigation is unsuccessful.
| The Board meets regularly with, and monitors, all of its key service providers, including the Investment Adviser. The MEC reviews annually the performance of key service providers in conjunction with their service level agreements, and makes use of Key Performance Indicators where relevant.
In addition, the Audit Committee's robust and ongoing review of risk management and internal controls covers key service providers. | Probability: Low
Impact: Moderate
Movement: No change | |
12. Dependence on the Investment Adviser The future ability of the Group to successfully pursue its investment objective and investment policy may, among other things, depend on the ability of the service providers to retain its existing staff and/or to recruit individuals of similar experience and calibre, and effectively carry out its services.
The Group relies on the Investment Adviser to manage the assets and termination of the Investment Adviser agreement could severely affect the Group's ability to effectively manage its operations.
| The MEC performs a formal annual review of the Investment Adviser which covers the performance of the portfolio (both capital and income returns) and the performance of and engagement with the Martley Capital fund manager and other supporting staff.
In addition, the Board meets regularly with Martley Capital and directors engage with them not only in Board meetings but also by email, telephone and ad hoc meetings. This helps to maintain a good working relationship.
The dependence on Martley Capital is managed through segregating the roles of AIFM and Investment Adviser.
| Probability: Moderate
Impact: Moderate
Movement: No change | |
13. Ability to meet objectives The Group may not meet its investment objective to generate a secure and predictable income, that is sustainable in real terms, and at least maintain capital values in real terms, from investing predominantly in a portfolio of smaller commercial properties in the UK.
Poor relative total return performance may lead to an adverse reputational impact that affects the Group's ability to raise new capital and new funds.
An inability to maintain attractive costs of financing following the refinance of the Company's term loan which will impact the sustainability of rental returns and therefore the income available for distribution to shareholders, as set out in the Company's investment objective. | The Group has an investment policy to achieve a balanced portfolio with a diversified tenant base. This is reviewed by the Board at each scheduled Board meeting.
The Group's property portfolio has a WAULT to break of 15.6 years and a WAULT to expiry of 17.2 years. Further, over 95.8% of leases have inflation-linked upwards only rent reviews, representing a secure income stream on which to deliver attractive total returns to shareholders.
The maturity of the Canade Life loan facility and its refinancing was a standing item on the Board agenda. Risk 10 addresses this in more detail.
| Probability: Moderate
Impact: High
Movement: No change | |
TAXATION RISK | |||
14. Group REIT status The Group has UK REIT status that provides a tax-efficient corporate structure.
If the Group fails to remain a REIT for UK tax purposes, its profits and gains will be subject to UK corporation tax.
| The Company monitors REIT compliance through the Investment Adviser and Administrator on acquisitions and disposals and distribution levels; the Registrar and Broker on shareholdings; and third-party tax advisors to monitor REIT compliance requirements.
Processes are in place to ensure ongoing compliance with REIT regulations.
| Probability: Low
Impact: High
Movement: No change | |
POLITICAL/ ECONOMIC RISK | |||
15. Political and macroeconomic events. Such events present risks to the real estate and financial markets that affect the Group and the business of our tenants.
The negative economic effects from the deterioration of the global economy, higher inflation and interest rates and the ongoing long-term effects of various armed conflicts could impact the portfolio, tenants and the ability of the Group to raise capital.
|
The Group only invests in UK properties with strong alternative use values and long leases, so the portfolio is well positioned to withstand an economic downturn. Tenant default risk arising from political and macroeconomic events is managed as described above.
The Investment Adviser monitors both the macro and micro economy with special attention to those factors potentially impacting the Group, and reports to the Board on a regular basis.
| Probability: High
Impact: High
Movement: No change | |
REGULATORY RISK | |||
16. Disclosure Risk Failure to properly disclose information to investors or regulators in accordance with various disclosure rules and regulations. Examples include AIFMD investor disclosures, annual reporting requirements, marketing/promotion disclaimers, data protection regulations etc.
|
Service providers including AIFM, Investment Adviser, Company Secretary and corporate broker monitor disclosure obligations and liaise with the Board to ensure requirements are met. | Probability: Low to moderate
Impact: Moderate
Movement: No change | |
17. Regulatory Change New regulations or changes to existing regulations (particularly in relation to climate change) could result in sub-optimal performance of the Group or, in worst case, inability to continue as a viable business. |
The Board receives regular updates on relevant regulatory changes (and prospective changes) from its professional advisers.
The Investment Adviser monitors the impact of emerging legislation across all aspects of property investment and ESG has a particularly high profile at this time. The Investment Adviser uses an ESG pre-acquisition checklist to review purchases and also to ensure that the current portfolio is monitored, and that works are carried out as appropriate, with tenant's agreement, to prevent asset depreciation.
| Probability: Low
Impact: High
Movement: No change
| |
Emerging Risks
The Board takes account of and considers emerging risks as part of its risk management assessment.
Going Concern
The Group has considered its cash flows, financial position, liquidity position and borrowing facilities.
In particular, the Group's unrestricted cash balance at the year end was £3.1 million (2024: £3.3 million). The Group has no capital commitments or contingent liabilities. However, the Group has borrowings of £41 million under a loan facility repayable on 20 October 2025 (the 'Loan'). The Board has been working, in conjunction with its debt advisers, to refinance the Group's existing borrowings and subsequent to the year end the Board announced that it has secured long term debt facilities with HSBC (the 'New HSBC Bank Facilities'). The New HSBC Bank Facilities consist of both a fixed term loan of £31 million and a £10 million revolving credit facility, both on floating rates and on a fixed term of five years with an option to extend by two years if mutually acceptable. Details of the new debt facilities are contained in both the Chairman's Statement and Note 20 to these financial statements. The latter includes covenant details, all of which will be carefully monitored in accordance with the Group's risk management procedures and policies.
In respect of the Loan, the Group is permitted to utilise up to 40% of GAV measured at drawdown with a Loan to GAV of 36.9% at 30 June 2025. Therefore, the Group had headroom against its borrowing covenant. The lender's loan to value covenant of 60% is significantly higher than the Group's Loan to GAV. In addition, if agreed by the current lender, two properties not secured against the Loan and valued at £8.65 million are available as additional security for the Loan.
The Loan also has a lender's interest cover covenant of 250%. At 30 June 2025 the Group's interest cover ratio was 592.4%, giving significant headroom. A 'severe but plausible downside' scenario has been projected. While rent collections have been strong, this scenario projects rent deferrals and write-offs for tenants with difficulty paying rents from operational cash flows. In this scenario the Group still has adequate headroom against the interest cover covenant and positive cash balances. Further detail of the assumptions made in assessing the adoption of Group's going concern basis can be found in Note 2.4.
The Group benefits from a secure, diversified income stream from leases which are not overly reliant on any one tenant or sector, with the Group generating net cash flows from operating activities for the year being reported of £9.0 million. As a result, the directors believe that the Group is well placed to manage its financing and other business risks.
The going concern statement is based on the reporting requirement that the Group and the Company has adequate resources to continue in operational existence for the foreseeable future, being a period of at least 12 months from the date of these financial statements. For the reasons explained above, the Board is satisfied that the Group and the Company has adequate resources to continue in operational existence for the foreseeable future and is of the opinion that the going concern basis adopted in the preparation of the financial statements is appropriate.
Viability Statement
In accordance with provision 30 of the UK Code, the Board has assessed the prospects of the Group for at least the 12-month period from the date the financial statements are approved as required by the 'Going Concern' provisions.
The Board has considered the nature of the Group's assets and liabilities and associated cash flows and has determined that three years, from the balance sheet date up to 30 June 2028, is an appropriate and realistic timescale over which the performance of the Group can be forecast with a degree of accuracy. Even though the Group's contractual income extends beyond three years, the Board considers this period (the 'Period') to be appropriate, given:
· | A major proportion of the leases contain an annual, three- or five-year rent review pattern and therefore three years allow for the forecasts to include the reversion arising from most rent reviews; |
· | It is the period over which the Group's medium-term business plan and cash flows are based; and |
· | It is often factors beyond the Board's control, such as market uncertainty and unknown tenant issues, that reduce the reliability of forecasting over a longer period. |
In performing its viability review, the Board considers the Group's cash flows (noting that the Group's property portfolio had a WAULT to break of 15.6 years and a WAULT to expiry of 17.2 years at 30 June 2025, representing a secure income stream for the Period), future dividends and dividend cover, REIT compliance and relevant key financial ratios over the Period. The Board carried out a thorough review of the Group's business model, including future performance, liquidity and banking covenant tests for the Period and with various debt finance cost scenarios based on refinancing the £41 million debt (see below) in full at its maturity. The Board has assessed the extent of any operational disruption; potential curtailment of rental receipts; potential liquidity and working capital shortfalls; and diminished demand for the Group's assets going forward, in adopting a going concern preparation basis and in assessing the Group's longer-term viability.
These assessments are subject to sensitivity analysis, which involves flexing a number of key assumptions and judgements included in the financial projections:
· Tenant default;
· Dividend payments;
· Financing and refinancing; and
· Property portfolio valuation movements.
The Group's debt:
The Group has borrowings of £41 million under a loan facility repayable on 20 October 2025 (the 'Loan'). Subsequent to the year end the Board announced that it has secured long-term debt facilities with HSBC. The New HSBC Bank Facilities consist of both a fixed term loan of £31 million and a £10 million revolving credit facility, both on floating rates and on a fixed term of five years with an option to extend by two years if mutually acceptable. Details of the New HSBC Bank Facilities are contained in both the Chairman's Statement and Note 20 to these financial statements. Specifically with respect to viability and the Group's debt:
· the Loan covenants - at 30 June 2025, the asset valuations and rental income of the properties secured to Canada Life would need to fall by 16.9% and 40.8%, respectively, before breaching the Loan to Value and Income Cover Cash Trap covenants; and
· the cash flow modelling has taken account of the New HSBC Bank Facilities and its covenants, and future interest rate predictions (assuming interest rate hedging is not put in place). The Group is in compliance with the New HSBC Bank Facilities covenants throughout the cash flow period to 30 June 2028.
Based on the prudent assumptions within the Group's forecasts including the rent deferrals, tenant default, void rates, property valuation movements and the successful refinancing of the debt, the Board has a reasonable expectation that for the Period:
· all current and future loan covenants will be complied with throughout the Period;
· REIT tests will similarly be complied with; and
· the Group and the Company will be able to continue in operation and meet its liabilities as they fall due over the Period.
Board Approval of the Strategic Report
The Strategic Report has been approved and signed on behalf of the Board by:
Simon Bennett
Chairman
3 October 2025
Statement of Directors' Responsibilities
in respect of the Annual Report and the Financial Statements
The directors are responsible for preparing the Annual Report and the Group and parent Company Financial Statements in accordance with applicable law and regulations.
Company law requires the directors to prepare Group and parent Company financial statements for each financial year. Under that law they are required to prepare the Group financial statements in accordance with international accounting standards in conformity with the requirements of the Companies Act 2006 and in accordance with the UK adopted international accounting standards. The directors have elected to prepare the parent Company financial statements in accordance with UK accounting standards, including FRS 101 Reduced Disclosure Framework and applicable law.
Under company law the directors must not approve the financial statements unless they are satisfied that they give a true and fair view of the state of affairs of the Group and parent Company and of their profit or loss for that period. In preparing each of the Group and parent Company financial statements, the directors are required to:
· | select suitable accounting policies and then apply them consistently; |
· | make judgements and estimates that are reasonable, relevant, reliable and prudent; |
· | for the Group financial statements, state whether they have been prepared in accordance with Companies Act 2006 and in accordance with UK adopted international accounting standards; |
· | for the parent Company financial statements, state whether applicable UK accounting standards have been followed, subject to any material departures disclosed and explained in the parent Company financial statements; |
· | assess the Group and parent Company's ability to continue as a going concern, disclosing, as applicable, matters related to going concern; and |
· | use the going concern basis of accounting unless they either intend to liquidate the Group or the parent Company, or to cease operations, or have no realistic alternative but to do so. |
The directors are responsible for keeping adequate accounting records that are sufficient to show and explain the Group's and the parent Company's transactions and disclose with reasonable accuracy at any time the financial position of the Group and the parent Company and enable them to ensure that its financial statements comply with the Companies Act 2006. They are responsible for such internal control as they determine is necessary to enable the preparation of financial statements that are free from material misstatement, whether due to fraud or error, and have general responsibility for taking such steps as are reasonably open to them to safeguard the assets of the Group and the parent Company and to prevent and detect fraud and other irregularities.
Under applicable law and regulations, the directors are also responsible for preparing a Strategic Report, Directors' Report, Directors' Remuneration Report and Corporate Governance Statement that complies with that law and those regulations.
The directors are responsible for the maintenance and integrity of the corporate and financial information included on the Company's website. Legislation in the UK governing the preparation and dissemination of financial statements may differ from legislation in other jurisdictions.
We confirm that to the best of our knowledge:
· | the Consolidated Financial Statements, prepared in accordance with the applicable set of accounting standards, give a true and fair view of the assets, liabilities, financial position and profit or loss of the Company and the undertakings included in the consolidation taken as a whole; |
· | the Strategic Report and Directors' Report include a fair review of the development and performance of the business and the position of the issuer and the undertakings included in the consolidation taken as a whole, together with a description of the principal risks and uncertainties that they face; and |
· | that the Annual Report and the Consolidated Financial Statements, taken as a whole, are fair, balanced and understandable and provide the information necessary for shareholders to assess the Group's position and performance, business model and strategy. |
On behalf of the Board
Simon Bennett
Chairman
3 October 2025
Consolidated Statement of Comprehensive Income | |||||||
For the year ended 30 June 2025 |
|
|
| ||||
|
|
| |||||
|
|
| |||||
2025 |
| 2024 | |||||
Notes | £'000 | £'000 | |||||
Income | |||||||
Rental and other income | 3 | 8,570 | 7,900 | ||||
Property operating expense | 4 | (781) | (680) | ||||
Net rental and other income | 7,789 |
| 7,220 | ||||
Other operating expenses | 4 | (1,066) | (1,066) | ||||
Operating profit before fair value changes and gain on disposal | 6,723 |
| 6,154 | ||||
Change in fair value of investment properties | 10 | 1,970 | (2,983) | ||||
Gain on disposal of investment property | 10 | - | 598 | ||||
Operating profit | 8,693 | 3,769 | |||||
Finance expenses | 6 | (1,435) | (1,412) | ||||
Profit before tax | 7,258 | 2,357 | |||||
Taxation | 7 | - | - | ||||
Profit and total comprehensive income attributable to shareholders | 7,258 |
| 2,357 | ||||
|
|
|
| ||||
Earnings per share (basic and diluted) | 8 | 9.02p |
| 2.93p | |||
EPRA EPS (basic and diluted) | 8 | 6.57p |
| 5.89p | |||
Adjusted EPS (basic and diluted) | 8 | 6.72p |
| 5.99p | |||
All items in the above statement are derived from continuing and total operations. No operations were acquired or disposed of during the year.
| |||||||
The accompanying Notes 1 to 20 form part of these consolidated financial statements. | |||||||
Consolidated Statement of Financial Position | |||||||
At 30 June 2025 | |||||||
2025 |
| 2024 | |||||
| Notes |
| £'000 |
| £'000 | ||
Non-current Assets |
| ||||||
Investment properties | 10 | 103,777 | 99,083 | ||||
Current Assets |
| ||||||
Trade and other receivables | 11 | 4,236 | 6,464 | ||||
Cash and cash equivalents | 3,148 | 3,292 | |||||
Total current assets | 7,384 | 9,756 | |||||
Total Assets |
| 111,161 |
| 108,839 | |||
| |||||||
Current Liabilities |
| ||||||
Trade and other payables |
| 12 | (2,878) | (2,890) | |||
Interest bearing loans and borrowings |
| 13 | (40,956) | - | |||
Total current liabilities |
|
|
|
| (43,834) |
| (2,890) |
| |||||||
Non-current Liabilities |
| ||||||
Interest bearing loans and borrowings | 13 | - | (40,828) | ||||
Total non-current liabilities |
|
|
|
| - |
| (40,828) |
Total Liabilities |
| (43,834) |
| (43,718) | |||
| |||||||
Net Assets |
| 67,327 |
| 65,121 | |||
| |||||||
Equity |
| ||||||
Share capital | 16 | 805 | 805 | ||||
Capital reserve | 2 | 65,379 | 70,431 | ||||
Retained earnings | 1,143 | (6,115) | |||||
Total capital and reserves attributable to equity holders of the Company | 67,327 |
| 65,121 | ||||
| |||||||
Net Asset Value per share (basic and diluted) | 8 | 83.64p |
| 80.90p | |||
EPRA Net Tangible Asset per share (basic and diluted) | 8 | 83.64p |
| 80.90p | |||
The accompanying Notes 1 to 20 form part of these Consolidated Financial Statements.
The Consolidated Financial Statements were approved by the Board of Directors on 3 October 2025 and were signed on its behalf by:
Simon Bennett
Chairman
Company number: 10727886
Consolidated Statement of Changes in Equity | ||||||||
For the year ended 30 June 2025
|
|
|
| |||||
|
| |||||||
|
|
|
| |||||
|
| Share capital | Capital reserve | Retained earnings | Total equity | |||
| Notes | £'000 | £'000 | £'000 | £'000 | |||
For the year ended 30 June 2025 |
| |||||||
Balance at 30 June 2024 |
| 805 | 70,431 | (6,115) | 65,121 | |||
|
|
| ||||||
Total comprehensive income attributable to shareholders | - | - | 7,258 | 7,258 | ||||
Dividends paid | 9 | - | (5,052) | - | (5,052) | |||
Balance at 30 June 2025 |
| 805 | 65,379 | 1,143 | 67,327 | |||
|
| |||||||
For the year ended 30 June 2024 |
| |||||||
Balance at 30 June 2023 |
| 805 | 75,417 | (8,472) | 67,750 | |||
|
|
| ||||||
Total comprehensive income attributable to shareholders | - | - | 2,357 | 2,357 | ||||
Dividends paid | 9 | - | (4,986) | - | (4,986) | |||
Balance at 30 June 2024 |
| 805 | 70,431 | (6,115) | 65,121 | |||
Consolidated Statement of Cash Flows | ||||||
For the year ended 30 June 2025 | ||||||
Notes | 2025 | 2024 | ||||
| £'000 | £'000 | ||||
Cash flows from operating activities |
| |||||
Profit before tax | 7,258 | 2,357 | ||||
Adjustment for: | ||||||
Finance expenses | 6 | 1,435 | 1,412 | |||
Gain on disposal of investment property | 10 | - | (598) | |||
Change in fair value of investment properties | 10 | (1,970) | 2,983 | |||
Operating results before working capital changes |
| 6,723 | 6,154 | |||
| ||||||
Change in working capital |
| |||||
Decrease/(increase) in receivables and prepayments | 2,228 | (2,271) | ||||
(Decrease)/Increase in other payables and accrued expenses | (12) | 139 | ||||
Net cash flow generated from operating activities |
| 8,939 | 4,022 | |||
| ||||||
Cash flows from investing activities |
| |||||
Purchase of investment property | 10 | (2,724) | (5,304) | |||
Net proceeds from disposal of investment property | 10 | - | 7,382 | |||
Net cash (used in)/generated from investing activities |
| (2,724) | 2,078 | |||
| ||||||
Cash flows from financing activities |
| |||||
Finance costs paid | (1,307) | (1,306) | ||||
Dividends paid | 9 | (5,052) | (4,986) | |||
Net cash used in financing activities |
| (6,359) | (6,292) | |||
| ||||||
Net decrease in cash and cash equivalents | (144) | (192) | ||||
Cash and cash equivalents at beginning of year |
| 3,292 | 3,484 | |||
Cash and cash equivalents at end of year |
| 3,148 | 3,292 | |||
The accompanying Notes 1 to 20 form part of these consolidated financial statements. |
Notes to the Consolidated Financial Statements
for the year ended 30 June 2025
1. Corporate Information Alternative Income REIT PLC (the 'Company') is a public limited company and a closed ended Real Estate Investment Trust ('REIT') incorporated on 18 April 2017 and domiciled in the UK and registered in England and Wales. The registered office of the Company is The Scalpel, 18th Floor, 52 Lime Street, London, United Kingdom, EC3M 7AF.
| ||
The Company's Ordinary Shares are listed on the closed-ended investment funds category of the Official List of the Financial Conduct Authority ('FCA') and have been traded on the Main Market of the London Stock Exchange since the Company's IPO on 6 June 2017. | ||
The nature of the Group's operations and its principal activities are set out in the Strategic Report. | ||
2. Accounting policies | ||
2.1 | Basis of preparation | |
These consolidated financial statements (the 'financial statements') are prepared and approved by the directors in accordance with UK adopted International Accounting Standards ('IFRS') and in accordance with the Companies Act 2006 as applicable to companies reporting under those standards and Article 4 of the UK adopted International Accounting Standards ('IAS') Regulations. | ||
These financial statements have been prepared under the historical cost convention, except for investment properties that have been measured at fair value. | ||
The financial statements are presented in Sterling and all values are rounded to the nearest thousand pounds (£'000), except where otherwise indicated. | ||
Basis of consolidation | ||
The financial statements incorporate the financial statements of the Company and its subsidiaries (the 'Group').
Subsidiaries are the entities controlled by the Company, being Alternative Income Limited and Alternative Income REIT Holdco Limited. | ||
|
| |
New standards, amendments and interpretations, and forthcoming requirements | ||
The Group has applied the following new standards and amendments in this set of condensed consolidated financial statements: · Lack of Exchangeability - Amendments to IAS 21 The Effects of Changes in Foreign Exchange Rates (Effective 1 January 2025)
The new standards and amendments listed above did not have any impact on the amounts recognised in prior periods and are not expected to significantly affect the current or future periods.
| ||
Certain new accounting standards and interpretations have been published that are not mandatory for annual periods beginning after 1 July 2025 and early application is permitted; however the Group has not early adopted the new or amended standards in preparing these consolidated financial statements:
· Sale or Contribution of Assets between an Investor and its Associate or Joint Venture (Amendments to IFRS 10 and IAS 28) (effective date deferred indefinitely) · Presentation and Disclosure in Financial Statements - IFRS 18 (effective 1 January 2027) · Subsidiaries without Public Accountability: Disclosures - IFRS 19 (effective 1 January 2027)
| ||
The new standards and amendments listed above are not expected to significantly affect the current or future periods.
| ||
2.2 | Significant accounting judgements and estimates | |
In the application of the Group's accounting policies the directors are required to make judgements, estimates and assumptions that affect the reported amounts recognised in the financial statements. However, uncertainty about these assumptions and estimates could result in outcomes that require a material adjustment to the carrying amount of the asset or liability in the future. The estimates and associated assumptions that have a significant risk of causing a material adjustment to the carrying amounts of assets and liabilities within the next financial year are outlined below: | ||
| ||
Valuation of investment properties | ||
The fair value of investment properties is determined by external property valuation experts to be the estimated amount for which a property should exchange on the date of the valuation in an arm's length transaction. The Group's properties have been valued on an individual basis. The valuation experts use recognised valuation techniques, applying the principles of both IAS 40 and IFRS 13. | ||
The valuations have been prepared in accordance with the Royal Institution of Chartered Surveyors ('RICS') Valuation. Factors include current market conditions, annual rentals, the contractual terms of the leases and their lengths and location. The significant methods and assumptions used by valuers in estimating the fair value of investment properties are set out in Note 10. | ||
Provision for expected credit losses ('ECL') of trade receivables | ||
Rent collection rates since the start of the Group are in the region of 100%. As a result, the Group does not have the data to establish historical loss rates for the expected credit loss analysis.
In determining the provision on a tenant by tenant basis, the Group considers both recent payment history and future expectations of the tenant's ability to pay or possible default, in order to recognise an expected credit loss allowance. The Group also considers the risk factors associated by sector in which the tenant operates and the nature of the debt. Based on sector and rent receivable type a provision is provided in addition to full provision for maximum risk tenants or known issues. | ||
| ||
Principal versus agent considerations - services to tenants | ||
The Group arranges for certain services to be provided to tenants. These arrangements are included in the contract the Group enters into as a lessor. The Group has determined that it controls the services before they are transferred to tenants, because it has the ability to direct the use of these services and obtain the benefits from them. The Group has determined that it is primarily responsible for fulfilling these services as it directly deals with tenants' complaints and is primarily responsible for the quality or sustainability of the services. In addition, the Group has discretion in establishing the price that it charges to the tenants for the specified services.
Therefore, the Group has concluded that it is the principal in these contracts. In addition, the Group has concluded that it transfers control of these services over time, as services are rendered by the third-party service providers, because this is when tenants receive and, at the same time, consume the benefits from these services. | ||
REIT status | |||
The Group is a REIT and does not pay tax on its property income or gains on property sales, provided that at least 90% of the Group's property income is distributed as a dividend to shareholders, which becomes taxable in their hands. In addition, the Group has to meet certain conditions such as ensuring the property rental business represents more than 75% of total profits and assets. Any potential or proposed changes to the REIT legislation are monitored and discussed with HMRC. It is the Board's intention that the Group will continue as a REIT for the foreseeable future. | |||
2.3 | Segmental information | ||
Each property held by the Group is reported to the chief operating decision maker. In the case of the Group, the chief operating decision maker is considered to be the Board of Directors. The review process for segmental information includes the monitoring of key performance indicators applicable across all properties. These key performance indicators include Net Asset Value, Earnings per Share and valuation of properties. All asset cost and rental allocations are also reported by property. The internal financial reports received by the directors cover the Group and all its properties and do not differ from amounts reported in the financial statements. The directors have considered that each property has similar economic characteristics and have therefore aggregated the portfolio into one reportable segment under the provisions of IFRS 8. | |||
2.4 | Going concern | ||
The financial statements have been prepared on a going concern basis. | |||
The Group's business activities, together with the factors likely to affect its future development, performance and position are set out in the Strategic Report. The robust financial position of the Group, its net asset and current asset positions, its cash flows, liquidity position and borrowing facilities are described in the financial statements and the accompanying notes. The financial statements also include the Group's objectives, policies and processes for managing its capital, its financial risk management objective and its exposures to market price risk, real estate risk, credit risk and liquidity risk. | |||
The Investment Adviser on behalf of the Board has projected the Group's cash flows for the period up to 30 September 2026, challenging and sensitising inputs and assumptions to ensure that the cash forecast reflects a realistic outcome given the uncertainties associated with the current economic environment. A longer-term projection had also been carried out up to 30 June 2029. The scenarios applied were designed to be severe but plausible, and to take account of the availability of mitigating actions that could be taken to avoid or reduce the impact or probability of the underlying risks. | |||
The Group's debt of £41 million matures on 20 October 2025 and the Group has reported full compliance with its loan covenants to date. Based on cash flow projections, the directors expect the Group to continue to remain compliant. The headroom of the loan to value covenant is significant and any reduction in property values that would cause a breach would be significantly more than any reduction currently envisaged.
The Board has been working, in conjunction with its debt advisers, to refinance the Group's existing borrowings and subsequent to the year end the Board announced that it has secured long-term debt facilities with HSBC UK Bank plc. The New HSBC Bank Facilities consist of both a fixed term loan of £31 million and a £10 million revolving credit facility, both on floating rates and on a fixed term of five years with an option to extend by two years if mutually acceptable. Details of the new debt facilities are contained in both the Chairman's Statement and Note 20 - Events after the reporting date. The latter includes covenant details, all of which will be carefully monitored in accordance with the Group's risk management procedures and policies. | |||
Based on the above, the Board believes that the Group has the ability and resources to continue in operational existence for the foreseeable future, being at least 12 months from the date of approval of the financial statements. | |||
2.5 |
Summary of significant accounting policies |
| |
The principal accounting policies applied in the preparation of these financial statements are set out below. | |||
a) Functional and presentational currency | ||
These financial statements are presented in Pound Sterling, which is the functional and presentational currency of the Group and its subsidiary undertakings. The functional currency of the Group and its subsidiaries is principally determined by the primary economic environment in which it operates. The Group did not enter into any transactions in foreign currencies during the period. | ||
b) Revenue recognition | ||
i) Rental income | ||
Rental income under operating leases is recognised on a straight-line basis over the term of the lease, except for contingent rental income, which is recognised when it arises. For leases, which contain fixed or minimum uplifts, the rental income arising from such uplifts is recognised on a straight-line basis over the lease term. | ||
Incentives for lessees to enter into lease agreements are spread evenly over the lease term, even if the payments are not made on such a basis. The lease term is the non-cancellable period of the lease together with any further term for which the tenant has the option to continue the lease, where, at the inception of the lease, the directors are reasonably certain that the tenant will exercise that option.
| ||
Lease modifications, such as lease extensions and rent reductions, are accounted for either as a separate lease or not as a separate lease.
A modification will only be treated as a separate lease if it involves the addition of one or more underlying assets at a price that is commensurate with the standalone price of the increase in scope. All other modifications are not treated as a separate lease.
If a modification is a separate lease, a lessee applies the requirements of IFRS 16 to the newly added asset, due as a result of the modification, independently of the original lease. The accounting for the original lease continues unchanged.
If a modification is not a separate lease, the accounting reflects that there is a linkage between the original lease and the modified lease. The existing lease liability is remeasured with a corresponding adjustment to the right-of-use asset on the effective date of the modification. | ||
ii) Service charges and direct recharges | ||
Revenue from service charges is recognised in the accounting period in which the service is rendered. For certain service contracts, revenue is recognised based on the actual service provided to the end of the reporting period as a proportion of the total services to be provided because the customer receives and uses the benefits simultaneously. | ||
iii) Deferred income | ||
Deferred income is rental income received in respect of future accounting periods. | ||
(iv) Dilapidation and lease surrender premium | ||
Amounts received from tenants to terminate leases or to compensate for dilapidations are recognised in the Consolidated Statement of Comprehensive Income when the right to receive them arises. | ||
c) Financing income and expenses | ||
Financing income comprises interest receivable on funds invested. Financing expenses comprise interest and other costs incurred in connection with the borrowing of funds. Interest income and interest payable are recognised in profit or loss as they accrue, using the effective interest method which is significantly the same as the contracted interest. | ||
| ||
d) Investment property | ||
Property is classified as investment property when it is held to earn rentals or for capital appreciation or both. Investment property is measured initially at cost including transaction costs. Transaction costs include transfer taxes and professional fees to bring the property to the condition necessary for it to be capable of operating. The carrying amount also includes the cost of replacing part of an existing investment property at the time that cost is incurred if the replacement of that part will prolong or improve the life of the asset. | ||
Subsequent to initial recognition, investment property is stated at fair value. Gains or losses arising from changes in the fair values are included in profit or loss, included as part of operating profit under change in fair value of investment properties. | ||
Additions to properties include costs of a capital nature only. Expenditure is classified as capital when it results in identifiable future economic benefits, which are expected to accrue to the Group. All other property expenditure is expensed in the Group profit or loss as incurred.
| ||
Investment properties are valued by the external valuer. Any valuation of investment properties by the external valuer must be undertaken in accordance with the current issue of RICS Valuation - Professional Standards (the 'Red Book'). | ||
The determination of the fair value of investment property requires the use of estimates such as future cash flows from assets (such as lettings, tenants' profiles, future revenue streams, capital values of fixtures and fittings, plant and machinery, any environmental matters and the overall repair and condition of the property) and yield applicable to those cash flows. | ||
For the purposes of the financial statements, the assessed fair value is: - reduced by the carrying amount of any accrued income resulting from the spreading of lease incentives; and - increased by the carrying amount of leasehold obligations. | ||
Investment property is derecognised when it has been disposed of or permanently withdrawn from use and no future economic benefit is expected after its disposal or withdrawal. | ||
The profit on disposal is determined as the difference between the net sales proceeds and the carrying amount of the asset at the commencement of the accounting period plus capital expenditure in the period. Any gains or losses on the retirement or disposal of investment property are recognised in profit or loss in the year of retirement or disposal. | ||
e) Cash and cash equivalents | ||
Cash and short-term deposits in the Consolidated Statement of Financial Position comprise cash at bank and short-term deposits with an original maturity of three months or less. | ||
f) Receivables and prepayments | ||
|
| Rent and other receivables are initially recognised at fair value and subsequently at amortised cost. Impairment provisions are recognised based on the process as described in Note 2.2. Any adjustment is recognised in profit or loss as an impairment gain or loss. |
g) Other payables and accrued expenses | ||
Other payables and accrued expenses are initially recognised at fair value and subsequently held at amortised cost. | ||
h) Interest bearing loans and borrowings | ||
All loans and borrowings are initially recognised at fair value less directly attributable transaction costs. After initial recognition, interest bearing loans and borrowings are subsequently measured at amortised cost using the effective interest method. Borrowing costs are amortised over the lifetime of the facilities through profit or loss. | ||
i) Provisions | ||
A provision is recognised in the Consolidated Statement of Financial Position when the Group has a present legal or constructive obligation as a result of a past event that can be reliably measured and is probable that an outflow of economic benefits will be required to settle the obligation. Provisions are determined by discounting the expected future cash flows at a pre-tax rate that reflects risks specific to the liability.
| ||
j) Dividend payable to shareholders | ||
Dividends due to the Company's Shareholders are recognised when they become legally payable, as a reduction in the Consolidated Statement of Changes in Equity. Interim equity dividends are recognised when paid. Final equity dividends will be recognised when approved by Shareholders at an AGM. The Directors consider the aggregate of distributable reserves in considering the recommendation and payment of a dividend.
| ||
k) Share issue costs | ||
The costs of issuing or reacquiring equity instruments (other than in a business combination) are accounted for as a deduction from equity. |
l) Lease obligations | ||
Lease obligations relate to the head rent of investment property and are capitalised at the lease commencement, at the lower of fair value of the property and present value of the minimum lease payments and held as a liability within the Consolidated Statement of Financial Position. The lease payments are discounted using the interest rate implicit in the lease. Where the Group is exposed to potential future increases in variable lease payments based on an index or rate, these are not included in the lease liability until they take effect. Lease payments are allocated between principal and finance cost. The finance cost is charged to profit or loss over the lease period so as to produce a constant periodic rate of interest on the remaining balance of the liability for each period. | ||
m) Taxes | ||
Corporation tax is recognised in profit or loss except to the extent that it relates to items recognised directly in equity, in which case it is recognised in equity. | ||
As a REIT, the Group is exempt from corporation tax on the profits and gains from its investments, provided it continues to meet certain conditions as per REIT regulations. | ||
Taxation on the profit or loss for the period which is not exempted under UK REIT regulations comprises current and deferred tax. Current tax is expected tax payable on any non-REIT taxable income for the year, using tax rates applicable in the year. | ||
Deferred tax is provided on temporary differences between the carrying amounts of assets and liabilities for financial reporting purposes and the amounts used for taxation purposes. The amount of deferred tax that is provided is based on the expected manner of realisation or settlement of the carrying amount of assets and liabilities, using tax rates enacted or substantially enacted at the period end date. | ||
n) Non-current assets held for sale | ||
Non-current assets are classified as assets held for sale when their carrying amount is to be recovered principally through a sale transaction and a sale is considered highly probable. Investment properties classified as such are measured at fair value. | ||
| ||
o) European Public Real Estate Association ('EPRA') | ||
The Group has adopted the EPRA best practice recommendations, which it expects to broaden the range of potential institutional investors able to invest in the Company's Ordinary Shares. For the year ended 30 June 2025, audited EPS and NAV calculations under EPRA's methodology are included in Note 8 and further unaudited measures are included following the financial statements. | ||
|
|
|
p) Capital and reserves | ||
Share capital | ||
Share capital is the nominal amount of the Company's ordinary shares in issue and is non-distributable. | ||
Capital reserve | ||
The capital reserve represents the cancelled share premium less dividends paid from this reserve. It is a distributable reserve. The share premium account was cancelled in 2017 by Court Order and distributions can be made from this reserve in accordance with the Companies Act 2006, including by way of dividends or share buy backs. | ||
Retained earnings | ||
Retained earnings represent the cumulative net gains and losses recognised in the Consolidated Statement of Comprehensive Income less dividends paid from this reserve. This reserve is distributable, except for any unrealised gains on investment properties. |
2.6 | Fair value measurement | |
The Group measures financial and non-financial assets such as investment properties at fair value at each reporting date. | ||
A number of the Group's accounting policies and disclosures require the determination of fair value, for both financial and non-financial assets and liabilities. Fair value is defined in IFRS 13 Fair Value Measurement as the price that would be received to sell an asset or paid to transfer a liability in an orderly transaction between market participants at the measurement date. Fair values have been determined for measurement and/or disclosure purposes based on methods described below. Where applicable, further information about the assumptions made in determining fair values is disclosed in the notes specific to that asset or liability. | ||
The Group uses valuation techniques that are appropriate in the circumstances and for which sufficient data are available to measure fair value, maximising the use of relevant observable inputs and minimising the use of unobservable inputs significant to fair value measurement as a whole: | ||
Fair value hierarchy: | ||
Level 1: Quoted prices (unadjusted) in active markets for identical assets or liabilities. | ||
Level 2: Inputs other than quoted prices included within Level 1 that are observable for the asset or liability, either directly (i.e. as prices) or indirectly (i.e. derived from prices). | ||
Level 3: Inputs for the asset or liability that are not based on observable market data (unobservable inputs). | ||
For assets and liabilities that are recognised in the financial statements at fair value on a recurring basis, the Group determines whether transfers have occurred between levels in the hierarchy by re-assessing categorisation (based on the lowest level input that is significant to the fair value measurement as a whole) at the end of each reporting period. | ||
There were no transfers between any of the levels during the year. | ||
Investment property | ||
The valuation of investment property by valuers engaged by the Group who are independently appointed and have the relevant professional qualifications and with recent experience in the location and category of the investment property being valued. Further information in relation to the valuers is provided in Note 10. | ||
Property valuations are inherently subjective as they are made on the basis of assumptions made by the valuer which may not prove to be accurate. For these reasons, and consistent with EPRA's guidance, the valuations of the property portfolio have been classified as Level 3 as defined by IFRS 13. The inputs to the valuations are defined as 'unobservable' by IFRS 13 and these are analysed in Note 10. |
3. Rental and other income | |||
| 2025 |
| 2024 |
£'000 | £'000 | ||
Gross rental income | 7,916 | 7,331 | |
Spreading of minimum contracted future rent - indexation | 220 | 74 | |
Spreading of tenant incentives - rent free periods | (214) | (49) | |
Other property income | - | 2 | |
Gross rental income (adjusted) | 7,922 | 7,358 | |
Service charges and direct recharges (see Note 4) | 648 | 542 | |
Total rental and other income | 8,570 | 7,900 |
All rental, service charges, direct recharges and other income are derived from the United Kingdom.
4. Expenses |
|
|
|
2025 |
| 2024 | |
£'000 | £'000 | ||
|
| ||
Property operating expenses | 133 | 138 | |
Service charges and direct recharges (see Note 3) | 648 | 542 | |
Property operating expenses | 781 |
| 680 |
| |||
Investment Adviser fee | 360 | 360 | |
Auditor's remuneration | 104 | 85 | |
Operating costs* | 484 | 508 | |
Directors' remuneration (Note 5) | 118 | 113 | |
Other operating expenses | 1,066 |
| 1,066 |
Total operating expenses | 1,847 |
| 1,746 |
Total operating expenses (excluding service charges and direct recharges) | 1,199 |
| 1,204 |
* Included in the Operating Costs were abortive costs of £2,000 (2024: £61,500).
| 2025 |
| 2024 |
| £'000 | £'000 | |
Audit | |||
Statutory audit of Annual Report and Accounts | 84 | 73 | |
Statutory audit of Subsidiary Accounts | 13 | 12 | |
Statutory audit of Annual Report and Accounts ( additional fee on data migration) | 7 | - | |
Total fees due to auditor | 104 | 85 |
5. Directors' remuneration |
|
| |
| 2025 |
| 2024 |
| £'000 | £'000 | |
| |||
Directors' fees | 105 | 102 | |
Tax and social security | 13 | 11 | |
Total fees | 118 |
| 113 |
A summary of the director's remuneration is set out in the Directors' Remuneration Report in the Annual Report.
The Group had no employees during the year.
6. Finance expenses |
|
| |
2025 |
| 2024 | |
£'000 | £'000 | ||
| |||
Interest payable on loan (Note 13) | 1,307 | 1,304 | |
Amortisation of finance costs (Note 13) | 128 | 104 | |
Other finance costs | - | 4 | |
Total | 1,435 |
| 1,412 |
7. Taxation |
|
| |
| 2025 |
| 2024 |
£'000 | £'000 | ||
Tax charge comprises: |
|
| |
Analysis of tax charge in the year | |||
Profit before tax | 7,258 |
| 2,357 |
Theoretical tax charge at UK corporation tax standard rate of 25.00% (2024: 25.00%) | 1,815 | 589 | |
Effects of tax-exempt items under the REIT regime | (1,815) | (589) | |
Total | - |
| - |
The Group maintained its REIT status and as such, no deferred tax asset or liability has been recognised in the current year.
Factors that may affect future tax charges
Due to the Group's status as a REIT and the intention to continue meeting the conditions required to retain approval as a REIT in the foreseeable future, the Group has not provided deferred tax on any capital gains or losses arising on the revaluation or disposal of investments.
8. Earnings per share ('EPS') and Net Asset Value ('NAV') per share
| 2025 |
| 2024 |
EPS: |
|
| |
Total comprehensive income (£'000) | 7,258 | 2,357 | |
Weighted average number of shares (number) | 80,500,000 | 80,500,000 | |
EPS (basic and diluted) | 9.02p | 2.93p | |
|
| ||
EPRA EPS: |
|
| |
Total comprehensive income (£'000) | 7,258 | 2,357 | |
Adjustment to total comprehensive income (£'000): |
|
| |
Change in fair value of investment properties | (1,970) | 2,983 | |
Gain on disposal of investment property | - | (598) | |
EPRA earnings (basic and diluted) (£'000) | 5,288 | 4,742 | |
EPRA EPS (basic and diluted) | 6.57p |
| 5.89p |
Adjusted EPS: | |||
EPRA earnings (basic and diluted) (£'000) - as above | 5,288 | 4,742 | |
Adjustments (£'000): | |||
Rental income recognised in respect of guaranteed fixed rental uplifts (Note 3) | (220) | (74) | |
Rental income recognised in respect of rent free periods (Note 3) | 214 | 49 | |
Amortisation of loan finance costs (Note 6) | 128 | 104 | |
Adjusted earnings (basic and diluted) (£'000) | 5,410 |
| 4,821 |
Adjusted EPS (basic and diluted)* | 6.72p |
| 5.99p |
* Adjusted EPS is a measure used by the Board to assess the level of the Group's dividend payments. This metric adjusts EPRA earnings for non-cash items in arriving at an adjusted EPS as supported by cash flows.
Earnings per share are calculated by dividing profit/(loss) for the year attributable to ordinary equity holders of the Company by the weighted average number of Ordinary Shares in issue during the year. As at 30 June 2025 and 2024, there are no dilutive or potentially dilutive equity arrangements in existence.
| 2025 |
| 2024 |
NAV per share: | |||
Net assets (£'000) | 67,327 | 65,121 | |
Ordinary Shares (Number) | 80,500,000 | 80,500,000 | |
NAV per share | 83.64p |
| 80.90p |
EPRA Net Reinvestment Value ('NRV'), EPRA Net Tangible Assets ('NTA') and EPRA Net Disposal Value ('NDV')
EPRA NRV | EPRA NTA and EPRA NDV | ||
At 30 June 2025 |
|
| |
Net assets value (£'000) | 67,327 | 67,327 | |
Estimated purchasers' cost (£'000) | 6,978 | - | |
74,305 |
| 67,327 | |
Ordinary Shares (Number) | 80,500,000 | 80,500,000 | |
Per share measure | 92.30p |
| 83.64p |
| |||
At 30 June 2024 |
|
| |
Net assets value (£'000) | 65,121 | 65,121 | |
Estimated purchasers' cost (£'000) | 6,672 | - | |
71,793 |
| 65,121 | |
Ordinary Shares (Number) | 80,500,000 | 80,500,000 | |
Per share measure | 89.18p |
| 80.90p |
9. Dividends |
|
| |||||
All dividends were paid as PIDs | Quarter |
|
| 2025 |
| 2024 | |
Ended | Rate | £'000 | £'000 | ||||
Dividends in respect of year ended 30 June 2023 | |||||||
4th dividend | 30-Jun-23 | 1.920p | - | 1,545 | |||
Dividends in respect of year ended 30 June 2024 | |||||||
1st dividend | 30-Sep-23 | 1.425p | - | 1,147 | |||
2nd dividend | 31-Dec-23 | 1.425p | - | 1,147 | |||
3rd dividend | 31-Mar-24 | 1.425p | - | 1,147 | |||
4th dividend | 30-Jun-24 | 1.625p | 1,308 | - | |||
Dividends in respect of year ended 30 June 2025 | |||||||
1st dividend | 30-Sep-24 | 1.550p | 1,248 | - | |||
2nd dividend | 31-Dec-24 | 1.550p | 1,248 | - | |||
3rd dividend | 31-Mar-25 | 1.550p | 1,248 | - | |||
Total dividends paid | 5,052 | 4,986 | |||||
4th dividend* | 30-Jun-23 | 1.920p | - | (1,545) | |||
4th dividend* | 30-Jun-24 | 1.625p | (1,308) | 1,308 | |||
4th dividend* | 30-Jun-25 | 1.550p | 1,248 | - | |||
Total dividends payable in respect of the year | 4,992 | 4,749 | |||||
Total dividends payable per share in respect of the year | 6.20p | 5.90p | |||||
* Dividends declared after the year end are not included in the financial statements as a liability.
10. Investment properties | |||||||
|
|
| |||||
| FreeholdInvestmentproperties | LeaseholdInvestmentproperties | 2025Total | 2024Total | |||
£'000 | £'000 | £'000 | £'000 | ||||
At the beginning of the year | 71,050 | 31,600 | 102,650 |
| 107,025 | ||
Acquisition during the year | 2,724 |
| - | 2,724 |
| 5,304 | |
Disposal during the year | - | - | - | (6,784) | |||
Change in value of investment properties | 1,476 | 500 | 1,976 | (2,895) | |||
Valuation provided by Knight Frank LLP | 75,250 | 32,100 | 107,350 |
| 102,650 | ||
Adjustment to fair value for minimum rent indexation of lease income (Note 11) | (3,573) |
| (3,567) | ||||
Total investment properties | 103,777 | 99,083 | |||||
Change in fair value of investment properties | |||||||
Change in fair value before adjustments for lease incentives and lease obligations | 1,976 | (2,895) | |||||
Movement in lease obligations | - | (63) | |||||
Adjustment to spreading of contracted future rent indexation and tenant incentives | (6) | (25) | |||||
1,970 |
| (2,983) | |||||
Disposal and acquisition of investment property
On 2 December 2024, the Group completed the acquisition of Champneys Beauty College in Tring for a total cost of £2.7 million, including acquisition costs. The Mercure Hotel in Glasgow was disposed on 8 August 2023 for £7.5 million. The gain on disposal was recognised in the Consolidated Statement of Comprehensive Income in 2024.
| |||
| 2025 |
| 2024 |
£'000 | £'000 | ||
|
| ||
Gross proceeds on disposal | - |
| 7,500 |
Selling costs | - | (118) | |
Net proceeds on disposal | - |
| 7,382 |
Carrying value | - | (6,784) | |
Gain on disposal of investment property | - | 598 | |
Valuation of investment properties | |||||||
Valuation of investment properties is performed by Knight Frank LLP, an accredited external valuer with recognised and relevant professional qualifications and recent experience of the location and category of the investment property being valued. The valuation of the Group's investment properties at fair value is determined by the external valuer on the basis of market value in accordance with the internationally accepted RICS Valuation - Professional Standards (incorporating the International Valuation Standards). | |||||||
The determination of the fair value of investment properties requires the use of estimates such as future cash flows from assets (such as lettings, tenants' profiles, future revenue streams, capital values of fixtures and fittings, plant and machinery, any environmental matters and the overall repair and condition of the property) and yield applicable to those cash flows.
The right of use asset is valued at future lease payments discounted using the net equivalent yield on the relevant asset.
| |||||||
Sensitivity analysis to significant changes in unobservable inputs within Level 3 of the fair value hierarchy | |||||||
The significant unobservable inputs used in the fair value measurement categorised within Level 3 of the fair value hierarchy of the entity's portfolios of investment properties are:
1) Estimated Rental Value ('ERV') 2) Net Initial Yield | |||||||
Increases/(decreases) in the ERV (per sq. ft per annum) in isolation would result in a higher/(lower) fair value measurement. Increases/(decreases) in the yield in isolation would result in a lower/(higher) fair value measurement.
The significant unobservable inputs used in the fair value measurement, categorised within Level 3 of the fair value hierarchy of the portfolio of investment property and investments are: | |||||||
Class | Fair value£'000 |
| Valuation technique |
| Significant unobservable inputs |
| Range |
30 June 2025 | |||||||
Investment Properties* | 107,350 | Income capitalisation | ERVNet Initial yield | £4.00 - £21.964.87% - 8.70%** | |||
30 June 2024 | |||||||
Investment Properties* | 102,650 | Income capitalisation | ERVNet Initial yield | £4.50 - £21.963.59% - 8.64%** |
* Valuation per Knight Frank LLP
**Hotels, petrol stations, residential and healthcare are excluded from this range
Sensitivity analysis below:
2025 | |||||||
Change in ERV | Change in net initial yield | ||||||
£'000 | £'000 | £'000 | £'000 | ||||
Sensitivity Analysis | +10% |
| -10% |
| +10% |
| -10% |
Resulting fair value of investment properties | 109,634 | 104,628 | 100,661 | 115,042 | |||
2024 | |||||||
Change in ERV | Change in net initial yield | ||||||
£'000 | £'000 | £'000 | £'000 | ||||
Sensitivity Analysis | +10% |
| -10% |
| +10% |
| -10% |
Resulting fair value of investment properties | 105,152 | 100,042 | 97,041 | 109,391 | |||
11. Trade and other receivables | |||
| 2025 | 2024 | |
| £'000 | £'000 | |
Receivables |
|
| |
Trade debtor | 290 | 252 | |
Less: Provision for impairment of trade debtors | (2) | (2) | |
Other debtors* | 192 | 2,428 | |
480 | 2,678 | ||
|
|
| |
Spreading of minimum contracted future rent indexation | 3,426 | 3,205 | |
Spreading of tenant incentives - rent free periods | 147 | 362 | |
3,573 | 3,567 | ||
Tenant deposit asset (Note 12) | 118 | 118 | |
Other prepayments | 65 | 101 | |
183 | 219 | ||
Trade and other receivables | 4,236 |
| 6,464 |
| |||
* Other debtors at 30 June 2025 includes £nil (2024: £2,155,000) of net proceeds from the sale of properties. This was held by the external lender, Canada Life Investments. The aged debtor analysis of receivables which are past due but not impaired is as follows: | |||
| |||
| 2025 | 2024 | |
| £'000 | £'000 | |
Less than three months due | 476 | 2,672 | |
Between three and six months due | 4 | 6 | |
| 480 | 2,678 | |
12. Trade and other payables | |||
2025 | 2024 | ||
£'000 | £'000 | ||
|
|
| |
Deferred income | 1,654 | 1,665 | |
Trade creditors | 55 | 21 | |
Accruals | 439 | 401 | |
Tenant deposit liability (Note 11) | 118 | 118 | |
Loan interest payable (Note 13) | 256 | 256 | |
Other creditors | 356 | 429 | |
Total trade and other payables | 2,878 | 2,890 | |
|
|
|
|
13. Interest bearing loans and borrowings | |||
| 2025 | 2024 | |
| £'000 | £'000 | |
| |||
Facility drawn | 41,000 |
| 41,000 |
| |||
Unamortised finance costs brought forward | (172) | (276) | |
Amortisation of finance costs (Note 6) | 128 | 104 | |
At end of year | 40,956 | 40,828 | |
Repayable less than one year | 41,000 | - | |
Repayable between one and two years | - | 41,000 | |
Total at end of the year | 41,000 | 41,000 | |
At the year end, the Group had utilised all of its £41 million fixed interest loan facility with Canada Life Investments and was geared at a loan to GAV of 36.9% (2024: 37.7%). The weighted average interest cost of the Group's facility is 3.19% and the facility is repayable on 20 October 2025. Interest expense incurred during the year amounted to £1.31 million (2024: £1.31 million), £0.26 million of which is accrued at the year end (2024: £0.26 million). The Group has secured a new long-term facility with HSBC UK Bank plc which is described in Note 20.
| |||
2025 | 2024 | ||
£'000 | £'000 | ||
Reconciliation to cash flows from financing activities | |||
At beginning of the year | 40,828 |
| 40,724 |
Non-cash changes | |||
Amortisation of loan issue costs | 128 | 104 | |
Total at end of the year | 40,956 | 40,828 | |
|
|
| |
14. Commitments | |||
14.1. Operating lease commitments - as lessor | |||
The Group has 20 commercial properties with 34 units in its investment property portfolio. These non-cancellable leases have a remaining term of between 21 months and 109 years (2024: 10 months to 110 years), excluding ground leases. | |||
Future minimum rentals receivable under non-cancellable operating leases as at the year end are as follows: | |||
2025 | 2024 | ||
£'000 | £'000 | ||
Within one year | 8,878 | 6,839 | |
After one year, but not more than two years | 6,182 | 6,528 | |
After two years, but not more than three years | 5,938 | 6,331 | |
After three years, but not more than four years | 6,017 | 5,746 | |
After four years, but not more than five years | 6,060 | 5,826 | |
After five years, but not more than ten years | 26,703 | 27,129 | |
After ten years, but not more than fifteen years | 20,668 | 20,398 | |
More than fifteen years | 44,326 | 47,712 | |
| 124,772 | 126,509 | |
During the year ended 30 June 2025 there were no material contingent rents recognised as income (2024: nil).
14.2. Capital and financial commitments
There were no capital or financial commitments at the year end (2024: nil).
15. Investments in subsidiaries
The Company has two wholly owned subsidiaries as disclosed below:
Name and company number | Country of registration and incorporation |
| Date of incorporation |
| Principal activity |
| Ordinary Shares held |
Alternative Income REIT Holdco Limited (Company number 11052186) | England andWales | 7 Nov 2017 | Real Estate Company | 73,158,502* | |||
Alternative Income Limited (Company number 10754641) | England andWales | 4 May 2017 | Real Estate Company | 73,158,501* |
* Ordinary shares of £1.00 each.
Alternative Income REIT PLC owns 100% of Alternative Income REIT Holdco Limited.
Alternative Income REIT Holdco Limited owns 100% of Alternative Income Limited.
Both Alternative Income REIT Holdco Limited and Alternative Income Limited are registered at The Scalpel, 18th Floor, 52 Lime Street, London, United Kingdom, EC3M 7AF.
16. Issued share capital and reserves | |||||||
| 2025 | 2024 | |||||
Number ofOrdinary Shares | Number ofOrdinary Shares | ||||||
£'000 | £'000 | ||||||
Ordinary Shares of £0.01 each issued and fully paid | |||||||
At the beginning and end of the year | 805 | 80,500,000 | 805 | 80,500,000 | |||
17. Financial risk management and policies
The Group's activities expose it to a variety of financial risks: market risk, credit risk, liquidity risk and further risks inherent to investing in investment property. The Group has limited exposure to foreign currency risk as most of its transaction is in Sterling. The Group's objective in managing risk is the creation and protection of shareholder value. Risk is inherent in the Group's activities, but it is managed through a process of ongoing identification, measurement and monitoring, subject to risk limits and other controls. The principal risks facing the Group in the management of its portfolio follows.
17.1 Market price risk
Market price risk is the risk that future values of investments in property will fluctuate due to changes in market prices. To manage market price risk, the Group diversifies its portfolio geographically in the UK and across property sectors.
The disciplined approach to the purchase, sale and asset management ensures that the value is maintained to its maximum potential. Prior to any property acquisition or sale, detailed research is undertaken to assess expected future cash flow. The Board and the Investment Adviser meet regularly and are responsible for recommending investment purchases or sales to the AIFM which makes the ultimate decision. In order to monitor property valuation fluctuations, the Investment Adviser meets with the independent external valuer on a regular basis. The valuer provides a property portfolio valuation quarterly, so any movements in the value can be accounted for in a timely manner and reflected in the NAV every quarter.
17.2 Real estate risk
Property investments are illiquid assets and can be difficult to sell, especially if local market conditions are poor. Illiquidity may also result from the absence of an established market for investments, as well as legal or contractual restrictions on resale of such investments.
There can be no certainty regarding the future performance of any of the properties acquired for the Group. The value of any property can go down as well as up.
Real property investments are subject to varying degrees of risk. The yields available from investments in real estate depend on the amount of income generated and expenses incurred from such investments.
There are additional risks in vacant, part vacant, redevelopment and refurbishment situations, although these are not prospective investments for the Group.
These aspects, and their effect on the Group from a going concern perspective are discussed in more detail in the Going Concern policy note.
17.3 Credit risk
Credit risk is the risk that the counterparty (to a financial instrument) or tenant (of a property) will cause a financial loss to the Group by failing to meet a commitment it has entered into with the Group.
It is the Group's policy to enter into financial instruments with reputable counterparties. All cash deposits are placed with an approved counterparty, Barclays International.
In respect of property investments, in the event of a default by a tenant, the Group will suffer a rental shortfall and additional costs concerning re-letting the property. The Investment Adviser monitors tenant arrears in order to anticipate and minimise the impact of defaults by occupational tenants.
The table below shows the Group's exposure to credit risk:
2025 | 2024 | ||
£'000
| £'000
| ||
Debtors | 482 | 2,680 | |
Cash and cash equivalents | 3,148 | 3,292 | |
Total | 3,630 | 5,972 |
17.4 Liquidity risk
Liquidity risk arises from the Group's management of working capital and the finance charges and principal repayments on its borrowings. It is the risk the Group will encounter difficulty in meeting its financial obligations as they fall due as the majority of the Group's assets are investment properties and therefore not readily realisable. The Group's objective is to ensure it has sufficient available funds for its operations and to fund its capital expenditure. This is achieved by quarterly review/ monitoring of forecast and actual cash flows by the Investment Adviser and Board.
The below table summarises the maturity profile of the Group's financial liabilities based on contractual undiscounted payments.
2025 | On demand £'000 | < 3 months £'000 | 3-12 months £'000 | 1-5 years £'000 | Total £'000 |
Interest bearing loans and borrowings | - | - | 41,000 | - | 41,000 |
Interest payable | - | 327 | 327 | - | 654 |
Payables and accrued expenses | 55 | 727 | - | - | 782 |
Total | 55 | 1,054 | 41,327 | - | 42,436 |
2024 | On demand £'000 | < 3 months £'000 | 3-12 months £'000 | 1-5 years £'000 | Total £'000 |
Interest bearing loans and borrowings | - | - | - | 41,000 | 41,000 |
Interest payable | - | 327 | 980 | 652 | 1,959 |
Payables and accrued expenses | 21 | 676 | - | - | 697 |
Total | 21 | 1,003 | 980 | 41,652 | 43,656 |
17.5 Fair value of financial instruments
There is no material difference between the carrying amount and fair value of the Group's financial instruments.
17.6 Interest rate risk
Interest rate risk is the risk that future cash flows of a financial instrument will fluctuate because of changes in market interest rates. The Group's exposure to the risk of changes in market interest rates is minimal because the Group's loan is at a fixed rate of 3.19% (Note 13). The Group has secured a new long-term facility with HSBCUK Bank plc which is described in Note 20.
18. Capital management
The Group's objectives when managing capital are to safeguard the Group's ability to continue as a going concern in order to provide returns for shareholders and to maintain an optimal capital structure to reduce the cost of capital.
To enhance returns over the medium term, the Group utilises borrowings on a limited recourse basis for each investment or all or part of the total portfolio. The Group's policy is to borrow up to a maximum of 40% loan to GAV (measured at drawdown). Alongside the Group's borrowing policy, the directors intend, at all times, to conduct the affairs of the Group so as to enable the Group to qualify as a REIT for the purposes of Part 12 of the Corporation Tax Act 2010 (and the regulations made thereunder). The REIT status compliance requirements include 90% distribution test, interest cover ratio, 75% assets test and the substantial shareholder rule, all of which the Group remained compliant in both this and the prior year.
The monitoring of the Group's level of borrowing is performed primarily using a Loan to GAV ratio. The Loan to GAV ratio is an alternative performance measure and its calculation is shown below. The Group Loan to GAV ratio at the year-end was 36.9% (2024: 37.7%)
Breaches in meeting the financial covenants would permit the lender to immediately call loans and borrowings. During the year, the Group did not breach any of its loan covenants, nor did it default on any other of its obligations under its loan agreements.
19. Transactions with related parties and the Investment Adviser
Parties are considered to be related if one party has the ability to control the other party or exercise significant influence over the other party in making financial or operational decisions.
Directors
Directors are considered to be related parties. Their fees and interests in shares are disclosed in the Remuneration Report in the Annual Report.
Investment Adviser
The Group's Investment Adviser was changed on 15 March 2024 from M7 Real Estate Limited ('M7') to Martley Capital Real Estate Investment Management Ltd ('Martley Capital'). The appointment of Martley Capital was by way of a deed of novation of the Group's Interim Investment Advisory agreement dated 14 March 2020 (as amended with Deed of Variation dated 21 February 2021) with minor changes thereto but leaving the parties on substantially the same terms and at an unchanged fee.
The annual management fee is calculated at a rate equivalent of 0.50% per annum of NAV (subject to a minimum fee of £90,000 per quarter), payable quarterly in advance. During the year the Group incurred £360,000 in respect of investment advisory fees to Martley Capital (2024: a total of £360,000 with £253,000 to M7 and the rest to Martley Capital). No amounts were accrued at the year end (2024: £nil).
20. Events after the reporting date
As announced on 3 September 2025, the Group has secured long term debt facilities with HSBC UK Bank plc. The facilities consist of both a fixed term loan of £31 million and a £10 million RCF collectively known as the New HSBC Bank Facilities. The term of the New HSBC Bank Facilities is a fixed term of five years from the date of drawdown, being 20 October 2025. The New HSBC Facilities can be extended on request by a further two years, should this be mutually acceptable to both parties.
The Group intends to take advantage of the lower interest rates on AIRE's existing debt facilities until these facilities are due for repayment on 20 October 2025. The Group will use the amount drawn down under its New HSBC Bank Facilities to simultaneously repay its existing debt facilities in full.
The margin on the New HSBC Bank Facilities is 170 basis points (1.7% per annum) over SONIA (Sterling overnight index average rate). The loan covenant tests in the New HSBC Facilities are more favourable than those in the current Canada Life facility. The LTV covenant is not to exceed 60% (the current Canada Life loan should not exceed 50%) and the ICR to be greater than 160% (ICR to be greater than 330% under the current Canada Life loan).
Whilst there is no present intention, AIRE has the right, through an accordion mechanism, to request an increase in the size of the RCF by up to a further £10 million (subject to HSBC credit committee approval), over the course of the facility.
Company Statement of Financial Position | |||||||
As at 30 June 2025 | |||||||
Notes | 2025 | 2024 | |||||
£'000 | £'000 | ||||||
|
| ||||||
Assets |
|
| |||||
Non-current Assets | |||||||
Investments in subsidiary companies | 2 | 73,158 | 73,158 | ||||
Investment property | 2 | 1,746 | 1,803 | ||||
Total non-current assets | 74,904 | 74,961 | |||||
Current Assets | |||||||
Receivables and prepayments | 3 | 121 | 132 | ||||
Cash and cash equivalents | 128 | 475 | |||||
Total current assets | 249 | 607 | |||||
Total Assets | 75,153 | 75,568 | |||||
| |||||||
Current Liabilities | |||||||
Payables and accrued expenses | 4 | (7,307) | (14,721) | ||||
|
|
| |||||
Net Assets | 67,846 | 60,847 | |||||
Equity | |||||||
Share capital | 6 | 805 | 805 | ||||
Capital reserve | 2 | 65,379 | 70,431 | ||||
Retained earnings | 1,662 | (10,389) | |||||
Total capital and reserves attributable to equity holders of the Company | 67,846 | 60,847 | |||||
Net Asset Value per share | 84.28p | 75.59p | |||||
As permitted by s408 Companies Act 2006, the Company's profit and loss account has not been presented in these financial statements.
The Company's profit for the year was £12,051,000 (2024: loss of £854,000).
The financial statements were approved by the Board on 3 October 2025 and were signed on its behalf by:
Simon Bennett
Chairman
Company number: 10727886
The accompanying Notes 1 to 7 form an integral part of these financial statements.
Company Statement of Changes in Equity |
For the year ended 30 June 2025 |
|
|
|
|
|
|
| |
| Share capital |
| Capital Reserve | Retained earnings |
| Total equity | |
|
| £'000 |
| £'000 | £'000 |
| £'000 |
For the year ended 30 June 2024 |
| ||||||
Balance at 30 June 2024 |
| 805 |
| 70,431 | (10,389) |
| 60,847 |
|
|
|
|
|
|
|
|
Total comprehensive income | - | - | 12,051 | 12,051 | |||
Dividends paid | - | (5,052) | - | (5,052) | |||
Balance at 30 June 2025 |
| 805 |
| 65,379 | 1,662 |
| 67,846 |
| |||||||
For the year ended 30 June 2024 | |||||||
Balance at 30 June 2023 |
| 805 | 75,417 | (9,535) | 66,687 | ||
|
|
|
|
|
| ||
Total comprehensive loss | - | - | (854) | (854) | |||
Dividends paid | - | (4,986) | - | (4,986) | |||
Balance at 30 June 2024 |
| 805 |
| 70,431 | (10,389) |
| 60,847 |
The accompanying Notes 1 to 7 form an integral part of these financial statements.
Notes to the Company Financial Statements
for the year ended 30 June 2025
1. Accounting policies | |||||||||
Basis of preparation | |||||||||
These financial statements are prepared and approved by the directors in accordance with Financial Reporting Standard 101 Reduced Disclosure Framework (FRS 101) and in accordance with applicable accounting standards.
As permitted by FRS 101, the Company has taken advantage of the following disclosure exemptions which are permissible under FRS 101 as the equivalent disclosures are contained within the Group's consolidated financial statements. - a cash flow statement and related notes; - disclosures in respect of capital management; - the effects of new but not yet effective FRSs; - the disclosures of the remuneration of key management personnel; - disclosure of related party transactions with other wholly owned members of the Ultimate Parent; - the disclosure of financial instruments and other fair value measurements. |
| ||||||||
The financial statements are presented in Pound Sterling and all values are rounded to the nearest thousand pounds (£'000), except when otherwise indicated. They have been prepared on the historical cost basis. |
| ||||||||
The principal accounting policies adopted in the preparation of the Company's financial statements are consistent with the Group which are described in Note 2.5 of the Consolidated Financial Statements but makes amendments where necessary in order to comply with the Companies Act 2006 and taking advantage of the FRS 101 exemptions mentioned above. |
| ||||||||
New standards effective for the current accounting period do not have a material impact on the financial statements of the Company. |
| ||||||||
| |||||||||
The accounting policies used are otherwise consistent with those contained in the Company financial statements for the year ended 30 June 2025. |
| ||||||||
| |||||||||
Going concern |
| ||||||||
The financial statements have been prepared on a going concern basis. |
| ||||||||
| |||||||||
For an assessment of going concern refer to the accounting policy 2.4 of the Consolidated Financial Statements. |
| ||||||||
Investments in subsidiary companies |
| ||||||||
Investments in subsidiary companies which are all 100% owned by the Company are included in the statement of financial position at cost less provision for impairment. |
| ||||||||
Impairment of non-financial assets |
| ||||||||
The carrying amounts of the Company's investment in subsidiaries are reviewed at each reporting date to determine whether there is any indication of impairment. If any such indication exists, then the asset's recoverable amount is estimated. The recoverable amount of an asset is the greater of its value in use and its fair value less costs to sell. |
| ||||||||
An impairment loss is recognised if the carrying amount of an asset exceeds its estimated recoverable amount. Impairment losses are recognised in profit or loss. |
| ||||||||
Impairment losses recognised in prior periods are assessed at each reporting date for any indications that the loss has decreased or no longer exists. An impairment loss is reversed if there has been a change in the estimates used to determine the recoverable amount. An impairment loss is reversed only to the extent that the asset's carrying amount does not exceed the carrying amount that would have been determined, net of depreciation or amortisation, if no impairment loss had been recognised. |
| ||||||||
Deferred income | |||||||||
Deferred income is rental income received in respect of future accounting periods.
|
| ||||||||
2. Investments | |||||||||
2a. Investments in Subsidiary Companies | |||||||||
2025 | 2024 | ||||||||
£'000 | £'000 | ||||||||
At the beginning and end of the year | 73,158 | 73,158 | |||||||
A list of subsidiary undertakings at 30 June 2025 is included on Note 15 of the Consolidated Financial Statements.
The directors have considered the recoverability of the investment in subsidiary companies by comparing the carrying value of the investment to the net asset value of the subsidiaries. The directors consider the net asset value of the subsidiary to be a reliable proxy to the recoverable amount as the properties held by the Company are carried at fair value. The net asset value of the subsidiary companies exceed the carrying amount of the investment in subsidiaries and the directors have concluded that no impairment is necessary.
2b. Investment property | ||||
2025 | 2024 | |||
£'000 | £'000 | |||
|
| |||
At the beginning of the year | 1,803 | 1,814 | ||
Revaluation of investment property | (50) | - | ||
Adjustment to fair value for minimum rent indexation of lease income | (7) | (11) | ||
| 1,746 | 1,803 | ||
| ||||
3. Receivables and prepayments | ||||
2025 | 2024 | |||
£'000 | £'000 | |||
|
| |||
Spreading of contracted future - rent indexation | 82 | 72 | ||
VAT receivable | - | 23 | ||
82 | 95 | |||
Other prepayments | 39 | 37 | ||
| 121 | 132 | ||
4. Payables and accrued expenses | ||||
2025 | 2024 | |||
£'000 | £'000 | |||
|
| |||
Due to subsidiaries | 6,830 | 14,357 | ||
Deferred income | 34 | 34 | ||
Trade creditors | 4 | - | ||
Accruals | 358 | 328 | ||
Other creditors | 81 | 2 | ||
| 7,307 | 14,721 |
Amounts due to subsidiaries are unsecured, interest free and repayable on demand.
5. Dividends paid and payable
Details of dividends paid and payable in respect of the year are set out in Note 9 of the consolidated financial statements.
6. Issued share capital | |||||||
| 2025 | 2024 | |||||
Number ofOrdinary Shares | Number ofOrdinary Shares | ||||||
£'000 | £'000 | ||||||
Ordinary Shares of £0.01 each issued and fully paid | |||||||
At the beginning and end of the year | 805 |
| 80,500,000 |
| 805 |
| 80,500,000 |
7. Contingent liabilities, capital commitments and related party transactions
As at 30 June 2025 the Company had no contingent liabilities or capital commitments (2024: nil).
Related party transactions are the same for the Company as for the Group. For details refer to Note 20 of the Consolidated Financial Statements.
EPRA Performance Measures (Unaudited)
EPRA Yield calculations |
| 2025 £'000 | 2024 £'000 |
Investment properties wholly owned: |
|
|
|
- by Company |
| 1,825 | 1,875 |
- by Alternative Income Limited |
| 105,525 | 100,775 |
Total (Note 10) |
| 107,350 | 102,650 |
Allowance for estimated purchasers' costs (Note 8) | 6,978 | 6,672 | |
Gross up completed property portfolio valuation | B | 114,328 | 109,322 |
| |||
Annualised cash passing rental income | 8,084 | 7,596 | |
Annualised property outgoings | (5) | (5) | |
Annualised net rents | A | 8,079 | 7,591 |
| |||
Add: notional rent expiration of rent-free periods or other lease incentives | 212 | 379 | |
Topped-up net annualised rent | C | 8,291 | 7,970 |
| |||
EPRA NIY | A/B | 7.07% | 6.94% |
EPRA topped-up NIY | C/B | 7.25% | 7.29% |
EPRA Cost Ratios |
|
| 2025 £'000 | 2024 £'000 |
| |
Include: |
| |||||
EPRA Costs (including direct vacancy costs) (Note 4) | A | 1,199 | 1,204 |
| ||
Direct vacancy costs | - | - |
| |||
EPRA Costs (excluding direct vacancy costs) | B | 1,199 | 1,204 |
| ||
Gross rental income (adjusted) (Note 3) | C | 7,922 | 7,358 |
| ||
EPRA Cost Ratio (including direct vacancy costs) | A/C |
| 15.14% | 16.36% |
| |
EPRA Cost Ratio (excluding direct vacancy costs) | B/C |
| 15.14% | 16.36% |
| |
There were no overheads nor operating expenses capitalised in the year in line with IFRS (2024: nil).
| ||||||
EPRA Vacancy rate |
|
| 2025 £'000 | 2024 £'000 | ||
Annualised potential rental value of vacant premises | A | - | - | |||
Annualised potential rental value for the completed property portfolio | B | 7,337 | 6,948 | |||
EPRA Vacancy rate | A/B |
| 0.00% | 0.00% | ||
The Group has not incurred any direct vacancy costs in both the current or prior years.
| ||||||||||||||||||||||||||||||||||||||||||||||||||
| ||||||||||||||||||||||||||||||||||||||||||||||||||
Group has no Joint Ventures so there is no joint venture property to disclose in the above.
Alternative Performance Measures (APMs) (Unaudited) | ||||||||||||||||||||||||||||||||||||||||||||||||||||||||||||||||||||||||||||||||||||||||||||||||||
APMs are numerical measures of the Group's current, historical or future performance, financial position or cash flows, other than financial measures defined or specified in the applicable financial framework. The Group's applicable financial framework is IFRS. The directors assess the Group's performance against a range of criteria which are reviewed by investors as particularly relevant for a closed-end REIT.
Discount The discount is the amount by which the share price is lower than the net asset value per share, expressed as a percentage of the net asset value per share.
| ||||||||||||||||||||||||||||||||||||||||||||||||||||||||||||||||||||||||||||||||||||||||||||||||||
| ||||||||||||||||||||||||||||||||||||||||||||||||||||||||||||||||||||||||||||||||||||||||||||||||||
Loan to GAV Loan to GAV measures the value of loans and borrowings utilised (excluding amounts held as restricted cash and before adjustments for issue costs) expressed as a percentage of the combined valuation of the property portfolio (as provided by the valuer) and the fair value of other assets. | ||||||||||||||||||||||||||||||||||||||||||||||||||||||||||||||||||||||||||||||||||||||||||||||||||
| ||||||||||||||||||||||||||||||||||||||||||||||||||||||||||||||||||||||||||||||||||||||||||||||||||
|
|
| 2025 |
| 2024 | |||||||||||||||||||||||||||||||||||||||||||||||||||||||||||||||||||||||||||||||||||||||||||||
Borrowings (£'000) |
| A | 41,000 | 41,000 | ||||||||||||||||||||||||||||||||||||||||||||||||||||||||||||||||||||||||||||||||||||||||||||||
Total assets (£'000) | B | 111,161 | 108,839 | |||||||||||||||||||||||||||||||||||||||||||||||||||||||||||||||||||||||||||||||||||||||||||||||
Loan to GAV |
|
| A/B |
| 36.88% |
| 37.67% | |||||||||||||||||||||||||||||||||||||||||||||||||||||||||||||||||||||||||||||||||||||||||||
Ongoing Charges The ongoing charges ratio is the total for all operating costs expected to be regularly incurred expressed as a percentage of the average quarterly NAVs of the Group for the financial year. |
| |||||||||||||||||||||||||||||||||||||||||||||||||||||||||||||||||||||||||||||||||||||||||||||||||||||||||||
2025 | 2024 |
| ||||||||||||||||||||||||||||||||||||||||||||||||||||||||||||||||||||||||||||||||||||||||||||||||||||||||||
Other operating expenses for the year (£'000) | A | 1,066 | 1,066 | |||||||||||||||||||||||||||||||||||||||||||||||||||||||||||||||||||||||||||||||||||||||||||||||||||||||||
One-off website costs (£'000) | B | - | (16) | |||||||||||||||||||||||||||||||||||||||||||||||||||||||||||||||||||||||||||||||||||||||||||||||||||||||||
One-off legal fees (£'000) | C | (26) | (20) | |||||||||||||||||||||||||||||||||||||||||||||||||||||||||||||||||||||||||||||||||||||||||||||||||||||||||
Abortive property acquisition costs (£'000) | D | (2) | (62) | |||||||||||||||||||||||||||||||||||||||||||||||||||||||||||||||||||||||||||||||||||||||||||||||||||||||||
E=A+B+C+D | 1,038 | 968 | ||||||||||||||||||||||||||||||||||||||||||||||||||||||||||||||||||||||||||||||||||||||||||||||||||||||||||
Average net assets (£'000) | F | 66,139 | 66,436 | |||||||||||||||||||||||||||||||||||||||||||||||||||||||||||||||||||||||||||||||||||||||||||||||||||||||||
Ongoing charges ratio |
|
| E/F |
| 1.57% |
| 1.46% | |||||||||||||||||||||||||||||||||||||||||||||||||||||||||||||||||||||||||||||||||||||||||||||||||||||
|
| |||||||||||||||||||||||||||||||||||||||||||||||||||||||||||||||||||||||||||||||||||||||||||||||||||||||||||
Glossary
Alternative Investment Fund Manager or AIFM or Investment Manager | Langham Hall Fund Management LLP. |
Company | Alternative Income REIT PLC. |
Contracted rent | The annualised rent adjusting for the inclusion of rent subject to rent-free periods. |
Earnings Per Share ('EPS') | Profit for the period attributable to equity shareholders divided by the weighted average number of Ordinary Shares in issue during the period. |
EPRA | European Public Real Estate Association, the industry body representing listed companies in the real estate sector. |
Estimated Rental Value ('ERV') | The external valuer's opinion as to the open market rent which, on the date of the valuation, could reasonably be expected to be obtained on a new letting or rent review of a property. |
External Valuer | An independent external valuer of a property. The Group's External Valuer is Knight Frank LLP. |
Fair value | The estimated amount for which a property should exchange on the valuation date between a willing buyer and a willing seller in an arm's length transaction after proper marketing and where parties had each acted knowledgeably, prudently and without compulsion. |
Fair value movement | An accounting adjustment to change the book value of an asset or liability to its fair value. |
FCA | The Financial Conduct Authority. |
Gross Asset Value ('GAV') | The aggregate value of the total assets of the Group as determined in accordance with IFRS. |
Gross Passing Rental Income | The gross passing rent is the rent roll at the reporting date, taking account of any in-place rent free incentives or step rents on a straight-line basis over the following 12-month period. |
IASB | International Accounting Standards Board. |
IFRS | International financial reporting standards. On 31 December 2020 EU-adopted IFRS was brought into UK law and became UK-adopted international accounting standards, with future changes to IFRS being subject to endorsement by the UK Endorsement Board. |
Investment Adviser or Martley Capital | Martley Capital Real Estate Investment Management Limited. |
IPO | The admission to trading on the London Stock Exchange's Main Market of the share capital of the Company and admission of Ordinary Shares to the premium listing segment (now the Closed-ended investment funds category) of the Official List on 6 June 2017. |
Lease incentives | Incentives offered to occupiers to enter into a lease. Typically, this will be an initial rent-free period, or a cash contribution to fit-out. Under accounting rules, the value of the lease incentive is amortised through the Consolidated Statement of Comprehensive Income on a straight-line basis until the lease expiry. |
Loan to Value ('LTV') | The value of loans and borrowings utilised (excluding amounts held as restricted cash and before adjustments for issue costs) expressed as a percentage of the combined valuation of the property portfolio (as provided by the valuer) and the fair value of other investments. |
Net Asset Value ('NAV') | Net Asset Value is the equity attributable to shareholders calculated under IFRS. |
Net Asset Value per share | Equity shareholders' funds divided by the number of Ordinary Shares in issue. |
Net equivalent yield | Calculated by the Group's External Valuers, net equivalent yield is the internal rate of return from an investment property, based on the gross outlays for the purchase of a property (including purchase costs), reflecting reversions to current market rent and items as voids and non-recoverable expenditure but ignoring future changes in capital value. The calculation assumes rent is received annually in arrears. |
Net Initial Yield ('NIY') | The initial net rental income from a property at the date of purchase, expressed as a percentage of the gross purchase price including the costs of purchase. Initial yield does not include cost of purchase. |
Net rental income | Rental income receivable in the period after payment of ground rents and net property outgoings. |
Ordinary Shares | The main type of equity capital issued by conventional Investment Companies. Shareholders are entitled to their share of both income, in the form of dividends paid by the Company, and any capital growth. |
REIT | A Real Estate Investment Trust. A company which complies with Part 12 of the Corporation Tax Act 2010. Subject to the continuing relevant UK REIT criteria being met, the profits from the property business of a REIT, arising from both income and capital gains, are exempt from corporation tax. |
Reversion | Increase in rent estimated by the Company's External Valuers, where the passing rent is below the ERV. |
Share price | The value of a share at a point in time as quoted on a stock exchange. The Company's Ordinary Shares are quoted on the Main Market of the London Stock Exchange. |
Weighted Average Unexpired Lease Term ('WAULT') | The average lease term remaining for first break, or expiry, across the portfolio weighted by contracted rental income (including rent-frees). |
Company Information
Share Register Enquiries
The register for the Ordinary Shares is maintained by Computershare Investor Services PLC. In the event of queries regarding your holding, please contact the Registrar on 0370 707 1874 or email: [email protected].
Changes of name and/or address must be notified in writing to the Registrar, at the address shown below. You can check your shareholding and find practical help on transferring shares or updating your details at www.investorcentre.co.uk. Shareholders eligible to receive dividend payments gross of tax may also download declaration forms from that website.
Share Information
Ordinary £0.01 shares 80,500,000
SEDOL Number BDVK708
ISIN Number GB00BDVK7088
Ticker/TIDM AIRE
Share Prices
The Company's Ordinary Shares are traded on the Main Market of the London Stock Exchange.
Frequency of NAV publication
The Group's NAV is released to the London Stock Exchange on a quarterly basis and is published on the Company's website www.alternativeincomereit.com.
Annual and Interim Reports
Copies of the Annual and Half-Yearly Reports are available from the Group's website.
Financial Calendar
30 June Year end
September Announcement of annual results
November Annual General Meeting
31 December Half year end
March Announcement of interim results
Quarterly dividends are paid in November, February, May and August for each financial year.
Shareholder Information
Directors Simon Bennett (independent non-executive chairman) Stephanie Eastment (independent non-executive director) Adam Smith (non-executive director)
| Property Manager Mason Owen and Partners Limited 7th Floor 20 Chapel Street Liverpool
|
Registered Office The Scalpel 18th Floor 52 Lime Street London EC3M 7AF
https://www.alternativeincomereit.com/
Registered in England and Wales No. 10727886
|
Valuer Knight Frank LLP 55 Baker Street London W1U 8AN |
Company Secretary Hanway Advisory Limited The Scalpel 18th Floor 52 Lime Street London EC3M 7AF
|
Registrar Computershare Investor Services PLC The Pavilions Bridgwater Road Bristol BS13 8AE
|
AIFM Langham Hall Fund Management LLP 1 Fleet Place 8th Floor London EC4M 7RA
|
Auditor Moore Kingston Smith LLP 9 Appold Street London EC2A 2AP
|
Depositary Langham Hall UK Depositary LLP 8th Floor 1 Fleet Place London EC4M 7RA
|
Corporate Broker Panmure Liberum Ltd Ropemaker Place, Level 12 25 Ropemaker Street London EC2Y 9LY
|
Investment Adviser and Administrator Martley Capital Real Estate Investment Management Ltd The Rookery, 4th Floor Dyott Street London WC1A 1DE |
|
Related Shares:
Alternative Inc