10th Feb 2026 07:00
10 February 2026
www.asia-strategic.comAsia Strategic Holdings Ltd.
("Asia Strategic", the "Group" or the "Company")
Results for the financial year ended 30 September 2025
Asia Strategic Holdings Ltd. (LSE: ASIA), the independent developer and operator of consumer businesses in Emerging Asia, is pleased to announce the publication of its full year results for the financial year ended 30 September 2025.
The Group's audited financial statements for the year ended 30 September 2025 received an unqualified audit opinion ("FY25 Accounts"). The FY25 Accounts will be available on the Company's website at www.asia-strategic.com. A copy of the FY25 Accounts will be submitted to the National Storage Mechanism ("NSM") where it will be available for public inspection at: https://data.fca.org.uk/#/nsm/nationalstoragemechanism
Following publication of the FY25 Accounts and the uploading of them to the NSM, the Company will be requesting a restoration of the listing of the Ordinary Shares. In the meantime, the Company's Ordinary Shares remain suspended from the Official List Equity Shares (transition) category of the Financial Conduct Authority ("FCA") pending further notice.
The Directors of the Group confirms that the financial information for the years ended 30 September 2025 and 2024 are derived from the Group's audited financial statements and that these are not statutory accounts and, as such, do not contain all information required to be disclosed in the full financial statements prepared in accordance with International Financial Reporting Standards (IFRS) as adopted by the European Union. The financial information contained within this full year results statement was approved and authorised for issue by the Board on 9 February 2026.
All data for the reporting period refer to the financial year ended 30 September 2025 ("FY25") and the comparative period refer to the financial year ended 30 September 2024 ("FY24"), unless otherwise stated.
The year-on-year ("YOY") growth or decline refers to any change that occurred between FY25 and FY24, or equivalent periods of one year, as applicable.
All figures are reported in United States Dollars ("$"), unless otherwise specified.
All data pertaining to the student numbers across the report, including tables and charts, are rounded to the nearest ten for clarity and presentation purposes.
HIGHLIGHTS
Financial highlights
· Group revenue increased 8% YOY to $32.1 million in FY25 (FY24: $29.7 million).The Education division accounted for 78% of revenue (FY24: 76%), while Services contributed 22% (FY24: 24%). Key drivers of this growth included:
· A 19% increase in Myanmar's Education division (FY24: 42% increase) driven by contributions from new businesses and continued scaling of existing operations;
· A 2% growth in Services (FY24: 31% increase), as the Myanmar Services division continued to contribute through improved commercial positioning and expansion of high-value service offerings; and
· A 6% decline (FY24: 4% decline) in Vietnam's Education division due to the continued restructuring of Wall Street English Vietnam.
· Group gross profit increased 11% YOY to $18.9 million in FY25 (FY24: $17.0 million), with the Education division contributing 94% (FY24: 91%) and the Services division 6% (FY24: 9%). Revenue growth outpaced the cost of services, with the Group's gross margin improving to 59% (FY24: 57%). The improvement in the Education division gross margin to 71% (FY24: 68%) was offset by a decline in the Services division gross margin to 16% (FY24: 23%). The improvement within the Education division reflects the Group's growing operational efficiency as knowledge is consolidated across brands, leading to better cost control in mature businesses, while newer ventures continue to scale and meet expectations. The Services division's gross margin declined in FY25 due to a shift toward a lower-margin contract mix driven by local business demand coupled with continued cost inflation.
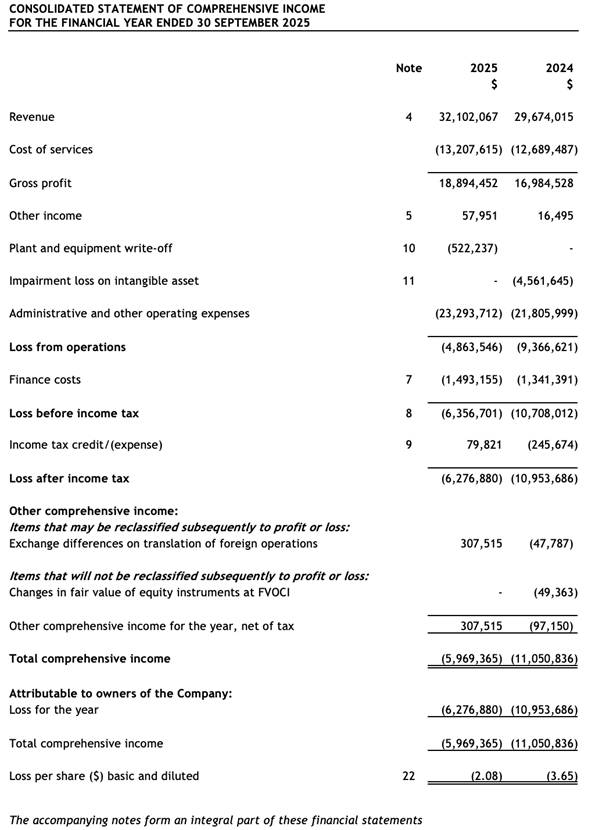
· The Group's net loss narrowed to $6.3 million in FY25 (FY24: $11.0 million loss), primarily reflecting the absence of a one-time $4.6 million goodwill impairment at Wall Street English Vietnam recorded in FY24. The main cause of the losses in FY25 was a foreign exchange loss of $2.8 million, due to heightened currency volatility in key markets, and a plant and equipment write-off of $0.5 million, due to earthquake damage. Despite this, operating expenses were effectively controlled, increasing by only 1% YOY, underscoring management's disciplined cost management as new businesses scale and mature operations become more efficient.
· Group adjusted EBITDA loss (excluding impairment losses and interest on lease liabilities) also narrowed to $0.3 million in FY25 (FY24: $0.7 million loss). The improvement was driven by reduced losses at Wall Street English Vietnam and growth in the Group's start-up businesses, partially offset by higher foreign exchange losses. Marketing expenses decreased $0.4 million YOY to $3.1 million in FY25, reflecting improved spending efficiency amid stronger sales activity. Overall, underlying operational performance strengthened as cost control measures and improved performance at the Group's start-up businesses took effect.
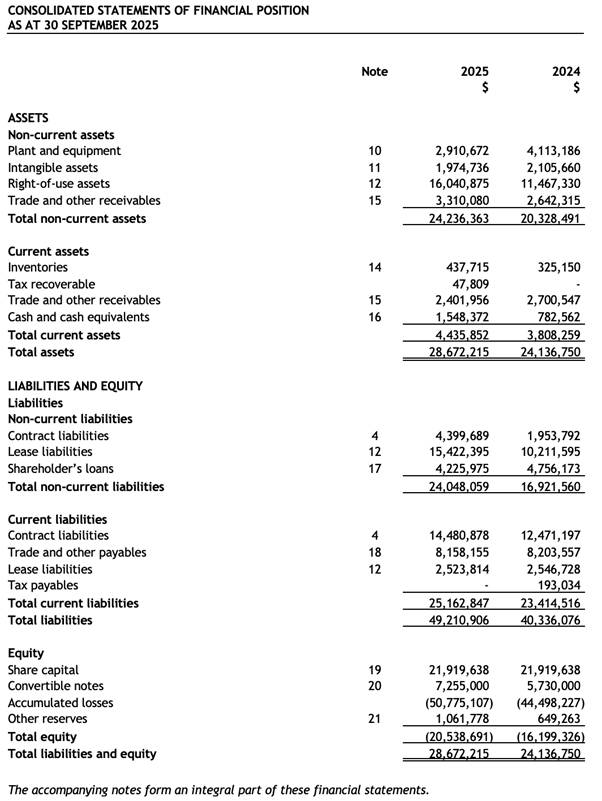
· At 30 September 2025, deferred revenue, representing cash received in advance of service delivery, was $18.9 million, of which $14.5 million (30 September 2024: $12.4 million) was current, and $4.4 million (30 September 2024: $2.0 million) was non-current.
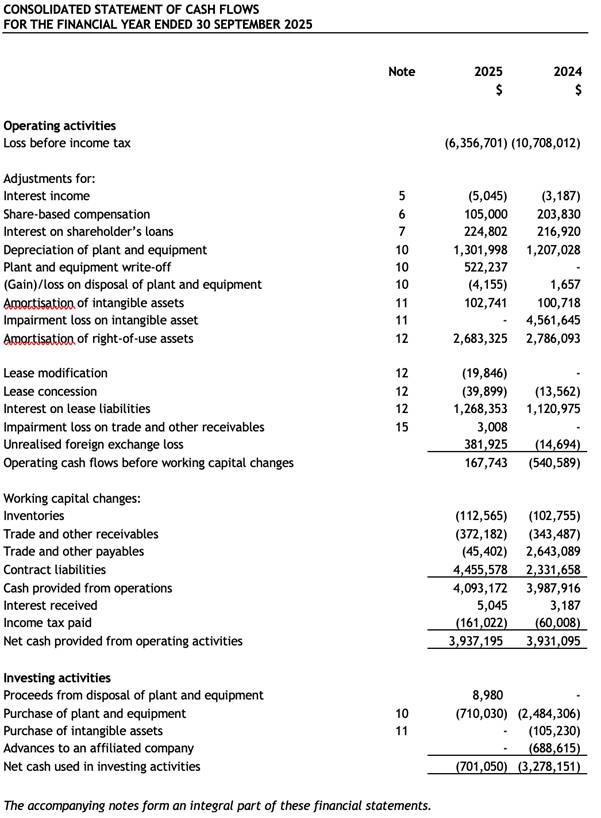
· The Group reported a positive operating cash flow of $3.9 million (FY24: $3.9 million) because of increased advance payments in the Education division. If repayment of lease liabilities (including principal and interest) were considered, the Group would have recorded a positive cash flow of $0.7 million (FY24: positive $0.6 million). This improvement reflects a more efficient cash conversion cycle and disciplined working capital management. In parallel, the Group adopted a more strategic approach at Wall Street English Vietnam, implementing targeted cost reductions and commercial adjustments to support its pathway to profitability.
· The Group invested $0.7 million in FY25 (FY24: $2.5 million), primarily to establish four new schools across the Group's newer brands, Kids&Us and Logiscool. A significant portion of the investment was directed towards the repair and renovation of Auston's and Wall Street English's Mandalay schools following the devastating earthquake in March 2025. Capital expenditures across other businesses were limited to routine maintenance.
· The Group maintained a $4.5 million loan facility with MACAN, the Group's largest shareholder. During FY25, $45k was drawn down. As of the report date, $0.8 million remains available to the Group.
· Diversification of the Group's operations across multiple countries continues to play an important role in mitigating single-country risk. Management has determined that there are sufficient mitigating actions within the Group's control to ensure liquidity for at least the next twelve months from the date of this report. These include controlled business expansion, disciplined financial management, access to the unused loan facility with MACAN, diversification of the capital structure through potential bank loans, and vendor financing.
Operational Highlights
Education
· Revenue from Education businesses increased 10% YOY to $25.0 million in FY25 (FY24: $22.7 million).
· At 30 September 2025, deferred revenue from Education businesses, representing cash received in advance of service delivery, comprised:
- Current: $14.2 million (30 September 2024: $12.1 million)
- Non-Current: $4.4 million (30 September 2024: $2.0 million).
· The Education division operates across Vietnam and Myanmar with the following businesses:
Vietnam
(i) Wall Street English - English language education for adults.
(ii) Kids&Us - English language education for children and teens.
(iii) Logiscool - Coding education for children and teens.
Myanmar
(i) Wall Street English - English language education for adults.
(ii) Kids&Us - English language education for children and teens.
(iii) Logiscool - Coding education for children and teens.
(iv) Yangon American International School ("Yangon American") - K-12 international school.
(v) Auston - Tertiary education.
· The number of schools and students at the end of each financial year were:
Number of Schools | Number of Students | |||||
2025 | 2024 | 2023 | 2025 | 2024 | 2023 | |
Vietnam | 16 | 17 | 11 | 4,610 | 4,300 | 4,040 |
Wall Street English | 7 | 9 | 7 | 3,320 | 3,450 | 3,680 |
Kids&Us | 6 | 6 | 4 | 1,130 | 770 | 360 |
Logiscool | 3 | 2 | - | 160 | 80 | - |
Myanmar | 19 | 16 | 9 | 5,800 | 5,030 | 4,650 |
Wall Street English | 5 | 6 | 5 | 3,290 | 3,260 | 3,700 |
Kids&Us | 4 | 3 | 1 | 610 | 480 | 100 |
Logiscool | 6 | 3 | - | 850 | 320 | - |
Yangon American | 2 | 2 | 1 | 190 | 150 | 100 |
Auston | 2 | 2 | 2 | 860 | 820 | 750 |
Group | 35 | 33 | 20 | 10,410 | 9,330 | 8,690 |
Vietnam
The number of students increased 7% compared to 30 September 2024 driven by growth at Kids&Us Vietnam and Logiscool Vietnam.
· Wall Street English Vietnam: The number of students decreased during the year but only slightly, as the closure of two schools was offset by the increased demand for the online product. A new leadership team was appointed to lead the transition to profitability by improving operational efficiency, optimising digital channels, and strengthening collaboration with the franchisor. In response to a continued shift towards online preferences, the Group adjusted staffing, restructured service teams, downsized space, and recalibrated its commercial strategy.
· Kids&Us Vietnam: Growth continued with financial and operational performance broadly in line with expectations, supported by maturing schools (five out of six schools have over 150 students) that are delivering higher enrolment and operating leverage, driving improved unit economics. Retention rates have strengthened, though they remain below the levels required to reach optimal capacity utilisation. The Group advanced its growth agenda by refining site selection toward smaller spaces and improving service team efficiency to maximise class sizes, optimise space utilisation, and enhance margins.
· Logiscool Vietnam: Growth remained subdued with weak commercial performance and limited school expansion. With new leadership and a fresh approach to commercialisation, Logiscool Vietnam is positioned to achieve better commercial performance going forward.
Myanmar
The number of students increased 15% compared to 30 September 2024 driven by growth across all brands. Despite significant challenges, notably the earthquake in Mandalay, performance was strong demonstrating the resilience of the businesses.
· Wall Street English Myanmar: Price increases, combined with stable student enrolment, supported growth, although they also raised affordability concerns among certain customer segments. The team continued to respond effectively to market pressures by reducing dollar-denominated costs and enhancing pricing competitiveness, positioning the brand for stronger performance in FY26.
· Kids&Us Myanmar: The experienced leadership team, shared with Vietnam since early FY25, has stabilised the business and contributed to strong enrolment. However, retention rates were softer than expected which limited growth. Management is actively addressing this through targeted operational initiatives and service-level improvements.
· Logiscool Myanmar: Robust growth was driven by a combination of accumulated market knowledge, an experienced commercial team, and a favourable market position. Enrolment numbers nearly tripled, while revenue increased almost sevenfold.
· Yangon American: Growth remained stable, supported by a stronger commercial focus and a more consistent faculty base. A key milestone during the period was the appointment of an experienced Head of School to lead Yangon American through its next phase. A new site in central Yangon for the Secondary school opened in January 2026. The new site provides the required indoor and outdoor space for older students. At the same time, relocating the existing Junior High and High School students to the new campus frees up space at the existing Elementary campus to expand lower-grade capacity. These developments position Yangon American for a potential breakthrough year ahead.
· Auston: Further announcements on the conscription law have created renewed uncertainty among younger demographics, impacting student enrolments in early 2025. The Mandalay earthquake in March further compounded the acquisition cycle and increased operating costs. Despite these challenges, Auston demonstrated resilience under new leadership, with sales and enrolment stabilising. The academic offering was strengthened through new partnerships with UK academic institutions.
Services
· Revenue from Services businesses increased 2% YOY to $7.1 million in FY25 (FY24: $7.0 million).
· At 30 September 2025, deferred revenue from Services businesses, representing cash received in advance of service delivery, was $0.3 million (30 September 2024: $0.3 million). The marginal decrease is the result of a large one-off integrated security project with revenue recognised in FY24.
The Services division consists of the following products:
Vietnam
(i) EXERA Vietnam - Integrated facility management.
· EXERA Vietnam: In FY24, the Group established EXERA Vietnam as an integrated facility management company to serve both internal and external customers. Modest revenue was generated from its first few customers in FY25. The Group is evaluating strategic partnership opportunities to strengthen and scale the business.
Myanmar
(i) EXERA Myanmar - Integrated risk management services.
(ii) Ostello Bello - Boutique hostels.
· EXERA Myanmar: Employed over 1,900 security officers as of 30 September 2025 (30 September 2024: circa 1,710) across circa 250 sites in Myanmar (30 September 2024: circa 230 sites). This growth was driven by new customer acquisition among local corporations as well as by the expansion of services to United Nations agencies and embassy clients.
· Ostello Bello: Operates one boutique hostel with circa 40 beds and circa 12 rooms in Bagan. The earthquake in Mandalay necessitated the difficult decision to close the Mandalay hostel after ten years in operation. Overall sector activity remains subdued due to the continued low levels of inbound international tourism.
SIGNIFICANT AND SUBSEQUENT EVENTS
1) Impact of the Myanmar earthquake and business continuity
On 28 March 2025, a 7.7-magnitude earthquake struck central Myanmar, followed by several aftershocks. The affected regions included Sagaing, Mandalay, Magway, Bago, and northeastern Shan State. The earthquake caused extensive disruption to electricity, internet connectivity, transportation, and essential public services.
Independent assessments estimate total economic damages at approximately $11 billion, equivalent to about 14% of Myanmar's GDP. Humanitarian agencies estimate that over 3,600 people died, approximately 200,000 people were displaced, and around 2 million people required critical humanitarian assistance.
The Group's corporate offices and operations in Yangon were largely unaffected, although the premises of Wall Street English, Logiscool, Auston, and Ostello Bello in Mandalay were significantly impacted and were closed for an extended period of time. No casualties or serious injuries were reported among our students, staff, or guests.
During the disruption, the Group transitioned immediately to online delivery for its English language and coding programmes. For learners without reliable access to electricity or internet, the Group offered study breaks, course extensions, and flexible scheduling. Structural engineering assessments were undertaken promptly on all facilities, and appropriate repair works were completed. All affected schools and facilities received the official safety approvals from the authorities and have now reopened. However, the damages necessitated substantial refurbishment and refitting. As a result, the Group has written off the carrying amounts of leasehold improvements and furniture & fittings for these sites, totalling $0.5 million, as disclosed in Notes 10 of the financial statements.
2) Safeguarding communities through earthquake response and recovery efforts
The Group responded rapidly to support its employees, students, and local communities. Immediate assistance included shelter, food, water, temporary accommodation, and relocation support for affected staff and stakeholders. The Group contributed approximately $30,000 through the European Chamber of Commerce to support emergency relief efforts.
To strengthen longer-term rehabilitation, the Group established an Earthquake Relief Fund, seeded with approximately $46,000 from key management and open to contributions from employees across the organisation. The fund provided targeted support to affected employees and contributed to broader community recovery initiatives.
EXERA, the Group's integrated risk-management business, played a vital on-the-ground role in Mandalay by providing site security, secure logistics, and emergency response services to ensure safe and effective distribution of humanitarian aid.
The Group has completed all required structural repairs to its school premises and obtained the necessary clearances. It remains fully committed to maintaining the highest safety standards as on-site operations resume. Asia Strategic Holdings remains focused on navigating the aftermath of the earthquake with resilience, prioritising the safety of its people and ensuring business continuity.
3) Global macroeconomic and geopolitical uncertainties
Global trade and geopolitics remain volatile through 2025 and early 2026, with the U.S. rolling out a baseline tariff and country-specific "reciprocal" tariffs in April 2025 and then recalibrating some rates and exemptions over subsequent months as negotiations progressed. The policy direction is still toward using tariffs to rebalance trade, but implementation has become more fluid: featuring temporary pauses, deal-linked adjustments, and sector carve-outs (notably recent agricultural exemptions). This shifting landscape continues to weigh on regional sentiment, supply chains, and inflation expectations, supporting a prudent stance on operating costs and capital allocation.
Vietnam has moved into a more constructive track within this framework. The U.S. and Vietnam agreed on 26 October 2025, a Framework for an Agreement on Reciprocal, Fair, and Balanced Trade: the U.S. keeps a 20% reciprocal tariff as the baseline for now, while working toward a product-specific exemption list that could reduce selected Vietnamese exports to 0% once a final agreement is signed and implemented. Vietnam, in return, will eliminate tariffs on nearly all U.S. exports and address key non-tariff barriers and enforcement areas. Talks remain active, but the scope and timing of U.S. zero-tariff carve-outs are still unresolved, so near-term uncertainty persists.
For Myanmar, reciprocal tariffs remain very high due to the absence of a concluded trade arrangement, implying continued external pressure on export-linked sectors and broader macro fragility.
4) Convertible Note Programme
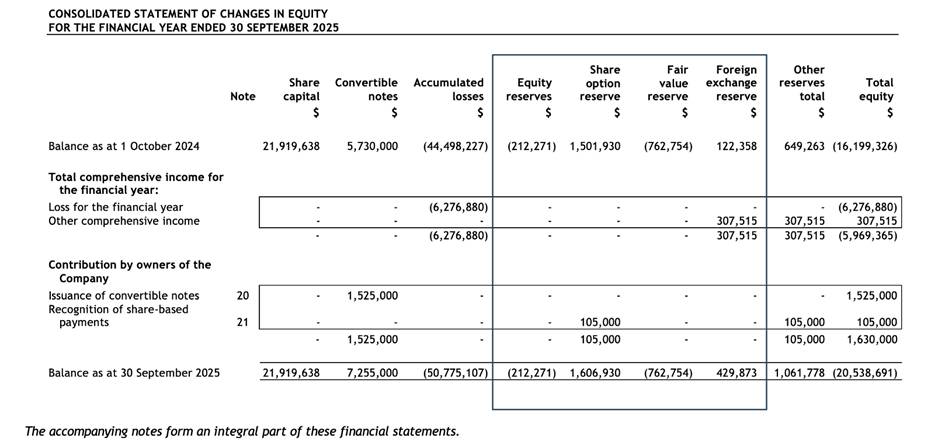
Details of the updated Convertible Note Programme are disclosed in Note 20 to the financial statements.
COUNTRY ECONOMIC UPDATES
The most recent forecast by the Asian Development Bank (the "ADB") is for developing Asia's GDP growth of 5.1% in 2025 and 4.6% in 2026.
Inflation in developing Asia is expected to be 1.6% in 2025 and 2.1% in 2026, as supply chain disruptions ease further, lowering food and fuel prices.
Vietnam
The years stated below refer to the calendar year, which runs from 1 January to 31 December unless otherwise stated.
· According to the General Statistics Office of Vietnam (the "GSO"), GDP growth for the 9M 2025 was 7.9% YOY, exhibiting strong economic fundamentals and a long-term positive outlook. The full-year 2024 GDP growth was 7.1%, while ADB forecasts 6.0% growth in 2026. Average CPI for 9M 2025 increased by 3.3% YOY, while core CPI rose by 3.1%. Key inflation drivers included rising costs in education, transportation, F&B, electricity, housing, and construction materials.
· Vietnam's exports in the 9M 2025 are estimated to have grown 16% YOY to $348.7 billion, while imports were estimated to have increased 19% YOY to $332.0 billion. This led to a trade surplus of $16.8 billion, according to the GSO. For 9M 2025, Vietnam's trade surplus with the United States exceeded $99.0 billion, despite the 20% U.S. tariff on Vietnamese imports implemented in July 2025.
· Vietnam's industrial sector continued to strengthen in 9M 2025, with the Index of Industrial Production rising 9% YOY, according to the GSO. Meanwhile, Vietnam's S&P Global Manufacturing PMI remained at 50.4 in September 2025, unchanged from the previous month, indicating modest expansion supported by recovering new orders and sustained output growth.
· Vietnam's public investment disbursement reached $16.6 billion through 9M 2025, equivalent to 50% of the Prime Minister's annual target. With only four months remaining, half of the capital plan is still undisbursed, heightening pressure to achieve the Government's 100% target. Over the same period, Vietnam maintained strong foreign direct investment ("FDI") momentum, with realised FDI reaching a five-year high of $18.8 billion, up 9% YOY, and registered FDI rising 15.2% to $28.5 billion, underscoring investors' sustained confidence.
· Since early 2025, the Vietnamese Dong has depreciated more than 3% against the USD. Although Vietnam posted a $16.8 billion trade surplus in 9M 2025 and continued to receive solid FDI and remittance inflows, USD liquidity in the banking system remains tight as the Fed keeps rates at 4.00-4.25%. In response to the intense exchange rate pressure, the State Bank of Vietnam intervened by selling USD in August and then again in October 2025 worth a cumulative $2.9 billion.
· Over the past two decades, Vietnam has evolved from a low-income to an upper-middle-income band (from $4,466 to $13,845) according to the World Bank, with 2024 GDP per capita estimated at $4,700. With a population of 102.2 million in 2025 and a median age of 33.4 years old, Vietnam is the third most populous country in Southeast Asia, after Indonesia (284.4 million) and the Philippines (114.4 million) according to the International Monetary Fund. The population is projected to grow steadily, reaching 105.4 million by 2030.
· The country's Human Development Index rose from 0.493 in 1990 to 0.766 in 2023, placing Vietnam in the High Human Development category and ranking 93rd out of 193 countries and territories. According to the EF English Proficiency Index in 2024, Vietnam was still classified as "Low proficiency".
· The GSO estimates that Vietnam's workforce grew to 53.3 million during Q3 2025. The large and low-cost labour force, coupled with a stable and favourable macro environment, has made Vietnam an attractive hub for foreign investment. It is particularly appealing to global manufacturers looking to diversify and de-risk their value chain.
Myanmar
The years stated below refer to the calendar year, which runs from 1 January to 31 December, and the financial year below refers to the Myanmar financial period, which runs from 1 April to 31 March.
· Myanmar's economy remains stagnant, with the ADB forecasting GDP to contract by 3.0% in 2025, followed by a modest recovery of 2.0% in 2026. Activity across all sectors has declined sharply after the March 2025 earthquake, including manufacturing and services.
· Inflationary pressures persist due to supply disruptions caused by halted border trade and earthquake-related damage, which has reduced agricultural output in several regions. Lower import volumes are expected to drive further increases in food prices. The ADB projects inflation to reach around 30% by the end of 2025, easing to approximately 23% in 2026 as a result of a stabilising currency and weakening domestic demand.
· According to the World Bank, Myanmar recorded a trade surplus of about $1.0 billion (circa 1.3% of GDP) in FY25, driven mainly by import compression amid tighter licensing, and border disruptions. In the first half of FY26 (April-September 2025), the trade surplus narrowed to roughly $0.7 billion, about 50% lower than a year earlier, as reconstruction-related needs lifted imports by 23% against an 11% rise in exports. Structural shifts were evident, with land-route imports from Thailand down 81% in 2024 and sea imports up 37%, contributing to higher logistics costs and inflationary pressures. Looking ahead, significant risks remain as the economy is constrained by tight external financing, border-trade disruptions, and strong dollar/kyat dynamics. The trade surplus is more a symptom of import weakness than of export strength, creating inflationary pressures even as formal trade balances improve.
· According to the World Bank, Myanmar's fiscal deficit widened to 4.1% of GDP in FY25 and is expected to increase further to 4.9% in FY26, reflecting rising reconstruction and humanitarian spending. The current account shifted to a surplus of 3.2% of GDP in FY25, supported by import compression and remittances, but is expected to narrow to 0.4% of GDP in FY26. FDI remained low with commitments remaining steady at $1.0 billion in FY25 and $0.3 billion in the first half of FY26.
· CBM foreign-exchange interventions declined in 2025. Between April and October 2025, the CBM sold around $249 million in FX, compared with $780 million in the previous seven months and $1.2 billion a year earlier, amid constrained FX availability and a shifting focus to import controls. Demand for essential imports, including fuel, edible oil, and fertilisers, remained elevated due to reconstruction and supply-chain pressures.
· Myanmar faces persistent infrastructure and energy challenges, worsened by reduced FDI, limited external support, and widespread power shortages. Seasonal hydropower dependence and earthquake-related grid damage continue to drive frequent outages. Moreover, approximately 80% of natural gas production is committed through long-term contracts to neighbouring nations.
· Political uncertainty, including the introduction of conscription, and rising internal displacement continue to destabilise the labour market, hinder economic recovery, and shift consumer behaviour. Coupled with inflationary pressures, these factors have led to a significant rise in price sensitivity across the population.
· The ADB estimates per capita GDP will grow by 0.4% in 2025, after contracting by roughly 1.5% in 2024, implying a very shallow recovery in living standards. In line with this, the World Bank projects that aggregate output will remain around 13% below pre-pandemic levels in FY25, underscoring the depth of the shock. Meanwhile, the World Bank's State of Education in Myanmar report noted a significant rise in household spending on private tutoring in 2023, as families sought to support their children's education amid uncertain times, a trend that is expected to remain stable.
· Labour market conditions remain fragile, characterised by under-employment and a shift to low-productivity work. According to the World Bank, Myanmar's employment to working-age population ratio is 61%. Prolonged conflict remains a key factor for unemployment, and the World Bank reported that 3.6 million people (6% of the population) were internally displaced, and 22 million people (37% of the population) require humanitarian assistance as of November 2025.
CHAIRMAN'S STATEMENT
Dear Shareholders,
The past financial year was characterised by steady progress, disciplined execution, and continued resilience, notwithstanding the devastation brought by the 7.7 magnitude earthquake in Central Myanmar in March 2025. While the macroeconomic and geopolitical environment remained complex, the Group delivered meaningful revenue growth, strengthened its gross margins, and accelerated operational efficiency initiatives. These achievements underscore both the quality of our diversified platform and our commitment to empowering communities through education and essential services.
Achievements and Growth Potential
Group revenue increased 8% YOY to $32.1 million (FY24: $29.7 million), with the Education division contributing 78% and Services 22% of total revenue. Growth was underpinned by a strong contribution from Myanmar, whereas Vietnam remained subdued yet maintained a stable operational footing.
Key contributors included:
· Education Myanmar: Revenue grew 19%, supported by continued scaling of existing operations.
· Education Vietnam: Revenue declined 6%, driven by the ongoing restructuring of Wall Street English Vietnam, partially balanced by growth at other businesses.
· Services: Delivered 2% growth, underpinned by improved commercial positioning and enhanced delivery of high-value services.
Group gross profit rose 11% to $18.9 million, with gross margin growing to 59%, from improved operational efficiency and the contribution from maturing schools. Education gross margin improved to 71% from 68% the prior year, partially offset by a lower Services gross margin at 16% down from 23% the prior year.
These results reinforce the scalability and resilience of businesses as we continue to build a platform for long-term, sustainable growth.
Portfolio Optimisation and Operational Efficiency
FY25 was a year of focused execution as the Group strengthened operational resilience, optimising the portfolio, and maintaining firm financial discipline across all businesses. Management advanced several initiatives to enhance profitability and operational effectiveness:
· Restructuring at Wall Street English Vietnam: The closure of two underperforming schools, streamlining of administrative and operating costs, and tighter commercial execution created a leaner foundation for the future.
· Scalable, capital-efficient school formats: Expansion continued through smaller, modular formats across Kids&Us and Logiscool, supporting disciplined growth with lower upfront investment and quicker breakeven timelines.
· Enhanced cost control: Operating expenses rose only 5% despite inflationary pressures and currency volatility, reflecting strengthened processes and improved efficiency across the Group.
Financial Discipline and Cash Flow Strengthening
The Group's financial performance reflected the benefits of disciplined capital allocation and improving operational maturity:
· Net loss narrowed to $6.3 million (FY24: $11.0 million), with stable adjusted EBITDA at a $0.3 million loss (FY24: 0.7 million loss).
· Positive operating cash flow of $3.9 million (FY24: $3.9 million) and positive adjusted operating cash flow of $0.7 million after lease payments (FY24: $0.6 million).
· Deferred revenue increased to $18.9 million (FY24: $14.4 million), demonstrating a stable commercial pipeline.
· Capex contained at $0.7 million (FY24: $2.5 million), reflecting a disciplined investment approach.
Economic, Environmental, Social and Governance
Our commitment to responsible, inclusive and transparent business practices remains central to how we operate across Emerging Asia. In FY25, we continued to strengthen our social impact, deepen local capability development, and uphold international governance standards that guide our long-term sustainability.
Key indicators include:
· Over 2,700 employees across Myanmar and Vietnam, with 97% local workforce participation.
· 67% female representation, excluding security personnel.
· Continued adherence to ICoCA standards, reinforcing our commitment to ethical conduct and governance excellence.
Earthquake Response in Myanmar
In March 2025, a significant earthquake hit Mandalay affecting the surrounding communities and our schools. Our teams responded swiftly to ensure both the safety of our communities and the continuity of our services to customers.
Beyond operational resilience, we supported the wider community's recovery efforts through two channels: (i) a donation made via EuroCham Myanmar and (ii) targeted assistance for affected employees and their families through internal fundraising led by the Group's top management. These contributions amounted to a total of $76,000. This response reflects our long-standing commitment to the well-being of our people and the communities we serve.
Words of Appreciation
I would like to express my sincere appreciation to our employees, customers, partners, and shareholders for their unwavering support throughout the year. Their resilience and dedication continue to drive our progress and reinforce our long-term potential across Emerging Asia.
Sincerely, Richard Greer Independent Non-Executive Chairman9 February 2026
Enrico Cesenni, Chief Executive Officer of Asia Strategic, commented:
"FY25 was a year of resilience and unity for the Group. The tragic earthquake in central Myanmar last March affected over two million lives.
"While the impact on the Group's operations was contained, we recognise the broader national impact and our responsibility to support affected communities. In response, we mobilised financial and human resources to assist employees and partnered with organisations delivering on-the-ground relief.
"Despite these challenges, the Group delivered strong results. Revenue surpassed $32 million, up 8% YOY (FY24: $29.7 million), reflecting sustained demand and brand loyalty in Vietnam and Myanmar. Gross profit rose to $18.9 million (FY24: $17.0 million) with margins improving to 59% (FY24: 57%), driven by continued operational efficiencies in education businesses such as larger class sizes from improved scheduling and the introduction of local teachers.
"In line with our commitment to financial discipline, we made the difficult but necessary decision to close two underperforming schools, as well as one school and one hostel affected by the earthquake. This allows us to preserve capital and sharpen our strategic focus.
"We remain committed to long-term value creation and believe strongly in the potential of Emerging Asia. On behalf of the Board, I thank our shareholders for their trust and extend heartfelt appreciation to the Asia Strategic team for their resilience and dedication-especially in the wake of the Mandalay earthquake.
"Together, we are navigating challenges and building enduring value for the communities we serve"
For more information, please visit www.asia-strategic.com or contact:
Asia Strategic Holdings Ltd. Richard Greer, Independent Non-Executive Chairman Enrico Cesenni (OSI), Founder and CEO
| |
Allenby Capital Limited (Broker) Nick Athanas Nick Naylor Lauren Wright
|
+44 (0)20 3328 5656
|
Yellow Jersey PR (Financial PR) Shivantha Thambirajah
| +44 (0) 20 3004 9512
|
Notes to editors
Asia Strategic Holdings Ltd. (LSE: ASIA) is an independent developer and operator of consumer businesses focused on Education and Services in Emerging Asia, specifically Vietnam and Myanmar.
Education Division: The Group operates a diverse portfolio of education brands, encompassing English language learning, coding, K-12 international education, and tertiary education. As of 30 September 2025, the Education division consisted of 35 schools, serving 10,410 students.
Service Division: The Group operates two brands: (i) EXERA, an integrated risk and facilities management services provider in Myanmar and Vietnam, with over 1,900 security officers across 250 sites; and (ii) Ostello Bello, a boutique hostel located in Bagan.
Asia Strategic Holdings utilises an asset-light strategy to scale its operations and capitalises on emerging opportunities in Vietnam and Myanmar.
To receive news alerts on Asia Strategic Holdings please sign up here under the 'RNS' header: https://asia-strategic.com/investor-relations/
OPERATIONAL REVIEW
EDUCATION
The Group's objective for its Education division is to become a leading operator and retailer of tech-enabled education services in Emerging Asia.
Revenue from Education businesses increased 10% YOY to $25.0 million in FY25 (FY24: $22.7 million).
At 30 September 2025, deferred revenue from Education businesses, representing cash received in advance of service delivery, was:
- Current: $14.2 million (30 September 2024: $12.1 million)
- Non-Current: $4.4 million (30 September 2024: $2.0 million)
Within its Education division, the Group provides educational products for children, teens, and adults through five brands across Vietnam and Myanmar.
Franchised Brands
Wall Street English is a leading English language education provider for adults with over 180,000 students enrolled in 29 countries. Its flexible and integrated blended learning solution is offered online or through a hybrid online/in-centre approach.
Kids&Us is a leading English language education provider for children starting at age one and operates in ten countries with over 180,000 students enrolled across 600 schools. Its unique teaching method focuses on natural language acquisition, personalised for each student's age and experiences.
Logiscool is an enrichment programme that teaches children coding and digital literacy. Logiscool operates in 30 countries across more than 360 locations with over 320,000 students enrolled and graduated. Logiscool's unique educational platform is developed so users can easily transition from visual coding to text-based programming languages.
Own Brands
Yangon American offers an international K-12 education, is an authorised International Baccalaureate Primary Years Programme school and an IB Middle Years Programme school, and is a candidate to be accredited as a Western Association of Schools and Colleges ("WASC") school.
Auston is a private higher education provider in Myanmar offering internationally recognised engineering and IT diplomas and degrees through partnerships with the University of Wolverhampton
(since December 2025), the University College Birmingham (since February 2026), Liverpool John Moores University (since February 2020, now in teach-out), and through Pearson Edexcel and BTEC (UK-recognised) certifications obtained in April 2022 and May 2025,, respectively.
While each brand has its own unique characteristics and customer base, economies of scope, experience and scale are achieved through common management. One example is the creation of learning centres where multiple brands occupy the same building or are closely located reducing construction and operating costs, while creating one-stop educational experiences for families.
Vietnam
Revenue from Education businesses in Vietnam decreased 6% YOY to $7.7 million in FY25 (FY24: $8.2 million).
At 30 September 2025, deferred revenue from Education businesses in Vietnam, representing cash received in advance of service delivery, was:
- Current: $3.5 million (30 September 2024: $4.1 million)
- Non-Current: $0.7 million (30 September 2024: $0.7 million)
Wall Street English Vietnam is the largest revenue contributor for Vietnam and the third for the Group and is focused on achieving profitability.
Revenue from Kids&Us Vietnam is expected to continue growing as existing schools mature and new schools open. Students generally sign for longer periods, and a substantial portion of the non-current deferred revenue is attributed to Kids&Us Vietnam.
After facing challenges in the past two years, Logiscool Vietnam is set to rebound in FY26 with a renewed focus on brand repositioning and strategic expansion.
Wall Street English Vietnam
· Revenue from Wall Street English Vietnam decreased 12% YOY to $6.7 million in FY25 (FY24: $7.6 million). The decline is attributable to a reduced number of schools and a lower average revenue per user, driven by a shift in product mix with the lower-priced online delivery.
· Student enrolment declined 4% from 30 September 2024 to circa 3,320 students at 30 September 2025 with the closing of two schools partially offset by an increase in online students.
· A refreshed management team with strengthened commercial, operational, and digital capabilities has been appointed to enhance performance discipline and accelerate the business turnaround.
· Cost reduction measures, including school rightsizing to reduce rental expenses and staff restructuring, have been implemented aggressively to restore profitability.
· Two underperforming legacy schools were closed during FY25, reducing the number of operating schools to seven. At 30 September 2025, Wall Street English Vietnam operated six schools in Ho Chi Minh City and one school in Binh Duong.
Kids&Us Vietnam
Revenue from Kids&Us Vietnam increased 60% YOY to $0.9 million in FY25 (FY24: $0.6 million), reflecting accelerating commercial traction as the brand continues to establish itself in the market.
· Student enrolment grew 47% from 30 September 2024 to circa 1,130 students at 30 September 2025, supported by stronger brand recognition and an improved retention rate.
· As the portfolio matures and with a stable leadership team, the Group refined its site and operating model, prioritising smaller, more efficient spaces and driving improvements in procurement, classroom utilisation, and service-team productivity. These initiatives are enhancing unit economics and strengthening margins across the network.
· At 30 September 2025, Kids&Us Vietnam operated six schools in Ho Chi Minh City, all of which have continued to scale and deepen their market positioning.
Logiscool Vietnam
· Revenue from Logiscool Vietnam was $0.1 million in FY25 (FY24: $23k).
· Student enrolment doubled from 30 September 2024 to circa 160 students as of 30 September 2025. Despite the slow growth, the business holds strong potential for recovery in FY26.
· Logiscool Vietnam opened its third school in Ho Chi Minh City in July 2025 as part of its effort to strengthen brand presence and expand accessibility.
· As of 30 September 2025, Logiscool Vietnam operated three schools, two in Ho Chi Minh City and one in Binh Duong.
Myanmar
Revenue from Education businesses in Myanmar increased 19% YOY to $17.3 million in FY25 (FY24: $14.4 million).
At 30 September 2025, deferred revenue from Education businesses in Myanmar, representing cash received in advance of service delivery, was:
- Current: $10.7 million (30 September 2024: $8.0 million)
- Non-Current: $3.7 million (30 September 2024: $1.3 million)
Wall Street English Myanmar is the largest English language education provider and revenue contributor to the Group.
Kids&Us Myanmar launched in June 2023 and quickly established itself as the market leader.
Logiscool Myanmar launched in November 2023 and mirrored Kids&Us Myanmar's success showcasing the Group's ability to set up market-leading businesses quickly and efficiently in Myanmar.
Auston experienced strong revenue growth among the Group's education businesses in Myanmar over the years. The growth is expected to continue as it is responsible for most of the deferred revenues and sees robust demand for international tertiary education, with a scarcity of quality local options.
Yangon American International School experienced a marginal revenue increase, with student numbers growing organically amid difficult macro and socio-economic conditions. Yangon American has reached circa 190 students.
Wall Street English Myanmar
· Revenue from Wall Street English Myanmar increased 6% YOY to $8.2 million in FY25 (FY24: $7.7 million).
· Student enrolment marginally grew by 1% from 30 September 2024 to circa 3,290 at 30 September 2025, despite the temporary closure of physical schools in Mandalay following the earthquake.
· The price increases helped offset the stagnant student numbers but raised affordability concerns. With an increased mobility of the population, there was a growing demand for convenient online products.
· The team continued to fine-tune its offering to reduce dollar-based costs and offer more competitive pricing:
- Local teachers were incorporated into the service delivery, reducing the reliance on expat teachers.
- Online class scheduling was streamlined, and a local online classroom was established to reduce dependency on international teachers.
· At 30 September 2025, Wall Street English Myanmar operated five schools with four in Yangon and one in Mandalay. One of the schools in Mandalay was closed in the aftermath of the devastating earthquake in March 2025.
Kids&Us Myanmar
· Revenue from Kids&Us Myanmar doubled YOY to $0.9 million in FY25 (FY24: $0.4 million).
· Student enrolment grew 27% from 30 September 2024 to circa 610 at 30 September 2025. The business is yet to reach its full potential, slowed by lower than expected retention rates.
· Kids&Us Myanmar remains the premium operator in the market with strong brand positioning. Supported by a shared and experienced leadership team with Kids&Us Vietnam. Financial and operational performance remain on track. The business is well-positioned for continued growth, with ample opportunities in Yangon and Mandalay.
· Kids&Us Myanmar opened its fourth school in central Yangon in July 2025, sharing facilities with both Logiscool and Yangon American.
· As of 30 September 2025, Kids&Us Myanmar operated four schools in Yangon.
Logiscool Myanmar
· Revenue from Logiscool Myanmar increased almost sevenfold to $1.0 million in FY25 (FY24: $0.1 million) .
· Student enrolment grew 166% from 30 September 2024 to circa 850 at 30 September 2025 and exceeded expectations in both Yangon and Mandalay.
· Similar to Kids&Us Myanmar, Logiscool Myanmar leveraged an experienced commercial team and introduced a new product into a market with limited competition. Its cloud-based, low-cost model supports healthy margins and strong operating leverage, offering promising economics as it expands in Myanmar.
· Logiscool Myanmar opened its first school in Mandalay (fourth overall) in December 2024, fifth and sixth schools (countrywide) in Yangon in May 2025 and July 2025, respectively. The sixth school shares facilities with Kids&Us and Yangon American.
· At 30 September 2025, Logiscool Myanmar operated five schools in Yangon and one in Mandalay.
Yangon American International School
· Revenue from Yangon American International School increased 46% YOY to $1.8 million in FY25 (FY24: $1.2 million). Growth was primarily supported by net new student additions throughout the year, with about 30 additional students in the academic year ("AY") 2024-25 and a further 20 in AY 2025-26, along with an increase in the average tuition fee paid.
· Student enrolment grew 27% from 30 September 2024 to circa 190 at 30 September 2025. In August 2025, the school opened ninth grade, and it plans to add a new grade annually until it reaches the twelfth grade.
· Yangon American has established itself as the leading International Baccalaureate school in the market, with Primary Years Programme and Middle Years Programme authorisations. It is also a candidate for the Western Association of Schools and Colleges accreditation.
· A key highlight during FY25 was the confirmation of a new site in central Yangon, featuring pre-existing facilities available for Yangon American's planned Secondary Campus, set to open in early 2026 pending final regulatory approvals. The central location near embassies, UN agencies, and city landmarks enhances accessibility and safety, reinforces Yangon American's premium positioning, and supports community trust. The move will also ease pressure on the current Elementary Campus, enabling the launch of additional classes in some grades as well as the creation of dedicated learning hubs and specialised support rooms to enrich the learning environment.
· At 30 September 2025, Yangon American operated an Early Years Village and a separate Elementary Campus in Yangon. The Secondary Campus is scheduled to open in January 2026.
Auston
· Revenue from Auston increased 10% YOY to $5.4 million in FY25 (FY24: $4.9 million). The progression of students to bachelor's degree programs drove revenue growth, while the acquisition of new students was subdued as a result of various external factors.
· Student enrolment grew 5% from 30 September 2024 to circa 860 at 30 September 2025. The slow growth is attributable to slow sales from the extended closure of the Mandalay campus after the earthquake in March 2025. Increased migration driven by conflict, the earthquake, and conscription fears, added significant complexity and impacted the overall commercial performance.
· The Group responded by strengthening its management team with experienced leadership and Auston managed to navigate the disruptive and challenging period with limited impact.
· Auston has signed an academic partnership agreements with the University of Wolverhampton in December 2025 and University College Birmingham in February 2026 and obtained Pearson BTEC certification in May 2025, ensuring continuity and a path for Auston's students. Auston is exploring further collaboration opportunities with reputable institutions across the world to expand its product offering horizontally (across disciplines) and vertically (post-graduate programs).
· At 30 September 2025, Auston operated campuses in Mandalay and Yangon, with plans to expand usable space and enhance facilities in Yangon over the next two years.
SERVICES
The Group's objective is to leverage our security expertise and facility management services to become the trusted regional partner for corporates.
Revenue from Services businesses increased 2%YOY to $7.1 million in FY25 (FY24: $7.0 million).
At 30 September 2025, deferred revenue from Services businesses, representing cash received in advance of service delivery, was:
- Current: $0.3 million (30 September 2024: $0.3 million)
- Non-Current: nil (30 September 2024: nil)
Within its Services division, the Group operates two brands across Myanmar and Vietnam:
EXERA is the leading provider of risk management, consulting, integrated security, manned guarding, secure logistics, facility management, and cash-in-transit services in Myanmar. It serves a wide range of international and local clients across Myanmar and holds ISO 18788, ISO 9001, ANSI/ASIS PSC.1 certifications, and ICoCA membership. In Vietnam, it is a start-up focused on integrated facility management services.
Ostello Bello is a boutique hostel brand known for its vibrant social atmosphere and exceptional hospitality. Ostello Bello operates in some of the most popular tourist destinations across Italy and Myanmar.
Vietnam
EXERA Vietnam
· EXERA Vietnam was launched in FY24 to provide integrated facility management services and generated $61k revenue in FY25 from its first few customers. However, the business has been slow to scale, and the Group is exploring strategic partnerships to increase market penetration.
Myanmar
EXERA Myanmar
Revenue from EXERA Myanmar increased 1% YOY to $7.1 million in FY25 (FY24: $7.0 million).
· Market dynamics have shifted as EXERA secures more local corporate clients. With customers increasingly seeking cost savings, repricing has proven more challenging than expected. Nevertheless, EXERA Myanmar has retained key large clients and achieved growth through increased sales of risk reporting packages.
· EXERA employed over 1,900 security officers as of 30 September 2025 (30 September 2024: circa 1,710) across circa 250 sites (30 September 2024: circa 230 sites) in Myanmar.
Ostello Bello
· Ostello Bello, a managed business in the Services division, operates one boutique hostel in Bagan, Myanmar, with circa 40 beds and circa 12 rooms. No revenue was generated in relation to hostel-related services in FY25 (FY24: $10k).
· The devastating earthquake in Mandalay forced the Group to make the difficult decision to close the Mandalay hostel, which had previously served as both a hub for local tourists and an internal coordination centre for our operations in the region for ten years.
FINANCIAL REVIEW
RESULTS OF OPERATIONS
Revenue grew 8% YOY to $32.1 million in FY25 (FY24: $29.7 million). The revenue growth was a result of robust expansion in Myanmar across the Education businesses (FY25: 19% YOY) and Services businesses (FY25: 1% YOY). Revenues decreased in Vietnam's Education businesses (FY25: -6% YOY) as the drop at Wall Street English Vietnam was not fully covered by the growth at Kids&Us Vietnam, Logiscool Vietnam, and EXERA Vietnam.
$ | FY25 | FY24 | FY23 |
Education - Vietnam | 7,720,079 | 8,229,656 | 8,539,813 |
Wall Street English | 6,686,568 | 7,631,372 | 8,254,131 |
Kids&Us | 923,229 | 575,519 | 285,682 |
Logiscool | 110,282 | 22,765 | − |
Education - Myanmar | 17,250,190 | 14,441,789 | 10,162,576 |
Wall Street English | 8,198,732 | 7,744,204 | 6,860,636 |
Kids&Us | 854,603 | 416,064 | 24,632 |
Logiscool | 1,003,583 | 148,726 | − |
Yangon American | 1,795,032 | 1,230,966 | 887,196 |
Auston | 5,398,240 | 4,901,829 | 2,390,112 |
Education | 24,970,269 | 22,671,445 | 18,702,389 |
Services | |||
EXERA | 60,787 | 3,576 | - |
EXERA | 7,071,011 | 6,988,643 | 5,327,189 |
Ostello Bello | - | 10,351 | - |
Services | 7,131,798 | 7,002,570 | 5,327,189 |
Total | 32,102,067 | 29,674,015 | 24,029,578 |
|
|
All Education businesses, except Wall Street English Vietnam, recorded strong revenue growth. Auston is quickly becoming a key contributor to Group revenue. Investments in Yangon American, as well as Kids&Us and Logiscool, will drive more meaningful growth in the years ahead.
The Services division saw modest growth as the Myanmar business strengthened its commercial position and expanded its high-value service offerings. EXERA Vietnam has begun to generate income in FY25 and is exploring strategic partnerships to scale. The Group is evaluating strategic partnership opportunities to strengthen and scale the business, particularly in Vietnam.
Group gross profit rose 11% YOY to $18.9 million in FY25 (FY24: $17.0 million), with the Education division contributing 94% (FY24: 91%) and the Services division 6% (FY24: 9%). An improvement in the Education division gross margin at 71% (FY24: 68%) was offset by a deterioration in the Services division gross margin at 16% (FY24: 23%).
The Group's net loss narrowed to $6.3 million in FY25 (FY24: $11.0 million), reflecting the absence of the one-time $4.6 million goodwill impairment at Wall Street English Vietnam recorded in FY24. The main cause of the losses in FY25 was a foreign exchange loss of $2.8 million, due to heightened currency volatility in key markets, and a plant and equipment write-off of $0.5 million, due to earthquake damage. Despite this, operating expenses were effectively controlled, increasing only 1% YOY, underscoring management's disciplined cost management as new businesses scale and mature operations become more efficient.
$ | FY25 | FY24 | FY23 |
Revenue | 32,102,067 | 29,674,015 | 24,054,547 |
Cost of services | (13,207,615) | (12,689,487) | (10,184,215) |
Gross profit | 18,894,452 | 16,984,528 | 13,870,332 |
Gross profit margin | 59% | 57% | 58% |
| |||
Other income | 57,951 | 16,495 | 90,018 |
Foreign exchange loss | (2,794,062) | (1,455,135) | (1,134,441) |
Impairment loss on intangible assets | − | (4,561,645) | − |
Plant and equipment write-off | (522,237) | − | − |
Administrative and other operating expenses | (20,499,650) | (20,350,864) | (17,098,388) |
Loss from operations | (4,863,546) | (9,366,621) | (4,272,479) |
Finance cost | (1,493,155) | (1,341,391) | (979,791) |
Loss before income tax | (6,356,701) | (10,708,012) | (5,252,270) |
Income tax credit/(expense) | 79,821 | (245,674) | (67,414) |
Loss after income tax | (6,276,880) | (10,953,686) | (5,319,684) |
Selected non-cash items: | |||
Total depreciation of plant and equipment | 1,301,998 | 1,207,028 | 826,953 |
Total amortisation on of right-of-use asset | 2,683,325 | 2,786,093 | 2,858,275 |
Total amortisation on of intangible assets | 102,741 | 100,718 | 80,498 |
Impairment on/(reversal of) trade and other receivables |
3,008 |
− |
(9,514) |
Impairment loss on intangible assets | − | 4,561,645 | − |
Plant and equipment writte-off | 522,237 | − | − |
Finance costs (excluding interest on lease liabilities) |
224,802 |
220,416 |
105,748 |
Total interest on lease liabilities | 1,268,353 | 1,120,975 | 875,405 |
6,106,464 | 9,996,875 | 4,737,365 | |
Adjusted EBITDA1 | (250,237) | (711,137) | (514,905) |
|
|
| |
Adjusted EBITDA after impact of ROUs * | (4,201,915) | (4,618,205) | (4,248,585) |
|
1Key performance indicators for the Group, based on earnings before interest, income tax, depreciation and amortisation ("EBITDA"), are (i) Adjusted EBITDA (as presented above) and (ii) Adjusted EBITDA less amortisation of right-of-use assets and interest on lease liabilities ("Adjusted EBITDA after impact of ROUs").
Group adjusted EBITDA (excluding impairment losses and interest on lease liabilities) loss amounted to $0.3 million in FY25 (FY24: $0.7 million loss). Narrowing losses at Wall Street English Vietnam and the growth of start-up businesses were partly offset by higher foreign exchange losses. Marketing expenses decreased $0.4 million YOY to $3.1 million in FY25, reflecting improved spending efficiency amid stronger sales activity. Overall, underlying operational performance strengthened as cost control measures and improved performance at start-up businesses took effect.
Employees increased to circa 2,780 at 30 September 2025 (30 September 2024: circa 2,600). The increase in headcount is directly linked to the school portfolio expansion in both countries and the acquisition of additional sites under EXERA Myanmar.
CASH FLOW EVOLUTION
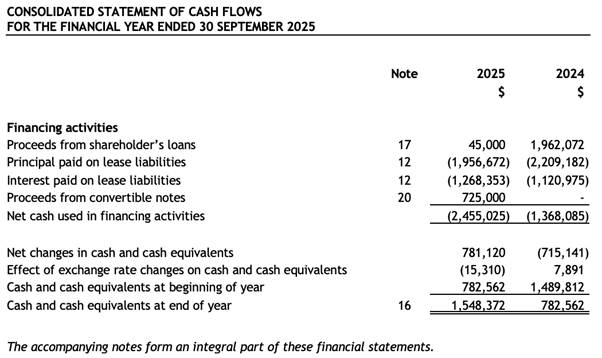
At 30 September 2025, the Group's cash and cash equivalents position was $1.5 million (30 September 2024: $0.8 million). The positive change resulted from the combination of (i) a $3.9 million inflow from operating activities, (ii) a $0.7 million outflow from investing activities, and (iii) a $2.5 million outflow from financing activities.
The Group generated cash inflow from operating activities of $3.9 million in FY25 (FY24: inflow $3.9 million). Operating cash flow before working capital changes in FY25 was $0.2 million (FY24: negative $0.5 million). If repayment of lease liabilities of $3.2 million (FY24: $3.3 million) were considered, adjusted cash inflow from operating activities would have been positive $0.7 million (FY24: positive $0.6 million).
The Group incurred cash outflow from investing activities of $0.7 million in FY25 (FY24: outflow $3.3 million), of which $0.7 million (FY24: $2.5 million) was spent on leasehold improvements for the opening of (i) one school in Vietnam (Logiscool), (ii) four schools in Myanmar (Kids & Us / Logiscool), and (iii) the Auston campus expansion.
Cash outflow from financing amounted to $2.5 million in FY25 (FY24: outflow $1.4 million), of which repayment of lease liabilities totalled $3.2 million (FY24: $3.3 million). Cash inflow from financing, before repayment of lease liabilities, was $0.8 million in FY25 (FY24: inflow $2.0 million), which comprised of proceeds from a shareholder's loan of $45k (FY24: $2.0 million) and convertible notes of $0.7 million (FY24: nil). The finances were utilised primarily to open new schools and support the operating losses for the expansion of selected new ventures (Kids&Us, EXERA VN and Logiscool VN).
DIVIDENDS
The Board of Directors does not recommend paying dividends for FY25 as the Group needs to conserve cash for working capital and future expansion.
LIQUIDITY MANAGEMENT AND GOING CONCERN
The Board of Directors have carried out a detailed review of the Group's cash flow forecast for twenty -four months from 30 September 2025 and specifically considered a going concern review period of 12 months from the date of this report. This forecast considered the time needed for new and non-performing businesses to turn profitable. The Group conducted extensive stress testing on various scenarios calibrating the duration it might take for these businesses to improve as well as other items impacting future performance, such as the general macroeconomic environment and initiatives within the management's control.
The Board of Directors determined management has control over sufficient mitigating actions to manage cash outflow, such as prioritising capital expenditures, reducing operational activities of non−performing business divisions and pausing discretionary spending. Other key considerations included:
a) The Group meticulously plans its business expansion and continuously monitors how changes to the political and economic environment may potentially impact its business operations, particularly in Myanmar. Since FY23, the overall Myanmar businesses have been self-sustaining requiring no financial support;
b) Negative cash conversion cycle for many businesses as tuition fees and certain risk management services are generally collected up to twelve months in advance of service delivery. Refer to Note 4 of the financial statements for further details;
c) Support by franchise partners through flexible payment plans in relation to franchise fees and didactic materials;
d) Flexible discretionary capital spending as any capital expenditures in Myanmar would be funded through excess capital earned locally; and
e) Access to the unutilised Loan Facility as disclosed in Note 17 of the financial statements.
Established businesses within the Education and Services divisions in Myanmar generate sufficient cash flow to support the existing operations and their expansion. Management expects this trend to continue for the foreseeable future.
In Vietnam, the macroeconomic outlook has continued to improve in 2025 and we anticipate further growth from businesses as new schools continue to open and new brands gain traction.
Therefore, at the date of this report, the Directors have concluded that the Group has adequate financial resources to cover its working capital needs for at least the next twelve months.
OUTLOOK
Asia Strategic Holdings is steadfast in leveraging its integrated operating model and in-house shared service functions to deliver sustainable returns to shareholders. Significant financial and human capital investments over the past years have established a competitive portfolio of businesses. This portfolio balances mature, profitable anchors with greenfield projects poised to drive the next phase of growth.
Capital Allocation and Strategic Focus
The Group employs a disciplined capital allocation strategy to support its long-term vision:
· Portfolio and balance sheet strength: balancing time and resources in the organic growth of existing brands to drive sustainable expansion while maintaining a resilient financial position.
· Geographic and sectoral expansion: leveraging shared service functions and a regional management approach to unlock synergies, particularly in new markets.
· Investment prioritisation: minimal and prudent capital expenditures focused on utilising existing locations and adopting a strategic real estate framework to enable brands to achieve their potential.
Continued Development of Existing Brands
Partnerships with international market leaders, such as Kids&Us, Logiscool and Wall Street English, provide a strong foundation for organic revenue growth. Turning around Wall Street English Vietnam remains a top priority, with efforts focused on operational maturity to deliver meaningful cash flow contributions and support future expansion.
The Group is also actively enhancing the programmes at Auston and Yangon American, ensuring students benefit from best-in-class education that equips them for academic and professional success. These improvements aim to strengthen the institutions' competitive edge and reinforce their reputations as leading providers of high-quality education.
Navigating Macroeconomic Conditions and Demographic Shifts
The Group expects a less volatile macroeconomic environment, supported by more stable foreign exchange rates, broader economic growth, and favourable demographic trends such as growing middle classes and young, urbanising populations. Rising foreign direct investment and the region's emergence as a tech hub are driving demand for education, skilled labour, and services. These dynamics align with the Group's strategy to address skills gaps through tech-enabled education and complementary offerings while positioning itself as a key regional partner to corporates, and organisations.
Commitment to Strategic Growth
Asia Strategic Holdings remains committed to expanding its footprint in emerging markets through targeted investments that align with its core strategy. While focusing on current operations, the Group will evaluate new opportunities, particularly those in high-impact sectors such as education, which complement its existing businesses and align with regional development trends.
With an eye on long-term opportunities and a prudent approach to immediate challenges, the Group is well-positioned to navigate the year ahead with resilience, delivering value for shareholders while supporting sustainable economic and social development in the markets it serves.
 NOTES TO THE FINANCIAL STATEMENTS
FOR THE FINANCIAL YEAR ENDED 30 SEPTEMBER 2025
These notes form an integral part of and should be read in conjunction with the accompanying financial statements.
1. General
Asia Strategic Holdings Limited (the "Company" or "Asia Strategic") (Registration Number 201302159D), is a public company limited by shares incorporated and domiciled in Singapore with its principal place of business and registered office at 80 Raffles Place #32-01, UOB Plaza, Singapore 048624. The Company was listed on the Main Market of London Stock Exchange on 22 August 2017.
The principal activities of the Company are management services to its subsidiaries followed by developing, managing, operating and investing in businesses across Emerging Asia. The principal activities of the subsidiaries are set out in Note 13 to the financial statements. Related companies in these financial statements refer to members of the Group.
2. Material accounting policies
2.1 Basis of preparation
The financial statements have been prepared in accordance with International Financial Reporting Standards ("IFRSs") as adopted by the European Union and are prepared under the historical cost convention, except as disclosed in the accounting policies below.
The individual financial statements of each Group entity are measured and presented in the currency of the primary economic environment in which the entity operates (its functional currency). The consolidated financial statements of the Group are presented in United States Dollar ("$") which is the functional currency of the Company and the presentation currency for the consolidated financial statements.
The preparation of financial statements in compliance with IFRS requires management to make judgements, estimates and assumptions that affect the Group's application of accounting policies and reported amounts of assets, liabilities, revenue and expenses. Although these estimates are based on management's best knowledge of current events and actions, actual results may differ from those estimates. The areas where such judgements or estimates have significant effect on the financial statements are disclosed in Note 3 to the financial statements.
Myanmar political and economic situation
The business environment in major cities where the Group operates such as Yangon and Mandalay remain active yet challenging due to (i) the recent earthquake in Mandalay (ii) frequent power and telecommunication outages, (iii) trade restrictions at the border, resulting in inflationary pressure, and (iv) security risks. The political and economic situation evolves daily and is expected to improve after the upcoming elections.
Impact of the Myanmar earthquake and business continuity
On 28 March 2025, a 7.7 magnitude earthquake struck central Myanmar, prompting the National Disaster Management Committee to declare a State of Emergency across the affected regions, including Sagaing, Mandalay, Magway, Bago, and northeastern Shan State. The earthquake caused widespread disruption to electricity, internet connectivity, water supply and sanitization services. In response, several countries, including China, India, the United States and various ASEAN and European nations, have extended financial aid and humanitarian relief.
Myanmar has now transitioned into the recovery phase. However, many families remain displaced in temporary shelters or rental housing due to structural damage and safety concerns. The humanitarian response remains ongoing, with coordinated efforts from national authorities, UN agencies, and international NGOs focused on shelter, health, food security, and infrastructure rehabilitation. Long-term recovery planning is underway, though sustainable housing solutions and economic revitalisation remain key challenges.
While the earthquake had a negligible impact on the Group's corporate offices and operations in Yangon, the premises of Wall Street English, Logiscool, Auston, and Ostello Bello in Mandalay were significantly affected and were closed from April 2025 until November 2025. No casualties or serious injuries were reported as a result of the damage to our schools, hostel, and offices.
Prior to the resumption of physical classes, English language programs, coding courses, and university lectures were fully delivered online, minimising operational disruption. For affected students without internet and/or electricity access, the Group implemented support measures such as study breaks and course extensions. In July, Auston resumed university lectures in a temporary campus.
While the buildings were structurally safe, extensive repairs and refurbishments were required. Significant judgements were made on the impact assessment, resulting in the write-off of the carrying amounts of non-movable items such as leasehold improvements and furniture & fittings for these sites, totaling $522,237 (Note 10).
In November 2025, Wall Street English, Logiscool and Auston's existing sites in Mandalay were refurbished and re-opened. On the other hand, Management decided to discontinue operations at the managed hostel, coinciding with the expiration of the ten-year operation and management agreement.
Despite a challenging macroeconomic environment, demand for quality education remained resilient, underscoring the essential role our education division play in communities with limited alternatives. Our Group's Services division demonstrated its critical importance during the recent earthquake, providing vital support in emergency response operations and safeguarding embassies, client facilities, and key infrastructure. The Group continuously monitors and applies appropriate mitigating actions to ensure the operations in Myanmar remain flexible and adaptable to the market environment.
As part of the Group's risk management protocols, cash balances in Myanmar are limited to the minimum required to maintain operations. While the Group remains focused on expanding its current operations in Vietnam, the contribution from both markets remains an important diversification strategy to mitigate the overall geographical risk exposure of the Group.
Other than as disclosed above, the Group has considered the current market environment in the respective countries in which it operates as at the reporting date and notes that there are no indicators that warrant material adjustments to the key estimates and judgements on the recoverability of any assets. The significant estimates and judgements applied are as disclosed in Note 3 to the financial statements.
Going concern assumption
Including the one-off plant and equipment write-off of $522,237 (Note 2.1), the Group recorded loss for the year of $6,276,880. As at reporting date, the Group's current liabilities and total liabilities exceeded its current assets and total assets by $20,726,995 and $20,538,691 respectively. Net current liabilities, excluding contract liabilities (non-cash item) amounted to $6,246,117.
The Board of Directors have carried out a detailed review of the Group's cash flow forecast for twenty-four months from the financial year ended 30 September 2025 and specifically considered a going concern review period of 12 months from the date of this report.
The cash flow forecast has been prepared and stress-tested taking into consideration the timing of capital expenditures, the general political and macroeconomic environment and other information available at the end of the reporting period. The Directors have evaluated that there are sufficient mitigating actions within their control, such as further optimising the Group's operations, adjustments to operating expenses, and prioritising Group's capital expenditures focusing on multi brand sites driving operational efficiency and synergies.
Other key considerations in the assessment include, among others:
a) The Group develops a detailed business expansion plan and continuously monitors environmental changes that may impact its business operations, particularly in Myanmar. For the past few years, the Myanmar-based businesses have been self-sustainable;
b) The Group has access to $818,000 in unutilised loan facility as disclosed in Note 17 to the financial statements;
c) Tuition fees and certain security services are generally collected up to twelve months in advance of performance with reference to the terms of the contracts. Refer to Note 4 for further details;
d) The Group's net cash generated from operating activities amounted to $712,000 (net of repayments of principal and interest on lease liabilities) during the current financial year;
e) In support of the Group's expansion strategy, the Group entered into a payment plan with a key vendor, subsequent to the financial year end. As at 30 September 2025, the outstanding balances owed to the vendor was $2,334,000. Interest at 4% per annum accrues daily, on any outstanding balances from 1 October 2025. The arrangement matures at 30 September 2027, at which point the Group may settle the obligation or, subject to mutual agreement, further extend the repayment terms; and
f) Control over the timing and size of capital expenditures as all expansionary expenditures are discretionary in nature. Any capital expenditures in Myanmar would be funded by excess capital available locally, if any.
The Directors have assessed the Group's cash flows, forecasts, planned investments, cash resources, and loan facilities, and are satisfied that sufficient resources exist to continue operations for the foreseeable future. No material uncertainties have been identified that may cast significant doubt on the Group's ability to continue as a going concern. Therefore, the financial statements have been prepared on a going concern basis.
Changes in accounting policies
New standards, amendments and interpretations effective from 1 October 2024
On 1 October 2024, the Group adopted the new or amended IFRS and interpretations to IFRS that are mandatory for application for the financial year. The adoption of these standards did not result in significant changes to the Group's accounting policies and had no material impact to the Group's financial statements.
IFRSs issued but not yet effective
At the date of authorisation of these financial statements, the following IFRSs were issued, but not yet effective, and have not been early adopted in these financial statements:
| Standard or interpretation | Description | Effective date (annual periods beginning on or after) |
| IAS 21 (Amendments) | : Lack of Exchangeability | 1 January 2025 |
| IFRS 7, 9 (Amendments) | : Amendments to the Classification and Measurement of Financial Instruments | 1 January 2026 |
| IFRS 7, 9 (Amendments) | : Contracts Referencing Nature-dependent Electricity | 1 January 2026 |
| IFRS 19 (Amendments) | : Subsidiaries without Public Accountability: Disclosures | 1 January 2027 |
| IFRS 18 | : Presentation and Disclosure in Financial Statements | 1 January 2027 |
Consequential amendments were also made to various standards as a result of these new or revised standards.
Except as disclosed below, the Group anticipates that the adoption of the above standards if applicable, will have no material impact on the financial statements of the Group in the period of their adoption.
IFRS 18 Presentation and Disclosure in Financial Statements
IFRS 18 replaces IFRS 1 Presentation of Financial Statements and provides guidance on presentation and disclosure in financial statements, focusing on the statement of profit or loss.
IFRS 18 introduces:
· New structure on statement of profit or loss with defined sub-totals;
· Disclosure related to management-defined performance measures ("MPMs"), which are measures of financial performance based on a total or sub-total required by accounting standards with adjustments made (e.g. 'adjusted profit or loss'). A reconciliation of MPMs to the nearest total or sub-total calculated in accordance with accounting standards; and
· Enhanced principles on aggregation and disaggregation of financial information which apply to the primary financial statements and notes in general.
IFRS 18 will take effect on 1 January 2027 and management anticipates that the new requirements will change the current presentation and disclosure in the financial statements. An impact assessment regarding the adoption of IFRS 18 is still underway and has not yet been completed.
IFRSs issued but not yet effective
Amendments to IAS 21: Lack of Exchangeability
IAS 21 has been amended to specify how to assess whether a currency is exchangeable and how to determine a spot exchange rate if it is not exchangeable. IAS 21 applies to annual reporting periods beginning on or after 1 January 2025.
The amendments require all entities to disclose information to help users understand the impact of a non-exchangeable currency on the entity's financial position, financial performance, and cash flows. The disclosures should include the nature and financial effects of the exchangeability issue, the spot exchange rate(s) used, and any estimation techniques and inputs used. Additionally, entities must provide qualitative information about the risks associated with the non-exchangeable currency and nature and carrying amount of assets and liabilities exposed to these risks.
In April 2022, the Central Bank of Myanmar ("CBM") implemented foreign exchange control measures requiring all foreign currency receipts from April 2022 to be converted to Myanmar Kyat ("Kyat" or "MMK"), restricting conversion of foreign currencies and limiting offshore remittances. The convertibility and the quantum cannot be determined with certainty as it is at the discretion of the Foreign Exchange Supervisory Committee and the Central Bank of Myanmar's approval, subject to quotas and priority to purchase USD given to certain industries. The foreign exchange regulations in Myanmar remain fluid and subject to unpredictable changes. There is a lack of exchangeability of MMK to USD within a reasonable time frame. The Group continuously monitors announcements by the CBM to manage its currency exposures proactively.
The Group has significant operations in Myanmar and the functional currency of certain subsidiaries are in Myanmar Kyats. The financial statements of these subsidiaries are consolidated in the financial statements of the Group which are presented in United States dollars.Upon initial adoption, the Group expects to recognise the cumulative effect as an adjustment to the opening balance of retained earnings and foreign exchange reserve in the consolidated financial statements at the date of initial application.
The Group is currently assessing the impact of adoption of amendments to IAS 21, which has not been finalised.
2.2 Basis of consolidation
The consolidated financial statements incorporate the financial statements of the Company and its subsidiaries. Subsidiaries are entities over which the Group has control. The Group controls an investee if the Group has power over the investee, exposure to variable returns from its involvement with the investee, and the ability to use its power to affect those variable returns. When elements of control change due to facts and circumstances, a reassessment of control is required.
Subsidiaries are consolidated from the date on which control commences until the date on which control ceases.
All intra-group balances and transactions and any unrealised income and expenses arising from intra-group transactions are eliminated upon consolidation. Unrealised losses are also eliminated unless the transaction provides an impairment indicator of the transferred asset.
The financial statements of the subsidiaries are prepared for the same reporting period as that of the Company, using consistent accounting policies. Where necessary, accounting policies of subsidiaries are changed to ensure consistency with the policies adopted by the Group.
2.3 Business combinations
The acquisition of subsidiaries is accounted for using the acquisition method. The consideration transferred for the acquisition is measured at the aggregate of the fair values, at the date of exchange, of assets given, liabilities incurred or assumed, and equity instruments issued by the Group in exchange for control of the acquiree. Acquisition-related costs are recognised in profit or loss as incurred. Consideration transferred also includes any contingent consideration measured at the fair value at the acquisition date. Subsequent changes in fair value of contingent consideration which is deemed to be an asset or liability, will be recognised in profit or loss. The acquiree's identifiable assets, liabilities and contingent liabilities that meet the conditions for recognition under IFRS 3 are recognised at their fair values at the acquisition date.
Where a business combination is achieved in stages, the Group's previously held interests in the acquired entity are remeasured to fair value at the acquisition date (i.e., the date the Group attains control) and the resulting gain or loss, if any, is recognised in profit or loss. Amounts arising from interests in the acquiree prior to the acquisition date that have previously been recognised in other comprehensive income are reclassified to profit or loss, where such treatment would be appropriate if that interest were disposed of.
Goodwill arising from an acquisition is recognised as an asset at the acquisition date and initially measured at the excess of the sum of the consideration transferred, the amount of any non-controlling interest in the acquiree and the fair value of the acquirer's previously held equity interest (if any) in the entity over net acquisition-date fair value amounts of the identifiable assets acquired and the liabilities and contingent liabilities assumed.
Goodwill on acquisition of a subsidiary is recognised separately as an intangible asset. Goodwill is initially recognised at cost and subsequently measured at cost less any accumulated impairment losses.
2.4 Revenue recognition
Revenue is recognised when a performance obligation is satisfied. Revenue is measured based on the consideration of which the Group expects to be entitled in exchange for transferring promised good or services to a customer, excluding amounts collected on behalf of third parties (i.e., sales-related taxes). The consideration promised in the contracts with customers are derived from fixed price contracts.
Contract liabilities are deferred revenue comprising tuition fees and other advance consideration received from customers. Deferred revenue is recognised as revenue when performance obligations under its contracts are satisfied.
Tuition fees
Tuition fees are earned from the provision of educational and enrichment programs across the Group's educational businesses, either in person or online. Tuition fees are recognised over the duration of the course and when services are rendered with reference to the terms of the contract on a straight-line basis over the term of the courses. Sale of merchandise and ancillary fees are either recognised at the point in time when goods are delivered or over time on a straight-line basis according to the delivery of the performance obligations.
Services
The Group provides a broad range of security, risk management, facility management and training services to customers over a specified contract period. The performance obligation is satisfied over time as the customer simultaneously receives and consumes the benefits of the services. As the Group's efforts or inputs are expended throughout the performance period, revenue is recognised on a straight-line basis over the specified contract period.
For certain contracts where the Group supplies security equipment and provides ad-hoc services such as journey management and cash in transit, revenue is recognised at the point in time when goods and services are delivered.
2.5 Employee benefits
Statutory contributions
Statutory contributions include defined contribution plans and social benefits as regulated by the countries where the Group operates. These statutory contributions are charged as an expense in the period in which the related service is performed. Defined contribution plans are post-employment benefit plans under which the Group pays fixed contributions into state-managed retirement benefit schemes and has no legal and constructive obligation to pay further once the payments are made.
2.6 Share-based payments
The Group issues equity-settled share-based payments to certain employees.
Equity-settled share-based payments are measured at fair value of the equity instruments (excluding the effect of non-market-based vesting conditions) at the date of grant. The fair value determined at the grant date of the equity-settled share-based payments is expensed on a straight-line basis over the vesting period with a corresponding credit to the share-based payment reserve, based on the Group's estimate of the number of equity instruments that will eventually vest and adjust for the effect of non-market-based vesting conditions. At the end of each financial period, the Group revises the estimate of the number of equity instruments expected to vest. The impact of the revision to the original estimates, if any, is recognised in profit or loss over the remaining vesting period with a corresponding adjustment to the share-based payment reserve.
Fair value of the share options is measured using the Black-Scholes pricing model. The expected life used in the model has been adjusted, based on management's best estimate, for the effects of non-transferability, exercise restrictions and behavioural considerations.
For cash-settled share-based payments, a liability and a corresponding expense equal to the portion of the goods or services received is recognised at the current fair value determined at the end of each financial year, with movements recognised in the profit or loss.
2.7 Taxes
Income tax expense is comprised current tax expense and deferred tax expense.
Current income tax
Current income tax expense is the amount of income tax payable with respect to the taxable profit for a period. Current income tax liabilities for the current and prior periods shall be measured at the amount expected to be paid to the taxation authorities, using the tax rates and tax laws in the countries where the Group operates, that have been enacted or substantively enacted by the end of the financial year. Management evaluates its income tax provisions on a periodic basis.
Current income tax expenses are recognised in profit or loss, except to the extent that the tax relates to items recognised outside profit or loss, either in other comprehensive income or directly in equity.
Deferred tax
Deferred tax is recognised on all temporary differences between the carrying amounts of assets and liabilities in the financial statements and the corresponding tax bases of assets and liabilities, except when the temporary difference arises from the initial recognition of goodwill or other assets and liabilities that is not a business combination and affects neither the accounting profit nor taxable profit.
Deferred tax liabilities are recognised for all taxable temporary differences associated with investments in subsidiaries, except where the Group can control the timing of the reversal of the temporary difference and it is probable that the temporary difference will not reverse in the foreseeable future. Deferred tax assets are recognised for all deductible temporary differences to the extent that it is probable that taxable profit will be available against which the temporary difference can be utilised.
Deferred tax (Continued)
The carrying amount of deferred tax assets is reviewed at the end of each financial year and reduced to the extent that it is no longer probable that sufficient taxable profits will be available to allow all or part of the deferred tax asset to be utilised.
Deferred tax assets and liabilities are measured using the tax rates expected to apply for the period when the asset is realised or the liability is settled, based on tax rates and tax law that have been enacted or substantially enacted by the end of the financial year. The measurement of deferred tax reflects the tax consequences that would follow from the way the Group expects to recover or settle its assets and liabilities.
Deferred tax assets and liabilities are offset when there is a legally enforceable right to set off current tax assets against current tax liabilities, when they relate to income taxes levied by the same taxation authority and the Group intends to settle its current tax assets and liabilities on a net basis.
Deferred tax is recognised in profit or loss, except when it relates to items recognised outside profit or loss, in which case the tax is also recognised either in other comprehensive income or directly in equity, or where it arises from the initial accounting for a business combination. Deferred tax arising from a business combination, is considered when calculating goodwill on acquisitions.
Sales tax
Revenue, expenses and assets are recognised net of the amount of sales tax except:
· when the sales tax that is incurred on purchase of assets or services is not recoverable from the taxation authorities, in which case the sales tax is recognised as part of cost of acquisition of the asset or as part of the expense item as applicable; and
· receivables and payables that are stated with the amount of sales tax included.
The net amount of sales tax recoverable from, or payable to, the taxation authority is included as part of receivables or payables in the statement of financial position.
2.8 Foreign currency transactions and translation
In preparing the financial statements of the individual entities, transactions in currencies other than the entity's functional currency ("foreign currencies") are recorded at the rate of exchange prevailing on the date of the transaction. At the end of each financial year, monetary items denominated in foreign currencies are retranslated at the rates prevailing as of the end of the financial year. Non-monetary items carried at fair value that are denominated in foreign currencies are retranslated at the rates prevailing on the date when the fair value was determined. Non-monetary items that are measured in terms of historical cost in a foreign currency are not retranslated.
Exchange differences arising on the settlement and retranslation of monetary items are included in profit or loss for the period. Exchange differences arising on the retranslation of non-monetary items carried at fair value are included in profit or loss for the period except for differences arising on the retranslation of non-monetary items with respect to gains and losses that are recognised directly in equity. For such non-monetary items, any exchange component of that gain or loss is also recognised directly in equity.
For the purpose of presenting consolidated financial statements, the assets and liabilities of the Group's foreign operations (including comparatives) are expressed in United States Dollar using exchange rates prevailing at the end of the financial year. Income and expense items (including comparatives) are translated at the average exchange rates for the period, unless exchange rates fluctuated significantly during that period, in which case the exchange rates at the dates of the transactions are used. Exchange differences arising are recognised initially in other comprehensive income and accumulated in the Group's foreign exchange reserve.
On consolidation, exchange differences arising from the translation of the net investment in foreign entities (including monetary items that, in substance, form part of the net investment in foreign entities), and of borrowings and other currency instruments designated as hedges of such investments, are recognised in the foreign exchange reserve.
On disposal of a foreign operation, the accumulated foreign exchange reserve relating to that operation is reclassified to profit or loss.
Goodwill and fair value adjustments arising on the acquisition of a foreign operation are treated as assets and liabilities of the foreign operation and translated at the closing rate.
2.9 Plant and equipment
All items of plant and equipment are initially recognised at cost. The cost includes its purchase price and any costs directly attributable to bringing the asset to the location and condition necessary for it to be capable of operating in the manner intended by management. Dismantlement, removal or restoration costs are included as part of the cost if the obligation for dismantlement, removal or restoration is incurred as a consequence of acquiring or using the plant and equipment.
Subsequent expenditure on a plant and equipment item is added to the carrying amount of the item if it is probable that future economic benefits associated with the item will flow to the Group and the cost can be measured reliably. All other costs of servicing are recognised in profit or loss when incurred.
Plant and equipment are subsequently stated at cost less accumulated depreciation and any accumulated impairment losses.
Depreciation is calculated using the straight-line method to allocate the depreciable amounts over their estimated useful lives on the following basis:
| Computers and books | 3 - 5 years |
| Furniture and fittings | 3 - 7 years |
| Motor vehicles | 6 - 10 years |
| Leasehold improvements | 3 - 5 years |
No depreciation is charged on construction-in-progress as the assets are not yet ready for their intended use as at the end of the reporting period.
The carrying values of plant and equipment are reviewed for impairment when events or changes in circumstances indicate that the carrying value may not be recoverable.
The estimated useful lives, residual values and depreciation methods are reviewed, and adjusted as appropriate, at the end of each financial period.
A plant and equipment item is derecognised upon disposal or when no future economic benefits are expected from its use or disposal.
The gain or loss arising on disposal or retirement of a plant and equipment item is determined as the difference between the sales proceeds and the carrying amount of the asset and is recognised in profit or loss.
2.10 Intangible assets
Goodwill
Goodwill arising on the acquisition of a subsidiary or business represents the excess of the consideration transferred, the amount of any non-controlling interests in the acquiree and the acquisition date fair value of any previously held equity interest in the acquiree over the acquisition date fair value of the identifiable assets, liabilities and contingent liabilities of the subsidiary recognised at the date of acquisition.
Goodwill on subsidiary is recognised separately as intangible assets. Goodwill is initially recognised at cost and subsequently measured at cost less any accumulated impairment losses.
For the purpose of impairment testing, goodwill is allocated to each of the Group's cash-generating units ("CGUs") expected to benefit from the synergies of the combination. CGUs to which goodwill has been allocated are tested for impairment annually, or more frequently when there is an indication that the unit may be impaired. If the recoverable amount of the CGU is less than the carrying amount of the unit, the impairment loss is allocated first to reduce the carrying amount of any goodwill allocated to the unit and then to the other assets of the unit pro-rata on the basis of the carrying amount of each asset in the unit. An impairment loss recognised for goodwill is not reversed in a subsequent period.
On disposal of a subsidiary, the attributable amount of goodwill is included in the determination of the gain or loss on disposal.
Intangible assets acquired in a business combination
Intangible assets acquired in a business combination are identified and recognised separately from goodwill if the assets and their fair values can be measured reliably. The cost of such intangible assets is their fair value as at the acquisition date.
Subsequent to initial recognition, intangible assets acquired in a business combination are reported at cost less accumulated amortisation and any accumulated impairment losses, on the same basis as intangible assets acquired separately.
Intangible assets acquired in a business combination (Continued)
Intangible assets with finite useful lives are amortised over the estimated useful lives and assessed for impairment whenever there is an indication that the intangible asset may be impaired. The amortisation period and the amortisation method are reviewed at least at each financial period-end. Changes in the expected useful life or the expected pattern of consumption of future economic benefits embodied in the asset is accounted for by changing the amortisation period or method, as appropriate, and are treated as changes in accounting estimates. The amortisation expense on intangible assets with finite useful lives is recognised in profit or loss.
An intangible asset is derecognised upon disposal or when no future economic benefits are expected from its use of disposal. Any gain or loss on derecognition of the asset is included in profit or loss in the financial period the asset is derecognised.
2.11 Impairment of non-financial assets excluding goodwill
At the end of each financial period, the Group reviews the carrying amounts of its non-financial assets to determine whether there is any indication that those assets have suffered an impairment loss. If any such indication exists, the recoverable amount of the asset is estimated in order to determine the extent of the impairment loss,if any. Where it is not possible to estimate the recoverable amount of an individual asset, the Group estimates the recoverable amount of the cash-generating unit to which the asset belongs.
Intangible assets with indefinite useful lives and intangible assets not yet available for use are tested for impairment annually, and whenever there is an indication that the asset may be impaired.
The recoverable amount of an asset or CGU is the higher of its fair value less costs to sell and its value in use. In assessing value in use, the estimated future cash flows are discounted to their present value using a pre-tax discount rate that reflects current market assessments of the time value of money and the risks specific to the asset.
If the recoverable amount of an asset (or CGU) is estimated to be less than its carrying amount, the carrying amount of the asset (or CGU) is reduced to its recoverable amount. An impairment loss is recognised immediately in profit or loss.
Where an impairment loss subsequently reverses, the carrying amount of the asset (CGU) is increased to the revised estimate of its recoverable amount, but the increased carrying amount does not exceed the carrying amount that would have been determined had no impairment loss been recognised for the asset (or CGU) in prior years. A reversal of an impairment loss is recognised immediately in profit or loss.
2.12 Financial instruments
The Group recognises a financial asset or a financial liability in its statement of financial position when, and only when, the Group becomes party to the contractual provisions of the instrument.
Financial assets
The Group classifies its financial assets into one of the categories below, depending on the Group's business model for managing the financial assets as well as the contractual terms of the cash flows of the financial asset. The Group shall reclassify its affected financial assets when, and only when, the Group changes its business model for managing these financial assets. The Group's accounting policy for each category is detailed below.
Amortised cost
These assets arise principally from the provision of goods and services to customers (e.g. trade receivables), but also incorporate other types of financial assets where the objective is to hold these assets in order to collect contractual cash flows and the contractual cash flows are solely payments of principal and interest. They are initially recognised at fair value plus transaction costs that are directly attributable to their acquisition or issue, and are subsequently carried at amortised cost using the effective interest rate method less provision for impairment. Interest income from these financial assets is included in interest income using the effective interest rate method.
Impairment provisions for trade receivables are recognised based on the simplified approach within IFRS 9 using the lifetime expected credit losses. During this process, the probability of the non-payment of the trade receivables is assessed. This probability is then multiplied by the amount of the expected loss arising from default to determine the lifetime expected credit loss for the trade receivable. For trade receivables, which are reported net of impairments, such provisions are recorded in a separate provision account with the loss being recognised in the consolidated statement of comprehensive income. On confirmation that the trade receivable will not be collectable, the gross carrying value of the asset is written off against the associated provision.
Impairment provisions for other receivables are recognised based on a forward-looking expected credit loss. The methodology used to determine the amount of the provision is based on whether, at each reporting date, there has been a significant increase in credit risk since initial recognition of the financial asset. For those where the credit risk has not increased significantly since initial recognition of the financial asset, twelve month expected credit losses along with gross interest income are recognised. For those that are determined to be credit impaired, lifetime expected credit losses along with interest income on a net basis are recognised.
The Group's financial assets measured at amortised cost are comprised of trade and other receivables (excluding prepayments and sales tax) and cash and cash equivalents in the consolidated statement of financial position.
Derecognition of financial assets
The Group derecognises a financial asset only when the contractual rights to the cash flows from the asset expire, or it transfers the financial asset and substantially all the risks and rewards of ownership of the asset to another entity.
Financial liabilities and equity instruments
Classification as debt or equity
Financial liabilities and equity instruments issued by the Group are classified according to the substance of the contractual arrangements entered into and the definitions of a financial liability and an equity instrument.
Equity instruments
An equity instrument is any contract that evidences a residual interest in the assets of the Group after deducting all its liabilities. Equity instruments are recorded at the proceeds received, net of direct issue costs. The Company classifies ordinary shares as equity instruments.
Financial liabilities
The Group classifies all financial liabilities measured at amortised cost.
Trade and other payables
Trade and other payables, excluding sales tax, are initially measured at fair value, net of transaction costs, and are subsequently measured at amortised cost, where applicable, using the effective interest method.
Loans from a shareholder
Interest-bearing loans from a shareholder are initially measured at fair value, net of transaction costs, and are subsequently measured at amortised cost, using the effective interest method.
Convertible notes
The classification test of convertible notes as equity or as a liability is based on the substance of the contractual arrangement. If there is no obligation for the Group to pay cash to the holders or to settle the convertible notes with a variable number of the Company's ordinary shares, they are classified as equity. In all other cases, the instrument is accounted for as a liability. Upon issuance, the convertible notes are measured at the transaction price including qualifying issuance costs. Convertible notes accounted for as equity instruments are subsequently not remeasured. Upon settlement of equity-classified convertible notes by issuance of ordinary shares, upon conversion or by early redemption at the option of the Company, all amounts are directly recognised in equity.
The convertible notes issued by the Company are convertible at maturity only into a fixed number of ordinary shares of the Company. The holders have no right to demand repayment of the convertible notes from the Company.
The net proceeds of the convertible notes issued, including any directly attributable transaction costs, are classified entirely as equity.
If the convertible notes are redeemed before its maturity date, the difference between any redemption consideration and the carrying amounts of the convertible notes are directly recognised in equity at the date of transaction.
2.13 Cash and cash equivalents
Cash and cash equivalents in the statement of financial position is comprised of cash on hand, cash at bank and demand deposits which are readily convertible to known amounts of cash, with a term of three months or less and are subject to insignificant risk of changes in value.
2.14 Leases
As lessee
All leases are accounted for by recognising a right-of-use asset and a lease liability except for:
· leases of low value assets; and
· leases with a duration of twelve months or less.
The payments for leases of low value assets and short-term leases are recognised as an expense on a straight-line basis over the lease term.
Initial measurement
Lease liabilities are measured at the present value of the contractual lease payments over the lease term, discounted using the Group's incremental borrowing rate at the commencement date of the lease.
Variable lease payments are only included in the measurement of the lease liability if it is depending on an index or rate. In such cases, the initial measurement of the lease liability assumes the variable element will remain unchanged throughout the lease term. Other variable lease payments are expensed in the period to which they relate.
Upon initial recognition, the carrying amount of lease liabilities also includes:
· amounts expected to be payable under any residual value guarantee;
· the exercise price of any purchase option granted in favour of the Group, if it is certain to assess that option; and
· any penalties payable for terminating the lease, if the term of the lease has been estimated on the basis of a termination option being exercised.
Right-of-use assets are initially measured at the amount of lease liabilities, reduced by any lease incentives received and increased for:
· lease payments made at or before commencement of the lease;
· initial direct costs incurred; and
· the amount of any provision recognised where the Group is contractually required to dismantle, remove or restore the leased asset.
The Group presents the right-of-use assets and lease liabilities separately from other assets and other liabilities in the consolidated statement of financial position.
Subsequent measurement
Right-of-use assets are subsequently measured at cost less any accumulated amortisation, any accumulated impairment loss and, if applicable, adjusted for any remeasurement of the lease liabilities. The right-of-use assets under the cost model are amortised on a straight-line basis over the shorter of either the remaining lease term or the remaining useful life of the right-of-use assets using the straight-line method, on the following bases:
Years | |
| International school building | 10 |
| Office premises and schools | 1 - 10 |
If the lease transfers ownership of the underlying asset by the end of the lease term or if the cost of the right-of-use asset reflects that the Group will exercise the purchase option, the right-of-use assets are depreciated over the useful life of the underlying asset.
The carrying amount of right-of-use assets are reviewed for impairment when events or changes in circumstances indicate that the right-of-use asset may be impaired. The accounting policy on impairment is as described in Note 2.11 to the financial statements.
Subsequent to initial measurement, lease liabilities are adjusted to reflect interest charged at a constant periodic rate over the remaining lease liabilities, lease payments made and, if applicable, account for any remeasurement due to reassessment or lease modifications.
After the commencement date, interest on the lease liabilities and variable lease payments not included in the measurement of the lease liabilities are recognised in profit or loss, unless the costs are eligible for capitalisation in accordance with other applicable standards.
When the Group revises its estimate of any lease term (i.e. probability of extension or termination option being exercised), it adjusts the carrying amount of the lease liability to reflect the payments over the revised term. The carrying amount of lease liabilities is similarly revised when the variable element of a future lease payment, dependent on a rate or index, is revised. In both cases, an equivalent adjustment is made to the carrying amount of the right-of-use assets. If the carrying amount of the right-of-use assets is reduced to zero and there is a further reduction in the measurement of lease liabilities, the remaining amount of the remeasurement is recognised directly in profit or loss.
When the Group renegotiates the contractual terms of a lease with a lessor, the accounting treatment depends on the nature of the modification:
· If the renegotiation results in one or more additional assets being leased for an amount commensurate with the standalone price for the additional right-of-use obtained, the modification is accounted for as a separate lease in accordance with the above policy;
· In all other cases where the renegotiation changes the scope of the lease (i.e., extension to the lease term, changes to the lease payments, or one or more additional assets being leased), the lease liability is remeasured using the discount rate applicable on the modification date, with the right-of-use asset being adjusted by the same amount;
· If the renegotiation results in a decrease in scope of the lease, both the carrying amount of the lease liability and right-of-use asset are reduced by the same proportion to reflect the partial or full termination of the lease with any difference being recognised in profit or loss. The lease liability is then further adjusted to ensure its carrying amount reflects the amount of the renegotiated payments over the renegotiated term, with the modified lease payments discounted at the rate applicable on the modification date. The right-of-use asset is adjusted by the same amount.
For lease contracts that convey a right to use an identified asset and require services to be provided by a lessor, the Group has elected to allocate any amount of contractual payments to, and account separately for, any services provided by a lessor as part of the contract.
2.15 Segment reporting
Operating segments are reported in a manner consistent with the internal reporting provided to the chief operating decision-maker. The chief operating decision-maker, who is responsible for allocating resources and assessing the performance of the operating segments, has been identified as the Group Chief Executive Officer.
3. Critical accounting judgements and key sources of estimation uncertainty
In the application of the Group's accounting policies, which are described in Note 2 to the financial statements, management made judgements, estimates and assumptions about the carrying amounts of assets and liabilities that were not readily apparent from other sources. The estimates and associated assumptions were based on historical experience and other factors that were reasonable under the circumstances. Actual results may differ from these estimates.
These estimates and underlying assumptions are reviewed on an ongoing basis. Revisions to accounting estimates are recognised in the period in which the estimate is revised if the revision affects only that period, or in the period of the revision and future periods if the revision affects both current and future periods.
3.1 Critical judgement made in applying the entity's accounting policies
There are no critical judgements, apart from Note 2.1 and those involving estimations (see below) that management has made in the process of applying the Group's accounting policies and which have a significant effect on the amounts recognised in the financial statements.
3.2 Key sources of estimation uncertainty
The key assumptions concerning the future and other key sources of estimation uncertainty at the end of the financial period, that have a significant risk of causing a material adjustment to the carrying amounts of assets and liabilities within the next financial year, are discussed below.
i) Loss allowance for trade and other receivables
The Group uses the simplified approach to calculate expected credit losses ("ECLs") for trade receivables. The provision rates are based on various customers' historical observed default rates.
The Group will consider and evaluate the historical credit loss experience with forward-looking information. For instance, if forecast economic conditions are expected to deteriorate over the next year which can lead to an increased number of defaults in the customers, the historical default rates are adjusted. At the end of each financial year, the historical observed default rates are updated and changes in the forward-looking estimates are analysed.
The assessment of the correlation between historical observed default rates, forecast economic conditions and ECLs is a significant estimate. The amount of ECLs is sensitive to changes in circumstances and of forecast economic conditions. The Group's historical credit loss experience and forecast of economic conditions may also not be representative of customers' actual defaults in the future.
Other than trade receivables, the Group assess the credit risk of other receivables and loans to a subsidiary at each financial year end on an individual basis, to determine whether there have been significant increases in credit risk since the initial recognition of these assets. To determine whether there is a significant increase in credit risks, the Group consider factors such as whether the debtors are facing significant financial difficulties, any default or significant delay in payments. Where there is a significant increase in credit risk, the Group determine the lifetime expected credit loss by considering the loss given default, the probability of default and exposure at default assigned to each counterparty.
These financial assets are written off either partially or in full when there is no realistic prospect of recovery. This is generally the case when the Group determines that the debtor does not have assets or sources of income that could generate sufficient cash flows to repay the amount subject to the write-offs.
The carrying amounts of the trade and other receivables as at 30 September 2025 are disclosed in Note 15 to the financial statements.
ii) Impairment of goodwill
Management determines whether goodwill is impaired at least on an annual basis and as and when there is an indication that goodwill and other intangible assets may be impaired. This requires an estimation of the value-in-use of the CGUs to which the goodwill is allocated. Estimating the value-in-use requires the Group to make an estimate of the expected future cash flows from the CGU and also to choose a suitable growth rate and discount rate in order to calculate the present value of those cash flows.
The Group's carrying amount of intangible assets as at 30 September 2025 and details of the impairment assessment and key assumptions used were disclosed in Note 11 to the financial statements.
iii) Impairment of non-financial assets including plant and equipment, right-of-use assets ("ROU") and intangible assets excluding goodwill
The Group carries out impairment assessments for non-financial assets where there are indications of impairment. In carrying out the impairment assessment, management has identified the CGUs which the non-financial assets belong and determined the recoverable amounts of the CGUs by estimating the expected discounted future cash flows over the remaining useful lives of the non-financial assets. Estimating the recoverable amounts requires the Group to determine a suitable revenue growth rate, discount rate and to make an estimate of the expected future cash flows from the CGU to calculate the present value of those cash flows.
The carrying amounts of plant and equipment, intangible assets and right-of-use assets as at 30 September 2025 are as disclosed in Note 10, Note 11 and Note 12, respectively to the financial statements.
iv) Measurement of lease liabilities
Lease liabilities are measured at the present value of the contractual payments due to the lessor over the lease term. The Group has determined the discount rates with reference to the respective lessee's incremental borrowing rates when the rate inherent in the lease is not readily determinable. The Group obtains the relevant market interest rates after considering the applicable currency of the lease payments and the geographical location where the lessee operates as well as the term of the lease. Management takes into account its own credit spread from recent borrowings and other observable market data to adjust the market interest rate derived from comparable economic environments, lease terms, and values.
The incremental borrowing rate applied to lease liabilities as at 30 September 2025 ranges from 8.5% to 12.5% (2024: 8.0% to 10.0%). The carrying amount of lease liabilities as at 30 September 2025 is as disclosed in Note 12 to the financial statements.
4. Revenue
Disaggregation of revenue
The Group has disaggregated revenue into various categories in the following table which is intended to:
· illustrate how the nature, amount, timing and uncertainty of revenue and cash flows are influenced by economic factors; and
· help users understand the linkage between this information and the revenue segment disclosures provided in Note 25 to the financial statements.
Education | Services | Total | ||||
2025 | 2024 | 2025 | 2024 | 2025 | 2024 | |
$ | $ | $ | $ | $ | $ | |
Service fees | - | - | 7,131,798 | 7,002,570 | 7,131,798 | 7,002,570 |
Tuition fees | 24,970,269 | 22,671,445 | - | - | 24,970,269 | 22,671,445 |
24,970,269 | 22,671,445 | 7,131,798 | 7,002,570 | 32,102,067 | 29,674,015 | |
Transfer of services timing | ||||||
Point in time | 357,429 | 23,085 | 500,453 | 826,023 | 857,882 | 849,108 |
Over time | 24,612,840 | 22,648,360 | 6,631,345 | 6,176,547 | 31,244,185 | 28,824,907 |
24,970,269 | 22,671,445 | 7,131,798 | 7,002,570 | 32,102,067 | 29,674,015 | |
Disaggregation of revenue (Continued)
The timing of revenue recognition would affect the amount of revenue and deferred revenue recognised as at the reporting date in the consolidated statement of financial position.
2025 | 2024 | |
$ | $ | |
Contract liabilities | ||
Deferred revenue | 18,880,567 | 14,424,989 |
Analysed as: | ||
Current | 14,480,878 | 12,471,197 |
Non-current | 4,399,689 | 1,953,792 |
18,880,567 | 14,424,989 |
a) Significant changes in contract liabilities are as detailed below:
2025 | 2024 | |
$ | $ | |
At 1 October | 14,424,989 | 12,093,331 |
Cash received in advance of performance and not recognised as revenue | 30,357,376 | 26,175,167 |
Revenue recognised during the financial year: | ||
On contract liabilities balances at beginning of financial year | (11,643,390) | (13,247,340) |
On cash received in advance during financial year | (13,957,360) | (10,564,950) |
(25,600,750) | (23,812,290) | |
Foreign exchange difference | (301,048) | (31,219) |
At 30 September | 18,880,567 | 14,424,989 |
b) Remaining performance obligations
Current and non-current deferred revenue represents cash received in advance of the Group's performance obligations. This amount will be recognised as revenue in accordance with the following schedule:
(i) Tuition fees are generally collected up to twelve months in advance (2024: same). For certain students who prepay beyond twelve months in advance, amounts are received ahead of performance in accordance with the specific terms of the individual contracts.
(ii) Fees for certain security services are collected six to twelve months (2024: six to twenty-four months) of service delivery, in accordance with the specific terms of the respective customer contracts.
The revenue amount to be recognised in the next financial years ("FY"), based on when the remaining performance obligations under these contracts are expected to be satisfied, is presented as follows:
Recognised in FY | |||
2026 | 2027 to 2028 | Total | |
Contracted during: | $ | $ | $ |
2025 | |||
Tuition fees | 14,169,312 | 4,399,689 | 18,569,001 |
Service fees | 311,566 | - | 311,566 |
14,480,878 | 4,399,689 | 18,880,567 | |
| Recognised in FY | ||
| 2025 | 2026 to 2027 | Total |
Contracted during: | $ | $ | $ |
2024 | |||
Tuition fees | 12,125,913 | 1,953,792 | 14,079,705 |
Service fees | 345,284 | - | 345,284 |
12,471,197 | 1,953,792 | 14,424,989 | |
5. Other income
2025 | 2024 | |
$ | $ | |
Interest income from bank deposits | 5,045 | 3,187 |
Others | 52,906 | 13,308 |
57,951 | 16,495 |
6. Employee benefits expense
2025 | 2024 | |
$ | $ | |
Wages and salaries | 15,867,003 | 15,106,782 |
Statutory contributions and defined contribution plans | 718,895 | 734,233 |
Share-based payments - share options (Note 21(d)) | 105,000 | 203,830 |
Staff accommodation and welfare | 535,594 | 362,499 |
Staff insurance and medical expenses | 253,929 | 247,611 |
Termination benefits | 61,855 | 20,752 |
Others | 275,456 | 285,066 |
17,817,732 | 16,960,773 | |
Total employee benefit expenses, comprised of: | ||
Cost of services | 8,534,267 | 7,672,756 |
Administrative and other operating expenses | 9,283,465 | 9,288,017 |
17,817,732 | 16,960,773 | |
The above includes Directors' fees and remuneration as disclosed in Note 23 to the financial statements.
7. Finance cost
2025 | 2024 | |
$ | $ | |
Interest expense: | ||
Lease liabilities (Note 12) | 1,268,353 | 1,120,975 |
Loans from a shareholder (Note 17) | 224,802 | 216,920 |
Others | - | 3,496 |
1,493,155 | 1,341,391 |
Borrowing costs are recognised in profit or loss in the period in which they are incurred using the effective interest method.
8. Loss before income tax
Depreciation and amortisation expenses relating to plant and equipment and intangible assets directly attributable to the provision of services and for operating activities are included in the "cost of services" and "administrative and other operating expenses", respectively in the consolidated statement of comprehensive income.
In addition to the charges disclosed elsewhere in the financial statements, the loss before income tax includes the following:
2025 | 2024 | |
$ | $ | |
Cost of services: | ||
Academic expenses | 2,255,030 | 2,138,634 |
Security service expenses | 614,690 | 1,019,759 |
Depreciation of plant and equipment | 132,632 | 144,303 |
Amortisation of intangible assets | 3,128 | 3,147 |
Administrative and other operating expenses: | ||
Marketing expenses | 3,124,276 | 3,480,502 |
Professional fees | 889,017 | 853,766 |
Travelling expenses | 426,036 | 341,131 |
Foreign exchange loss, net | 2,794,062 | 1,455,135 |
(Gain)/Loss on disposal of plant and equipment | (4,155) | 1,657 |
Depreciation of plant and equipment | 1,169,366 | 1,062,725 |
Amortisation of right-of-use assets | 2,683,325 | 2,786,093 |
Amortisation of intangible assets | 99,613 | 97,571 |
Loss allowance on trade and other receivables | 3,008 | - |
9. Income tax expense
2025 | 2024 | |
$ | $ | |
Current income tax (credit)/expense | ||
- Current financial year | (65,610) | 245,674 |
- Over provision in previous financial year | (14,211) | - |
Total income tax (credit)/expense recognised in profit or loss | (79,821) | 245,674 |
The corporate income tax rate applicable to the Company and its subsidiaries in Singapore is 17% (2024: 17%). The Group has significant operations in Myanmar and Vietnam. The applicable corporate income tax rates are 22% (2024: 22%) for Myanmar and 20% (2024: 20%) for Vietnam. Taxation for other jurisdictions is calculated at the rates prevailing in the relevant jurisdictions.
The reconciliation between income tax expense and the product of accounting losses multiplied by the applicable corporate tax rates of the respective countries where the Group operates, are as follows:
2025 | 2024 | |
$ | $ | |
Loss before income tax | (6,356,701) | (10,708,012) |
(Tax credits)/Taxable income at the domestic rates applicable to (losses)/profits in the country concerned | (1,250,565) | (1,988,383) |
Tax effect of non-allowable expenses | 429,971 | 1,462,683 |
Deferred tax assets not recognised | 836,368 | 1,030,969 |
Utilisation of previously unrecognised deferred tax | (81,384) | (259,595) |
Over provision of prior year income tax | (14,211) | - |
Total income tax (credit)/expense recognised in profit or loss | (79,821) | 245,674 |
Deferred tax assets have not been recognised in respect of the following items:
2025 | 2024 | ||||||
Singapore | Myanmar | Vietnam | Singapore | Myanmar | Vietnam | ||
$ | $ | $ | $ | $ | $ | ||
Unutilised tax losses | 4,431,974 | 4,273,637 | 14,063,916 | 4,732,273 | 2,949,792 | 11,489,969 | |
Other temporary differences | 669 | - | - | 669 | - | - | |
4,432,643 | 4,273,637 | 14,063,916 | 4,732,942 | 2,949,792 | 11,489,969 | ||
Unrecognised deferred tax assets on the above temporary differences | 753,549 | 940,200 | 2,812,783 | 804,600 | 648,954 | 2,297,994 | |
The unutilised tax losses above are subject to the agreement by the Myanmar, Vietnam and Singapore tax authorities. Deferred tax assets have not been recognised as it is uncertain that there will be sufficient future taxable profits to realise these future benefits. Accordingly, these deferred tax assets have not been recognised in the financial statements of the Group in accordance with the accounting policy in Note 2.7 to the financial statements.
The unutilised tax losses of Myanmar and Vietnam subsidiaries may be carried forward for a maximum period of three and five years, respectively, and the unutilised tax losses of Singapore subsidiaries may be carried indefinitely subject to the conditions imposed by law.
The expiry dates of the Myanmar and Vietnam unutilised tax losses are as follows:
2025 | 2024 | |||
Myanmar | Vietnam | Myanmar | Vietnam | |
$ | $ | $ | $ | |
Group | ||||
Within the next twelve months | 917,866 | 150,708 | 199,169 | 1,520,724 |
After twelve months but before 24 months | 1,665,875 | 2,301,523 | 946,871 |
150,708 |
After 24 months but before 36 months | 1,689,896 | 2,758,140 | 1,803,752 |
2,301,523 |
After 36 months but before 48 months | - | 4,758,874 | - | 2,758,140 |
After 48 months | - | 4,094,671 | - | 4,758,874 |
4,273,637 | 14,063,916 | 2,949,792 | 11,489,969 | |
The unutilised tax losses disclosed for financial year ended 30 September 2024 have been revised based on the latest approved tax assessment from the Inland Revenue of Singapore and the General Department of Taxation of Vietnam, respectively, as detailed below:
a) Singapore from $4,972,253 to $4,732,942; and
b) Vietnam from $10,374,784 to $11,489,969.
10. Plant and equipment
Leasehold improvements | Furniture and fittings | Computers and books | Motor vehicles | Construction- in-progress | Total | |
$ | $ | $ | $ | $ | $ | |
| ||||||
Cost | ||||||
Balance as at 1 October 2024 | 4,312,885 | 1,423,845 | 1,353,564 | 63,253 | 56,709 | 7,210,256 |
Additions | 452,860 | 144,936 | 58,003 | - | 54,231 | 710,030 |
Transfers | 72,667 | - | - | - | (72,667) | - |
Disposals | - | (12,231) | (1,870) | - | - | (14,101) |
Write-off (Note 2.1) | (781,416) | (100,490) | (661) | - | - | (882,567) |
Foreign exchange difference | (98,150) | (28,795) | (18,542) | (1,484) | (2,945) | (149,916) |
Balance as at 30 September 2025 | 3,958,846 | 1,427,265 | 1,390,494 | 61,769 | 35,328 | 6,873,702 |
Accumulated depreciation | ||||||
Balance as at 1 October 2024 | 1,621,001 | 706,562 | 737,917 | 31,590 | - | 3,097,070 |
Depreciation for the year | 704,729 | 297,487 | 292,655 | 7,127 | - | 1,301,998 |
Disposals | - | (7,731) | (1,545) | - | - | (9,276) |
Write-off (Note 2.1) | (318,394) | (41,532) | (404) | - | - | (360,330) |
Foreign exchange difference | (38,884) | (17,164) | (10,024) | (360) | - | (66,432) |
Balance as at 30 September 2025 | 1,968,452 | 937,622 | 1,018,599 | 38,357 | - | 3,963,030 |
Net carrying amount | ||||||
Balance as at 30 September 2025 | 1,990,394 | 489,643 | 371,895 | 23,412 | 35,328 | 2,910,672 |
Leasehold improvements | Furniture and fittings | Computers and books | Motor vehicles | Construction- in-progress | Total | |
$ | $ | $ | $ | $ | $ | |
| ||||||
Cost | ||||||
Balance as at 1 October 2023 | 2,560,638 | 921,588 | 955,427 | 63,450 | 243,920 | 4,745,023 |
Additions | 1,244,704 | 351,991 | 279,951 | - | 607,660 | 2,484,306 |
Transfers | 512,936 | 152,054 | 126,538 | - | (791,528) | - |
Disposals | - | (409) | (7,434) | - | - | (7,843) |
Foreign exchange difference | (5,393) | (1,379) | (918) | (197) | (3,343) | (11,230) |
Balance as at 30 September 2024 | 4,312,885 | 1,423,845 | 1,353,564 | 63,253 | 56,709 | 7,210,256 |
Accumulated depreciation | ||||||
Balance as at 1 October 2023 | 975,338 | 437,363 | 461,490 | 24,293 | - | 1,898,484 |
Depreciation for the year | 647,255 | 269,830 | 282,669 | 7,274 | - | 1,207,028 |
Disposals | - | (398) | (5,788) | - | - | (6,186) |
Foreign exchange difference | (1,592) | (233) | (454) | 23 | - | (2,256) |
Balance as at 30 September 2024 | 1,621,001 | 706,562 | 737,917 | 31,590 | - | 3,097,070 |
Net carrying amount | ||||||
Balance as at 30 September 2024 | 2,691,884 | 717,283 | 615,647 | 31,663 | 56,709 | 4,113,186 |
During the financial years ended 30 September 2025 and 2024, certain Education businesses incurred accounting losses, which may indicate that the plant and equipment, intangibles assets (including goodwill) and right-of-use assets ("non-financial assets") may be impaired. Management performed impairment assessments on these non-financial assets for Education businesses to determine their recoverable amounts based on the value-in-use ("VIU") calculations.
In carrying out the impairment assessment, management has identified and allocated the non-financial assets to the respective CGUs. Accordingly, the recoverable amounts of the CGUs are determined by estimating the expected discounted future cash flows. The details of the key assumptions used are disclosed in Note 11 to the financial statement
11. Intangible assets
Goodwill | Area development and opening fees | Set-up fee and brand licensing fees | Computer software license | Customer- related assets | Total | |
$ | $ | $ | $ | $ | $ | |
Cost | ||||||
Balance as at 1 October 2024 | 6,000,635 | 959,877 | 40,000 | 122,398 | - | 7,122,910 |
Foreign exchange difference | - | (39,013) | - | (994) | - | (40,007) |
Balance as at 30 September 2025 | 6,000,635 | 920,864 | 40,000 | 121,404 | - | 7,082,903 |
Accumulated amortisation and impairment | ||||||
Balance as at 1 October 2024 | 4,561,645 | 318,601 | 22,000 | 115,004 | - | 5,017,250 |
Amortisation for the year | - | 92,487 | 3,000 | 7,254 | - | 102,741 |
Foreign exchange difference | - | (10,970) | - | (854) | - | (11,824) |
Balance as at 30 September 2025 | 4,561,645 | 400,118 | 25,000 | 121,404 | - | 5,108,167 |
Net carrying amount | ||||||
Balance as at 30 September 2025 | 1,438,990 | 520,746 | 15,000 | - | - | 1,974,736 |
Goodwill | Area development and opening fees | Set-up fee and brand licensing fees | Computer software license | Customer- related assets | Total | |
$ | $ | $ | $ | $ | $ | |
Cost | ||||||
Balance as at 1 October 2023 | 6,039,685 | 858,153 | 40,000 | 122,539 | 273,913 | 7,334,290 |
Additions | - | 105,230 | - | - | - | 105,230 |
Write-off | - | - | - | - | (273,913) | (273,913) |
Foreign exchange difference | (39,050) | (3,506) | - | (141) | - | (42,697) |
Balance as at 30 September 2024 | 6,000,635 | 959,877 | 40,000 | 122,398 | - | 7,122,910 |
Accumulated amortisation and impairment | ||||||
Balance as at 1 October 2023 | - | 232,882 | 19,000 | 103,460 | 273,913 | 629,255 |
Amortisation for the year | - | 86,139 | 3,000 | 11,579 | - | 100,718 |
Impairment in value | 4,561,645 | - | - | - | - | 4,561,645 |
Write-off | - | - | - | - | (273,913) | (273,913) |
Foreign exchange difference | - | (420) | - | (35) | - | (455) |
Balance as at 30 September 2024 | 4,561,645 | 318,601 | 22,000 | 115,004 | - | 5,017,250 |
Net carrying amount | ||||||
Balance as at 30 September 2024 | 1,438,990 | 641,276 | 18,000 | 7,394 | - | 2,105,660 |
Area development and opening fees | 10 years |
Set-up fee and licensing fee | 10 years |
Computer software license | 3 years |
The carrying amounts of significant intangible assets allocated to the respective CGU which have been grouped to the following segments:
Education | Services | |||||
Myanmar | Vietnam | Myanmar | ||||
2025 | 2024 | 2025 | 2024 | 2025 | 2024 | |
$ | $ | $ | $ | $ | $ | |
Goodwill | - | - | - | 1,438,990 | 1,438,990 | |
Area development and opening fees(a)(b)(c) | 155,094 | 188,938 | 365,652 | 452,338 | - | - |
(a) Wall Street English: the area development fee was paid for the exclusive right to develop and operate the "Wall Street English" language schools in Myanmar and Vietnam, while the opening fees were paid for each new "Wall Street English" language school in Vietnam and Myanmar for a period of ten years from the date operation commences and when the new school commences operations, respectively.
On 14 April 2023 and 2 August 2023, the Group entered into Master Franchising Agreements ("MFAs") for Vietnam and Myanmar, respectively, revising certain key terms of the previous franchise agreements and adding the rights to sub-franchise. The new MFAs are set to expire on 30 May 2030 for Vietnam and 30 September 2028 for Myanmar and include renewal options for up to three five-year terms each.
The remaining useful lives of the area development and opening fees ranges between three and five years (2024: four and six years).
(b) Kids&Us: on 25 April 2022 and 15 August 2022, the Group entered into exclusive franchising agreements with Kids&Us English, S.L.U ("Kids&Us") for the development of English language school for children under the brand "Kids&Us School of English" in Myanmar and Vietnam, respectively for a period of ten years.
The remaining useful lives range between six and seven years (2024: seven and eight years).
(c) Logiscool: on 27 June 2023 and 2 August 2023, the Group entered into exclusive franchising agreements with Logiscool, KFT. ("Logiscool") for the development of coding schools for children under the brand "Logiscool" in Vietnam and Myanmar, respectively for a period of ten years.
The remaining useful life is eight years (2024: nine years).
Impairment testing of goodwill and non-financial assets
Goodwill acquired in a business combination relates to the Services division in Myanmar, which is a cash-generating-unit ("CGU") and a reportable operating segment. The management determines whether goodwill is impaired at least on an annual basis and as and when there is an indication that goodwill may be impaired.
The Group allocates non-financial assets comprising plant and equipment, other intangible assets and rights-of-use assets to CGUs based on individual or geographically grouped schools that generate independent cash flows inflows.
At the reporting date, the Group carried out review of its assessed CGUs within the Education and Services business segments in Vietnam and Myanmar based on the existing performance of the respective CGUs. Consequently, the Group performed impairment tests for the relevant CGUs with indicators of impairment.
The recoverable amount of the CGUs are determined from value-in-use calculations based on cash flow forecasts derived from the most recent financial budgets approved by management for the next five years. The use of this method requires estimating future cash flows and determining a discount rate to calculate the present value of the cash flows.
For the current financial year, the recoverable amounts resulted in no impairment for CGUs containing goodwill or other intangible assets with finite useful lives.
The key assumptions for these VIU calculations are the discount rates, revenue growth rates and terminal growth rate which consider the current economic and business environment.
Key assumptions used in the VIU calculations
Education | Services | |||||
Vietnam | Myanmar | Myanmar | ||||
2025 | 2024 | 2025 | 2024 | 2025 | 2024 | |
% | % | % | % | % | % | |
Pre-tax discount rate | 15 - 17 | 10 - 12 | 28 - 48 | 24 | 27 | 28 |
Revenue growth rate | 3 - >100 | 7 - 90 | 10 - 73 | 10 - 20 | 12 - 35 | 7 - 9 |
Terminal growth rate | 1 | 3 | 1 | 4 | 1 | 4 |
#Certain yearly growth rates in the Education division exceeded 100% due to a low comparative base. The related intangible assets are immaterial.
The calculations of VIU for all the CGUs are most sensitive to the following assumptions:
Pre-tax discount rates - Discount rates are based on the Group's pre-tax weighted average cost of capital and are benchmarked to externally available data such as country risk premium, equity risk premium and beta adjusted to reflect the CGUs geographical location of operations and management's assessment of specific risks related to each of the cash generating units. These discounts are applied to the cash flow projections.
Revenue growth rates - The forecasted revenue growth rates are based on management's estimates with reference to the historical trend as well as the forecasted economic condition over the budgeted period of five years. For Education, a key growth driver is the increasing student retention and enrolment.
Terminal growth rate - The terminal growth rate is based on management's expected long-term sustainable growth, taking into consideration the economic and political environment of the countries these CGUs are located and operating. It does not exceed the expected long-term growth rate in the relevant countries.
Sensitivity to changes in key assumptions
Sensitivity analysis performed in the impairment tests indicates that headroom exists for all CGUs when changes are made in the key assumptions. However, the recoverable amounts are highly sensitive to revenue growth assumptions for the following CGUs:
a) The base case scenario for the education CGU in Vietnam assumes an average revenue growth rate of 6.1%, which results in a headroom of approximately US$8,200,000. A reduction in the revenue growth rate to 3.5% would reduce the headroom to approximately US$139,000. Any further reduction in the contract value growth rate would result in the recoverable amount falling below the carrying amount of the CGU, giving rise to an impairment charge on other intangible assets and plant and equipment of $203,000 and $565,000 respectively; and
b) The key assumption in determining the recoverable amount of goodwill, assigned to the Services division in Myanmar, is the revenue growth rate over the impairment review period of five years. Based on management's base case forecast (taking into account market inflation of 15% per annum) of revenue growth in FY2026 of 35%, the recoverable amount exceeds the goodwill carrying amount by $8,500,000. This revenue growth assumption would need to fall to 12%, in order for the cash generating unit's recoverable amount to be equal to its carrying amount.
Management believes that the base case assumptions reflect its best estimate of the economic conditions at the reporting date and are supported by historical performance and current operating trends. No impairment was recognised for goodwill attributable to Services business in Myanmar and other non-financial assets. Based on the sensitivity analysis performed, no reasonable changes in key assumptions would cause an impairment charge.
12. Leases
The Group enters into long-term lease agreements for its corporate offices and schools which are secured by the lessor's title to the leased assets. Unless permitted by the landlord, the Group is restricted from assigning and sub-leasing.
Generally, these leases have terms between one and ten years with options exercisable by the Group to renew and terminate. In determining the lease term, management considers the likelihood of exercising the extension option. Management considers all facts and circumstances that create an economic incentive to extend as well as economic penalties or costs relating to the termination of a lease. A reassessment is performed when there is a significant change in intention, business plan or other circumstances unforeseen since first estimated.
These salient terms are negotiated to optimise operational flexibility for managing the assets used in the Group's operations to align with the Group's business requirements.
As at 30 September 2025, the Group has $578,000 (2024: $530,000) of aggregate undiscounted commitments for short-term leases. The Group applies the "short term lease" and "lease of low-value assets" recognition exemption for these leases.
(a) Right-of-use assets
As at 30 September 2025, the net carrying amounts of ROUs and lease liabilities arising from the leases of offices and schools from an affiliated company (refer Note 15) of the Group amounted to $4,160,982 and $4,614,538 (2024: $4,804,212 and $4,921,525), respectively. These transactions were at terms agreed between the respective parties.
International school | Offices and schools | Total | ||||
$ | $ | $ | ||||
At 1 October 2024 | 861,096 | 10,606,234 | 11,467,330 | |||
Additions | 3,036,201 | 4,965,630 | 8,001,831 | |||
Amortisation charge | (253,489) | (2,429,836) | (2,683,325) | |||
Lease modification | - | (414,027) | (414,027) | |||
Foreign exchange difference | - | (330,934) | (330,934) | |||
At 30 September 2025 | 3,643,808 | 12,397,067 | 16,040,875 | |||
At 1 October 2023 | 1,881,308 | 9,502,032 | 11,383,340 |
| ||
Additions | - | 3,757,989 | 3,757,989 |
| ||
Amortisation charge | (243,733) | (2,542,360) | (2,786,093) |
| ||
Lease modification | (776,479) | (66,202) | (842,681) |
| ||
Foreign exchange difference | - | (45,225) | (45,225) |
| ||
At 30 September 2024 | 861,096 | 10,606,234 | 11,467,330 | |||
(b) Lease liabilities
International school | Offices and schools | Total | |
$ | $ | $ | |
At 1 October 2024 | 1,238,210 | 11,520,113 | 12,758,323 |
Additions | 3,036,201 | 4,965,630 | 8,001,831 |
Interest expense (Note 7) | 164,094 | 1,104,259 | 1,268,353 |
Lease modification | - | (433,873) | (433,873) |
Lease concession | - | (39,899) | (39,899) |
Lease payments in cash | |||
- Principal portion | (165,428) | (1,791,244) | (1,956,672) |
- Interest portion | (164,094) | (1,104,259) | (1,268,353) |
Foreign exchange differences | - | (383,501) | (383,501) |
At 30 September 2025 | 4,108,983 | 13,837,226 | 17,946,209 |
International school | Office and schools | Total | |
$ | $ | $ | |
At 1 October 2023 | 2,222,316 | 9,898,900 | 12,121,216 |
Additions | - | 3,757,989 | 3,757,989 |
Interest expense (Note 7) | 120,487 | 1,000,488 | 1,120,975 |
Lease modification | (776,479) | (66,202) | (842,681) |
Lease concession | - | (13,562) | (13,562) |
Lease payments in cash | |||
- Principal portion | (207,627) | (2,001,555) | (2,209,182) |
- Interest portion | (120,487) | (1,000,488) | (1,120,975) |
Foreign exchange differences | - | (55,457) | (55,457) |
At 30 September 2024 | 1,238,210 | 11,520,113 | 12,758,323 |
The maturity analysis of Group lease liabilities at each reporting date are as follows:
2025 | 2024 | |
$ | $ | |
| ||
Contractual undiscounted cash flows | ||
Not later than a year | 4,249,961 | 2,826,044 |
Between one and two years | 3,843,258 | 3,818,752 |
Between two and five years | 7,851,123 | 7,543,108 |
More than five years | 11,339,229 | 3,264,420 |
27,283,571 | 17,452,324 | |
Less: Future interest expense | (9,337,362) | (4,694,001) |
Present value of lease liabilities | 17,946,209 | 12,758,323 |
Presented in consolidated statement of financial position | ||
- Current | 2,523,814 | 2,546,728 |
- Non-current | 15,422,395 | 10,211,595 |
17,946,209 | 12,758,323 |
The currency profile of Group lease liabilities at each reporting date are as follows:
2025 | 2024 | |
$ | $ | |
United States Dollar | 924,557 | 1,146,779 |
Myanmar Kyat | 12,722,769 | 5,123,831 |
Vietnamese Dong | 4,298,883 | 6,487,713 |
17,946,209 | 12,758,323 |
(c) Amount recognised in profit or loss
2025 | 2024 | |
$ | $ | |
| ||
Amortisation of right-of-use assets | 2,683,325 | 2,786,093 |
Interest expense on lease liabilities | 1,268,353 | 1,120,975 |
Lease concession | (39,899) | (13,562) |
Lease modification | (19,846) | - |
Lease expense relating to short-term leases, not capitalised in lease liabilities | 213,384 | 672,997 |
Total amount recognised in profit or loss | 4,105,317 | 4,566,503 |
The Group had total cash outflows for leases of $3,438,409 (2024: $4,003,154) which includes expense relating to short-term leases of $213,384 (2024: $672,997).
13. Investments in subsidiaries
The following are all the subsidiaries of the group that have been included in the consolidated financial statements. Their particulars are as follows:
Name of Company (Country of incorporation and principal place of business) | Principal activities | Effective interest held by Company | |
2025 | 2024 | ||
% | % | ||
Held by the Company | |||
MS Exera Pte Ltd("MS Exera")(1) (Singapore) | Provision of management and security related services and holding company | 100 | 100 |
MS Leisure Pte Ltd("MS Leisure")(1) (Singapore) | Provision of management services and holding company | 100 | 100 |
MS English Pte. Ltd.("MS English")(1) (Singapore) | Provision of management services and holding company | 100 | 100 |
The following are all the subsidiaries of the group that have been included in the consolidated financial statements. Their particulars are as follows: (Continued)
Name of Company (Country of incorporation and principal place of business) | Principal activities | Effective interest held by Company | |
2025 | 2024 | ||
% | % | ||
Held by the Company (Continued) | |||
MS Auston Pte. Ltd.("MS Auston")(1) (Singapore) | Provision of management services and holding company | 100 | 100 |
AS Coding 1 Pte. Ltd.("AS Coding 1")(1) (Singapore) | Provision of management services and holding company | 100 | 100 |
MS English 2 Pte. Ltd.("MS English 2")(1) (Singapore) | Provision of management services and holding company | 100 | 100 |
AS English 3 Pte. Ltd.("AS English 3")(1) (Singapore) | Provision of management services and holding company | 100 | 100 |
AS Coding 2 Pte. Ltd.("AS Coding 2")(1) (Singapore) | Provision of management services and holding company | 100 | 100 |
American International Partners Limited("AIPL")(2) (Myanmar) | Operation of an international school in Myanmar | 100 | 100 |
Held through MS Exera | |||
EXERA Myanmar Limited("EXERA Myanmar")(2) (Myanmar) | Provision of integrated security facility and risk management services | 100 | 100 |
Exera Vietnam Company Limited ("EXERA Vietnam")(3) (Vietnam) | Provision of integrated facility management services | 100 | 100 |
Held through MS Leisure | |||
L Partners Limited("L Partners")(2) (Myanmar) | Operation and management of Kids&Us English language schools | 100 | 100 |
Held through MS English | |||
E Partners Limited ("E Partners")(2) (Myanmar) | Operation and management of Wall Street English language schools | 100 | 100 |
Name of Company (Country of incorporation and principal place of business) | Principal activities | Effective Interest held by Company | |
2025 | 2024 | ||
% | % | ||
Held through MS Auston | |||
A Partners Limited("A Partners")(2) (Myanmar) | Operation and management of Auston college | 100 | 100 |
Held through AS Coding 1 | |||
C Partners Limited("C Partners")(2) (Myanmar) | Operation and management of Logiscool coding schools | 100 | 100 |
Held through MS English 2 | |||
Wall Street English Limited Liability Company("WSE Vietnam")(3) (Vietnam) | Operation and management of Wall Street English language schools | 100 | 100 |
Held through AS English 3 | |||
AS English Vietnam Company Limited("AS Vietnam")(3) (Vietnam) | Operation and management of Kids&Us English language schools | 100 | 100 |
Held through AS Coding 2 | |||
AS Coding Vietnam Company Limited("ASC Vietnam")(3) (Vietnam) | Operation and management of Logiscool coding schools | 100 | 100 |
(1) Audited by BDO LLP, Singapore.
(2) Audited by BDO Consulting (Myanmar) Co. Ltd, for consolidation purposes.
(3) Audited by BDO Audit Services Co., Ltd. (Vietnam) for consolidation purposes and for statutory reporting in Vietnam.
14. Inventories
Inventories comprise consumables, security accessories, uniform, raw materials, fabric, merchandise and academic materials. Inventories are measured at lower of cost and net realisable value.
15. Trade and other receivables
2025 | 2024 | |
$ | $ | |
Current | ||
Trade receivables | ||
Third parties, gross | 787,530 | 723,240 |
Less : Loss allowances | ||
At 1 October | (5,939) | (5,939) |
Additions | (3,008) | - |
At 30 September | (8,947) | (5,939) |
Third parties, net | 778,583 | 717,301 |
Accrued receivables | 82,795 | 141,312 |
Total trade receivables | 861,378 | 858,613 |
Other receivables | ||
Rental deposits | 49,413 | 122,070 |
Prepayments for enrolment expenses | 505,938 | 558,878 |
Other prepayments | 977,722 | 1,075,791 |
Sales tax | 7,505 | 85,195 |
Total other receivables | 1,540,578 | 1,841,934 |
Total trade and other receivables (current) | 2,401,956 | 2,700,547 |
Non-current | ||
Affiliated company (Non-trade) | 6,757,126 | 6,552,663 |
Less : Loss allowances (Note 26.1) | (4,400,124) | (4,400,124) |
2,357,002 | 2,152,539 | |
Rental deposits | 915,280 | 440,225 |
Prepayments for enrolment expenses | 37,798 | 49,551 |
Total trade and other receivables (non-current) | 3,310,080 | 2,642,315 |
Total trade and other receivables | 5,712,036 | 5,342,862 |
Less : Prepayments | (1,521,458) | (1,684,220) |
Less : Sales tax | (7,505) | (85,195) |
4,183,073 | 3,573,447 | |
Add : Cash and cash equivalents(Note 16) | 1,548,372 | 782,562 |
Financial assets at amortised cost | 5,731,445 | 4,356,009 |
Trade and other receivables
Trade receivables are non-interest bearing and are generally on 15 to 90 (2024: 15 to 90) day credit terms. They are measured at the original invoice amount, which represents the fair value on initial recognition.
The non-current amount due from an affiliated company is unsecured and interest free, and it is not expected to be repaid within the next twelve months.
Expected credit loss allowances
i) Trade receivables - Third party
Loss allowance were made for third-party trade debtors determined to be credit-impaired as the likelihood of recovery is remote.
ii) Non-current receivables - Affiliated company
In these financial statements, an affiliated company refers to an entity that shares a common director with certain subsidiaries of the Group, where the director also holds a beneficial interest.
Loss allowances of $4,400,124 (2024: $4,400,124) were made in prior years on the non-trade amounts due from an affiliated company in respect of payments made on its behalf and advances for the operation of the managed operations of Wall Street English and Auston in Myanmar. The loss allowance was made based on the financial information of the affiliated company and the expected repayment to be made from the provision of property management services at cost plus mark-up to the Group (Note 12(a)).
The expected recovery of the amounts due from an affiliated company is longer than twelve months after the end of the reporting period.
The Group's trade and other receivables balances (excluding prepayments and sales tax) are denominated in the following currencies:
| ||
2025 | 2024 | |
$ | $ | |
United States Dollar | 1,288,787 | 2,530,746 |
Myanmar Kyat | 2,472,945 | 572,789 |
Vietnamese Dong | 421,341 | 469,331 |
Singapore Dollar | - | 581 |
4,183,073 | 3,573,447 | |
16. Cash and cash equivalents
2025 | 2024 | |
$ | $ | |
Cash at bank | 1,204,805 | 581,423 |
Cash with financial institutions | 4,561 | 405 |
Cash on hand | 339,006 | 200,734 |
1,548,372 | 782,562 |
Cash at bank earns interest at floating rates based on daily bank deposit rates.
Cash and cash equivalents are denominated in the following currencies:
| ||
2025 | 2024 | |
$ | $ | |
United States Dollar | 458,072 | 177,953 |
Singapore Dollar | 50,181 | 22,447 |
Myanmar Kyat | 938,633 | 468,564 |
Vietnamese Dong | 101,027 | 113,127 |
Euro | 459 | 471 |
1,548,372 | 782,562 | |
17. Shareholder loans
The changes in shareholder loan balances (principal and interest) arising from financing activities are listed below:
2025 | 2024 | |
$ | $ | |
At 1 October | 4,756,173 | 2,577,181 |
Drawdown of loan | 45,000 | 1,962,072 |
Interest expense (Note 7) | 224,802 | 216,920 |
Subscription of convertible notes (Note 20) | (800,000) | - |
At 30 September | 4,225,975 | 4,756,173 |
The Group has an unsecured loan facility of up to $4,500,000 with its substantial corporate shareholder, Macan Pte. Ltd. ("MACAN") which bears interest at 6% per annum, repayable within 20 days of notice and matures no later than 31 December 2027.
As at reporting date, MACAN has provided a written undertaking not to demand repayment of the above shareholder loans within twelve months from the date of approval of the audited financial statements of the Group for the financial year ended 30 September 2025. At the date of approval of the financial statements, the Group has a remaining unutilised loan facility of $818,000.
18. Trade and other payables
2025 | 2024 | |
$ | $ | |
Trade payables | ||
Third parties | 2,980,479 | 1,635,883 |
Accrued enrolment expenses | 393,885 | 425,308 |
Total trade payables | 3,374,364 | 2,061,191 |
Other payables | ||
Third parties | 1,118,225 | 1,510,511 |
Accruals - others | 1,737,256 | 1,421,862 |
Accruals - wages and salaries | 751,455 | 801,256 |
Refundable deposits from customers | 1,146,494 | 2,378,945 |
Sales tax | 30,361 | 29,792 |
Total other payables | 4,783,791 | 6,142,366 |
Total trade and other payables | 8,158,155 | 8,203,557 |
Less: Sales tax | (30,361) | (29,792) |
8,127,794 | 8,173,765 | |
Add: Lease liabilities (Note 12) | 17,946,209 | 12,758,323 |
Add: Shareholder loans (Note 17) | 4,225,975 | 4,756,173 |
Financial liabilities carried at amortised cost | 30,299,978 | 25,688,261 |
Trade amounts due to third parties are unsecured, non-interest bearing and on 15 to 90 (2024: 15 to 90) day credit terms.
The non-trade amounts due to third parties and subsidiaries are unsecured, interest-free and repayable on demand.
Trade and other payables (excluding sales tax) are denominated in the following currencies:
2025 | 2024 | |
$ | $ | |
United States Dollar | 3,356,932 | 1,319,716 |
Singapore Dollar | 171,920 | 169,658 |
Myanmar Kyat | 2,620,343 | 3,831,860 |
Vietnamese Dong | 878,603 | 2,282,893 |
Pound Sterling | 570,761 | 223,206 |
Euro | 529,235 | 346,432 |
8,127,794 | 8,173,765 |
19. Share capital
2025 | 2024 | 2025 | 2024 | |
Shares | Shares | $ | $ | |
Issued and fully paid ordinary shares: | ||||
Ordinary shares | ||||
At 1 October | 3,021,920 | 2,965,920 | 21,919,638 | 21,639,638 |
Shares issued during the financial year | - | 56,000 | - | 280,000 |
At 30 September | 3,021,920 | 3,021,920 | 21,919,638 | 21,919,638 |
In the previous financial year, the Company issued 56,000 ordinary shares at $5.00 per share in lieu of payment for accrued employee bonus of $280,000, in respect of employment services rendered for financial year to certain key management personnel.
The holders of ordinary shares are entitled to receive dividends as and when declared by the Company. All ordinary shares have no par value and carry one vote per share without restriction.
20. Convertible notes
2025 | 2024 | |
$ | $ | |
At 1 October | 5,730,000 | 5,730,000 |
Issued and paid during the financial year | ||
- Cash | 725,000 | - |
- Shareholder loans (Note 17) | 800,000 | - |
At 30 September | 7,255,000 | 5,730,000 |
In October 2021, the Group launched a Convertible Notes Programme to raise up to $10 million for working capital and future investments. The convertible notes ("CN") holders had an option to subscribe to either (i) a 10% coupon option ("10% Coupon Convertible Notes") or (ii) a zero-coupon option ("Zero Coupon Convertible Notes"). The proceeds from the convertible notes were limited to 50% for activities in Myanmar and the rank is pari passu to all present and future unsecured obligations.
The CNs are mandatorily convertible into shares of the Company at the earlier of the maturity date (30 October 2024) and when the Qualifying Event is satisfied ("Conversion Date"). On the Conversion Date, the CNs are converted based on the stipulated conversion price and are paid-up in full to the note holders entirely (principal and interest) through the issuance of ordinary shares of the Company.
On 30 October 2024, the Group and existing convertible note ("CN") holders agreed to the following updates to the Convertible Note Programme:
(i) an extension to the maturity of the Zero-Coupon option of the Company's Convertible Note Programme from 30 October 2024 to 30 October 2026;
(ii) an increase in the subscription amount of the Zero-Coupon Convertible Notes from $5,230,000 to $7,255,000 (including the subscription by MACAN Pte. Ltd. ("MACAN") detailed below); and
(iii) the termination of the 10% Coupon option of the Convertible Note Programme.
The increased Zero-Coupon Convertible Notes subscription amount was achieved through:
(i) settlement of $500,000 owed to an existing CN holder from the maturity of the 10% Coupon ("Conversion of 10% Coupon");
(ii) settlement of $800,000 owed to MACAN under an existing loan facility (Note 17); and
(iii) cash payment of $725,000 (including $200,000 from MACAN).
MACAN, the Group's largest shareholder, subscribed for $3,500,000 Zero-Coupon Convertible Notes in November 2021 and subscribed for an additional amount of $1,000,000 of the Zero-Coupon Convertible Notes in October 2024.
The newly issued and existing convertible notes met the fixed for fixed criteria of IFRS 32. Accordingly, the entire amount is recognised within equity.
The convertible notes are denominated in United States Dollar.
The revised key terms of the Zero-Coupon Convertible Notes are as follows:
Coupon | Zero-Coupon |
Maturity | 30 October 2026 |
Conversion price | The higher of (i) Floor subscription price; and (ii) the Discounted subscription price |
Conversion discount | Up to 33.1%, depending on the qualifying event |
Floor conversion price | $11.53 per share |
Conversion date | Earlier of (i) the Maturity date; and (ii) the Qualifying event |
Qualifying event | Share issuance in excess of $5.0 million |
Use of proceeds | Development of business and working capital |
Limited use of proceeds | Maximum of 50% of the proceeds to be used for activities in Myanmar |
Rank | Pari passu to all present and future unsecured obligations |
21. Other reserves
2025 | 2024 | |
$ | $ | |
Share option reserve | 1,606,930 | 1,501,930 |
Fair value reserve | (762,754) | (762,754) |
Equity reserve | (212,271) | (212,271) |
Foreign exchange reserve | 429,873 | 122,358 |
At 30 September | 1,061,778 | 649,263 |
(a) Equity reserve
The equity reserve represents the effects of changes in ownership interests in subsidiaries when there is no change in control.
(b) Foreign exchange reserve
The foreign exchange reserve of the Group represents foreign exchange differences arising from the translation of the financial statements of foreign operations whose functional currencies are different from that of the Group's presentation currency. This is non-distributable and the movements in this account are set out in the statements of changes in equity.
(c) Fair value reserve
Fair value reserve represents the cumulative fair value changes, net of tax, of financial assets measured at FVOCI until they are derecognised. Upon derecognition, the cumulative fair value changes will be transferred to retained earnings.
(d) Share option reserve
2025 | 2024 | |
$ | $ | |
At 1 October | 1,501,930 | 1,298,100 |
Share option expense (Note 6) | 105,000 | 203,830 |
At 30 September | 1,606,930 | 1,501,930 |
Share option reserve represents the equity-settled share options granted to employees. The reserve is made up of the cumulative value of services received from employees recorded over the vesting period commencing from the grant date of equity-settled share options and is reduced by the forfeiture of the share options.
Employee Share Option Schemes
At the Annual General Meetings held on 7 March 2024, 4 March 2022 and 25 October 2016, the shareholders approved Employee Share Option Schemes ("ESOS 2024"), ("ESOS 2022") and ("ESOS 2016") granting share options to certain Directors, senior management and key employees and consultants of the Group. The Remuneration Committee comprising all the Independent Non-Executive Directors is responsible for administering these schemes.
The Group had entered into share option agreements with the employees and Directors of the Group to allot and issue cumulatively 496,500 (2024: 496,500) share options.
Statutory and other information regarding ESOS 2024 and ESOS 2022 are set out below:
(a) Consideration payable by each option holder for the grant is $1.00.
(b) Exercise price is $11.00 per ordinary share.
(c) Options can be exercised during the period commencing on the grant date and terminating on the tenth anniversary of the grant date for up to 200,000 ordinary shares with no par value in the capital of the Company ("Option Shares").
(d) Options granted will vest with effect as follows:
(i) 40 percent of the Option Shares on the first anniversary.
(ii) 40 percent of the Option Shares on the second anniversary.
(iii) 20 percent of the Option Shares on the third anniversary.
(e) Only vested Options will be exercisable.
(f) If the participants cease to be a director or employee of the Company and its subsidiaries at any time, then only vested Options prior to the date of termination will be exercisable.
Statutory and other information regarding ESOS 2016 are set out below:
(a) Consideration payable by each option holder for the grant is $1.00.
(b) Exercise price is $11.00 per ordinary share.
(c) Options can be exercised during the period commencing on the grant date and terminating on the tenth anniversary of the grant date for up to 200,000 ordinary shares with no par value in the capital of the Company ("Option Shares").
(d) Options granted will vest with effect as follows:
(i) 50 percent of the Option Shares on the second anniversary.
(ii) 30 percent of the Option Shares on the third anniversary.
(iii) 20 percent of the Option Shares on the fourth anniversary.
(e) Only vested Options will be exercisable.
(f) If the participants cease to be a director or employee of the Company and its subsidiaries at any time, then only vested Options prior to the date of termination will be exercisable.
These granted share options have a weighted average contractual life of 4.90 years (2024: 5.90 years) at the year end.
These fair values were calculated using the Black-Scholes pricing model using the following assumptions:
Grant date | |||||||
23 May 2017 | 1 December 2017 | 17 October 2018 | 21 July 2020 | 5 July 2022 | 6 February 2023 | 7 March 2024 | |
Fair value at grant date ($) | 4.48 | 7.09 | 5.17 | 5.13 | 3.02 | 3.04 | 2.98 |
Grant date share price ($) | 10.00 | 13.00 | 10.00 | 10.25 | 6.50 | 6.00 | 6.00 |
Exercise price ($) | 11.00 | 11.00 | 11.00 | 11.00 | 11.00 | 11.00 | 11.00 |
Expected volatility | 33.91% | 36.07% | 38.43% | 42.92% | 44.87% | 48.96% | 47.03% |
Option life | 10 years | 10 years | 10 years | 10 years | 10 years | 10 years | 10 years |
Risk-free annual interest rate | 2.28% | 2.36% | 3.21% | 0.60% | 2.88% | 3.63% | 4.09% |
Expected volatility was determined by calculating the historical volatility of the share price over a period of ten years against comparable companies in similar industries. The expected life used in the model has been adjusted, based on management's best estimate, for the effects of non-transferability, exercise restrictions and behavioural considerations.
The Group recognised total expenses of $105,000 (2024: $203,830) with respect to equity-settled share-based payment transactions arising from the ESOS during the financial year.
The following reconciles the share options outstanding at the start and end of the financial year.
2025 | 2024 | |||
Number | Weighted average exercise price | Number | Weighted average exercise price | |
$ | $ | |||
At 1 October | 413,500 | 11.00 | 368,500 | 11.00 |
Granted | - | - | 55,000 | 11.00 |
Forfeited | - | (10,000) | ||
At 30 September | 413,500 | 413,500 | ||
As at 30 September 2025, 377,900 (2024: 315,700) shares options are exercisable.
22. Loss per share
The calculation of the basic and diluted loss per share attributable to the ordinary equity holders of the Company is based on the following data:
2025 | 2024 | |
Numerator | ||
Loss for the financial year attributable to the owners of the parent ($) | (6,276,880) | (10,953,686) |
Denominator | ||
Weighted average number of ordinary shares for the purposes of basic and diluted loss per share | 3,021,920 | 2,997,679 |
Loss per share ($) | ||
Basic and diluted | (2.08) | (3.65) |
Diluted loss per share and basic loss per share are the same as neither the exercise of the share option nor the conversion of mandatory convertible notes would result in an increase in the loss per share.
23. Significant related party transactions
During the financial year, in addition to the information disclosed elsewhere in these financial statements, the Group entered into the following significant transactions with related parties at rates and terms agreed between the parties:
2025 | 2024 | |
$ | $ | |
Corporate shareholder: | ||
Interest on shareholder loans (Note 7) | 224,802 | 216,920 |
Shareholder loans drawn (Note 17) | 45,000 | 1,962,072 |
Subscription of convertible notes (Note 20) | 1,000,000 | - |
Outstanding balances as at reporting date with related parties are disclosed in Notes 17 to the financial statements.
Key management personnel remuneration
Key management personnel are those individuals who have the authority and responsibility for planning, directing and controlling the activities of the Group, directly or indirectly. The Company's key management personnel are the Directors of the Company and other key management personnel.
The details of their remuneration are as follows:
2025 | 2024 | |
$ | $ | |
Wages and salaries | 928,997 | 882,996 |
Other employment benefits | 202,660 | 173,980 |
Share-based compensation - share options | 105,000 | 197,467 |
Director fees | 58,000 | 58,000 |
Total | 1,294,657 | 1,312,443 |
24. Commitment
At each reporting date, commitments with respect to capital expenditures, are as follows:
2025 | 2024 | |
$ | $ | |
Capital expenditures contracted but not provided for | ||
- Plant and equipment | 571,809 | 51,413 |
25. Segment information
Management has identified the Group's operating segments by business units, based on the internal reports reviewed by the chief operating decision maker (Note 2.15). The Group is structured into business units according to the nature of its services and has three reportable operating segments, as outlined below:
a) Education - Operation of Education businesses ranging from early years to tertiary education and including vocational training, consultancy, advisory and project management services in the education sector;
b) Services - Provision of integrated security & facility services, consultancy, advisory and project management services in the security and hospitality sectors. This reportable segment has been formed by aggregating the relevant operating entities, which are regarded by management to exhibit similar economic characteristics; and
c) Corporate - Corporate services, management support and certain shared services to subsidiaries of the Group.
Management monitors the Group's operations from both a geographic and sector perspective. Geographically, management manages and monitors the business in these primary geographic areas: Singapore, Vietnam and Myanmar.
The "Corporate" operating segment includes the Group's minor corporate services and investment holding activities which are not included within reportable segments as (i) they are not separately reported to the chief operating decision maker, and (ii) they contribute immaterial amounts of revenue to the Group.
The Group's reportable segments are strategic business units that are organised based on their function and targeted customer groups. They are managed separately because each business unit requires different skill sets and marketing strategies.
Management monitors the operating results of the segments separately for the purposes of making decisions about resources to be allocated and assessing performance. Segment performance is evaluated based on operating profit or loss which is similar to accounting profit or loss. Income taxes are managed by the management of respective entities within the Group.
The accounting policies of the operating segments are the same as those described in the summary of significant accounting policies. There is no asymmetrical allocation to reportable segments. Management evaluates performance on the basis of profit or loss from operations before income tax expense. There is no change from prior periods in the measurement methods used to determine reported segment profit or loss.
Income taxes are managed by the management of respective entities within the Group.
Key management personnel assess the performance of the operating segments based on, among others, earnings before interest, income tax, depreciation and amortisation ("EBITDA"), (i) Adjusted EBITDA (as presented below) and (ii) Adjusted EBITDA less amortisation of right-of-use assets and interest on lease liabilities ("Adjusted EBITDA after impact of ROUs").
These measurements exclude the effects of expenditure from the operating segments such as impairments and the reversal of impairments that are not expected to recur regularly in every period and are separately analysed.
All income and expenses are allocated to the respective operating segments based on the entities within each operating segment, except for interest expenses as this activity is managed centrally.
Business segments
Education | Services | Corporate | Total | |
$ | $ | $ | $ | |
2025 | ||||
Revenue | 24,970,269 | 7,131,798 | - | 32,102,067 |
Cost of services | (7,226,223) | (5,981,392) | - | (13,207,615) |
Gross profit | 17,744,046 | 1,150,406 | - | 18,894,452 |
Other income | 15,872 | 5,121 | 36,958 | 57,951 |
Foreign exchange loss | (2,572,198) | (201,134) | (20,730) | (2,794,062) |
Plant and equipment write-off | (521,717) | (520) | - | (522,237) |
Administrative and other operating expenses | (16,400,208) | (1,798,691) | (2,300,751) | (20,499,650) |
Loss from operations | (1,734,205) | (844,818) | (2,284,523) | (4,863,546) |
Finance cost | (1,252,040) | (16,313) | (224,802) | (1,493,155) |
Segment loss before tax | (2,986,245) | (861,131) | (2,509,325) | (6,356,701) |
Income tax expense | 65,610 | 14,211 | - | 79,821 |
Loss after income tax | (2,920,635) | (846,920) | (2,509,325) | (6,276,880) |
Other non-cash items: | ||||
Total depreciation of plant and equipment | 1,214,704 | 87,020 | 274 | 1,301,998 |
Plant and equipment write-off | 521,717 | 520 | - | 522,237 |
Total amortisation of right-of-use asset | 2,599,803 | 83,522 | - | 2,683,325 |
Total amortisation of intangible assets | 102,741 | - | - | 102,741 |
Impairment loss on trade receivables | - | 3,008 | - | 3,008 |
Finance costs (excluding interest on lease liabilities) | - | - | 224,802 | 224,802 |
Total interest on lease liabilities | 1,252,040 | 16,313 | - | 1,268,353 |
5,691,005 | 190,383 | 225,076 | 6,106,464 | |
Adjusted EBITDA | 2,704,760 | (670,748) | (2,284,249) | (250,237) |
Adjusted EBITDA after impact of ROUs | (1,147,083) | (770,583) | (2,284,249) | (4,201,915) |
Reportable segment assets | ||||
Total Group's assets | 24,402,398 | 4,155,558 | 114,259 | 28,672,215 |
Included in the segment assets: | ||||
Additions: | ||||
- Plant and equipment | 678,087 | 30,848 | 1,095 | 710,030 |
- Right-of-use assets | 8,001,831 | - | - | 8,001,831 |
Reportable segment liabilities representing total Group's liabilities | (43,186,234) | (1,274,037) | (4,750,635) | (49,210,906) |
Education | Services | Corporate | Total | |
$ | $ | $ | $ | |
2024 | ||||
Revenue | 22,671,445 | 7,002,570 | - | 29,674,015 |
Cost of services | (7,276,016) | (5,413,471) | - | (12,689,487) |
Gross profit | 15,395,429 | 1,589,099 | - | 16,984,528 |
Other income | 13,942 | 986 | 1,567 | 16,495 |
Foreign exchange loss | (1,255,728) | (174,953) | (24,454) | (1,455,135) |
Impairment of Goodwill | (4,561,645) | - | - | (4,561,645) |
Administrative and other operating expenses | (16,378,944) | (1,757,009) | (2,214,911) | (20,350,864) |
Loss from operations | (6,786,946) | (341,877) | (2,237,798) | (9,366,621) |
Finance cost | (1,100,934) | (22,565) | (217,892) | (1,341,391) |
Segment loss before tax | (7,887,880) | (364,442) | (2,455,690) | (10,708,012) |
Income tax expense | (245,674) | - | - | (245,674) |
Loss after income tax | (8,133,554) | (364,442) | (2,455,690) | (10,953,686) |
Other non-cash items: | ||||
Total depreciation of plant and equipment | 1,119,464 | 87,278 | 286 | 1,207,028 |
Total amortisation of right-of-use asset | 2,669,847 | 116,246 | - | 2,786,093 |
Total amortisation of intangible assets | 100,718 | - | - | 100,718 |
Impairment loss on intangible asset | 4,561,645 | - | - | 4,561,645 |
Finance costs (excluding interest on lease liabilities) | 2,524 | - | 217,892 | 220,416 |
Total interest on lease liabilities | 1,098,410 | 22,565 | - | 1,120,975 |
9,552,608 | 226,089 | 218,178 | 9,996,875 | |
Adjusted EBITDA | 1,664,728 | (138,353) | (2,237,512) | (711,137) |
Adjusted EBITDA after impact of ROUs | (2,103,529) | (277,164) | (2,237,512) | (4,618,205) |
Reportable segment assets | ||||
Total Group's assets | 20,488,630 | 3,572,599 | 75,521 | 24,136,750 |
Included in the segment assets: | ||||
Additions: | ||||
- Plant and equipment | 2,443,866 | 40,440 | - | 2,484,306 |
- Right-of-use assets | 3,757,988 | - | - | 3,757,988 |
- Intangibles | 105,230 | - | - | 105,230 |
Reportable segment liabilities representing total Group's liabilities | (33,649,977) | (1,373,316) | (5,312,783) | (40,336,076) |
Geographical segments
The Group operates in three main geographical areas:
Revenue | Non-current assets | |||
2025 | 2024 | 2025 | 2024 | |
$ | $ | $ | $ | |
Singapore | 31,034 | 16,516 | 15,821 | 18,000 |
Vietnam | 7,780,866 | 8,233,232 | 4,781,647 | 7,565,291 |
Myanmar | 24,290,167 | 21,424,267 | 16,128,815 | 10,102,885 |
32,102,067 | 29,674,015 | 20,926,283 | 17,686,176 | |
Revenue is based on the country in which the customers are located. Segmental non-current assets consist primarily of non-current assets other than financial instruments and deferred tax assets. Segment non-current assets are shown by geographical areas where the assets are located.
Non-current assets consist of plant and equipment, intangible assets and right-of-use assets in the consolidated statements of financial position of the Group.
26. Financial instruments and financial risks
The Group's activities have exposure to credit risks, market risks (including foreign currency risks, interest rates risks and equity price risk) and liquidity risks arising in the ordinary course of business. The Group's overall risk management strategy seeks to minimise adverse effects from the volatility of financial markets on the Group's financial performance.
The Board of Directors is responsible for setting the objectives and underlying principles of financial risk management for the Group. The Group's management then establishes detailed policies, such as risk identification and measurement, exposure limits and hedging strategies, in accordance with the objectives and underlying principles approved by the Board of Directors.
There has been no change to the Group's exposure to these financial risks or the way the risks are managed and measured, except for those key estimates and judgements applied in Note 3 to the financial statements.
The Group does not hold or issue derivative financial instruments for trading purposes or to hedge against fluctuations, if any, in interest rates and foreign exchange rates.
26.1 Credit risks
Credit risk is the risk of financial loss to the Group if a customer or counterparty to a financial instrument fails to meet its contractual obligations. The Group has adopted a policy of only dealing with creditworthy counterparties as a means of mitigating the risk of financial loss from defaults or requiring partial or full advance payments from customers. The Group performs ongoing credit evaluations of its counterparties' financial conditions. The Group generally does not require collateral.
The Board of Directors has established a credit policy under which each new customer is analysed individually for creditworthiness before the Group's standard payment and delivery terms and conditions are offered.
The Board of Directors determines concentrations of credit risk by quarterly monitoring the creditworthiness rating of existing customers and through a monthly review of the trade receivables' ageing analysis.
The Group has significant credit exposure arising from non-current receivables due from an affiliated company amounting $2,357,002 (2024: $2,152,539), representing 41% (2024: 40%) of the total trade and other receivables.
As the Group does not hold any collateral, the maximum exposure to credit risk from each class of financial instruments is the carrying amount of that financial instruments presented in the consolidated statement of financial position.
Expected credit loss assessment for trade receivables due from third parties
The Group applies a simplified approach to measure the expected credit losses for trade receivables. To measure expected credit losses on a collective basis, trade receivables are grouped based on similar credit risk and ageing.
The expected loss rates are based on the Group's historical credit losses experienced. The historical loss rates are then adjusted for current and forward-looking information on macroeconomic factors affecting the Group's customers.
The following table provides information about the exposure to credit risk and expected credit loss for the Group's trade receivables from third parties as at 30 September 2025.
2025 | 2024 | |
$ | $ | |
Current | 771,262 | 696,685 |
Past due 1 to 30 days | 46,666 | 90,779 |
Past due 31 to 60 days | 36,073 | 11,798 |
Past due over 60 days | 7,377 | 59,351 |
861,378 | 858,613 |
The Group assessed that the trade receivables due from third parties are subject to immaterial expected credit losses.
Expected credit loss assessment for trade and other receivables due from an affiliated company and third parties
Movement in the loss allowance for trade and other receivables are as follows:
2025 | 2024 | |
$ | $ | |
At 1 October | 4,406,063 | 4,406,063 |
Loss allowance for the year (Note 15) | 3,008 | - |
At 30 September | 4,409,071 | 4,406,063 |
For amount due from an affiliated company (Note 15), the Board of Directors has considered information that it has available internally about the affiliated company's past, current and expected operating performance and cash flow position. The Board of Directors monitors and assesses at each reporting date any indicator of significant increase in credit risk on the amount due from an affiliated company by considering their performance and any defaults on external debts.
The loss allowance was measured at an amount equal to the lifetime expected credit losses which is credit impaired.
Based on the Board of Director's review, no further loss allowance on the amount due from an affiliated company is required.
Other receivables due from third parties
For other receivables, the Board of Directors adopts a policy of dealing with high credit quality counterparties. The Board of Directors monitors and assesses at each reporting date any indicators of significant increase in credit risk on these other receivables. Other than those impaired as detailed in Note 15 to the financial statements, other receivables are measured at twelve-month expected credit loss and subject to immaterial credit loss.
Cash and cash equivalents
Cash at bank are mainly deposits with reputable banks with high credit ratings assigned by international credit rating agencies. Capital controls and specific approvals may be applied from time to time by the competent authorities in the relevant jurisdictions.
The Board of Directors monitors the credit ratings of counterparties regularly. Impairment on cash and cash equivalents and fixed deposits have been measured on the twelve-month expected loss. At the reporting date, the Group did not expect any credit losses from non-performance by the counterparties.
The cash and cash equivalents are categorised under the following countries:
2025 | 2024 | |
$ | $ | |
Singapore | 84,157 | 30,745 |
Vietnam | 111,318 | 229,993 |
Myanmar | 1,352,897 | 521,824 |
1,548,372 | 782,562 |
26.2 Market risks
Market risk arises from the Group's use of interest bearing, tradable and foreign currency financial instruments. It is the risk that the fair value or future cash flows of a financial instrument will fluctuate because of changes in foreign exchange rates (currency risk) or interest rates (interest rate risk).
Foreign currency risks
Foreign exchange risk arises when individual entities within the Group enter into transactions denominated in a currency other than their functional currency.
The currencies that give rise to this risk of the Group is primarily the Myanmar Kyat ("MMK") and Vietnamese Dong ("VND").
There is exposure to the MMK as some Myanmar subsidiaries have USD as their functional currency.
The Group has not entered into any currency forward exchange contracts as at the end of the reporting period.
The Group's material exposure from foreign currency denominated financial assets and financial liabilities as at the end of the reporting period is as follows:
USD | MMK | VND | Others | Total | |
$ | $ | $ | $ | $ | |
2025 | |||||
Financial assets | 1,746,859 | 3,411,578 | 522,368 | 50,640 | 5,731,445 |
Financial liabilities | (8,507,464) | (15,343,112) | (5,177,486) | (1,271,916) | (30,299,978) |
Net financial position | (6,760,605) | (11,931,534) | (4,655,118) | (1,221,276) | (24,568,533) |
Add: Net financial liabilities/(assets) denominated in the respective entities' functional currencies | 10,092,795 | 10,758,035 | 4,655,118 | (2,376) | 25,503,572 |
Net financial position, adjusted for financial assets/(liabilities) denominated in the respective entities' functional currencies | 3,332,190 | (1,173,499) | - | (1,223,652) | 935,039 |
2024 | |||||
Financial assets | 2,708,699 | 1,041,353 | 582,458 | 23,499 | 4,356,009 |
Financial liabilities | (7,222,668) | (8,955,691) | (8,770,606) | (739,296) | (25,688,261) |
Net financial position | (4,513,969) | (7,914,338) | (8,188,148) | (715,797) | (21,332,252) |
Add: Net financial liabilities/(assets) denominated in the respective entities' functional currencies | 4,641,336 | 8,892,637 | 8,186,171 | - | 21,720,144 |
Net financial position, adjusted for financial assets/(liabilities) denominated in the respective entities' functional currencies | 127,367 | 978,299 | (1,977) | (715,797) | 387,892 |
Gain/(Loss) before tax | ||
2025 | 2024 | |
$ | $ | |
Myanmar Kyat | ||
Strengthen against United States Dollar | (293,000) | 285,000 |
Weaken against United States Dollar | 293,000 | (285,000) |
Interest rate risk
The Group is not exposed to any significant interest rate risk as at the reporting date as it does not have significant variable interest-bearing financial assets and liabilities. The Group is primarily exposed to fixed rate interest bearing loans from a shareholder and loans receivable due from subsidiary, respectively. Accordingly, interest rate risk sensitivity analysis disclosure is deemed not necessary.
26.3 Liquidity risks
Liquidity risk arises from the Group's management of working capital and the finance charges and principal repayments on its debt instruments. It is a risk that the Group will encounter difficulty in meeting its financial obligations as they mature.
The following table details the Group's contractual maturity schedule for its non-derivative financial liabilities. The table has been drawn up based on undiscounted cash flows of financial liabilities based on the earlier of the contractual date or when the Group is expected to pay. The table includes both expected interest and principal cash flows.
Less than 1 year | Between 1 and 2 years | Between 2 and 5 years | Over 5 years | Total | |
$ | $ | $ | $ | $ | |
2025 | |||||
Trade and other payables (excluding sales tax) | 8,127,794 | - | - | - | 8,127,794 |
Loans from a shareholder | - | 4,723,055 | - | - | 4,723,055 |
Lease liabilities | 4,249,961 | 3,843,258 | 7,851,123 | 11,339,229 | 27,283,571 |
12,377,755 | 8,566,313 | 7,851,123 | 11,339,229 | 40,134,420 | |
2024 | |||||
Trade and other payables (excluding sales tax) | 8,173,765 | - | - | - | 8,173,765 |
Loans from a shareholder | - | - | 5,302,301 | - | 5,302,301 |
Lease liabilities | 2,826,044 | 3,818,752 | 7,543,108 | 3,264,420 | 17,452,324 |
10,999,809 | 3,818,752 | 12,845,409 | 3,264,420 | 30,928,390 |
Financial instruments and measurements
Financial instruments not measured at fair value
Financial instruments not measured at fair value include cash and cash equivalents, current trade and other receivables (excluding prepayments and sales tax), long term rental deposits and trade and other payables. Due to their short-term nature, the carrying amount of these current financial assets and financial liabilities measured at amortised costs approximate their fair value.
The carrying amounts of loans due to a shareholder approximate their fair value as the interest rates approximate the market interest rates for such liabilities.
The carrying amounts of non-current receivables and non-current rental deposits approximate their fair value due to insignificant effects of discounting.
27. Capital risk management policies and objectives
The Group manages its capital to continue as a going concern and maintains an optimal capital structure to maximise shareholder value. The Group sets the amount of capital it requires in proportion to risk. The Group manages its capital structure and adjusts it in light of changes to economic conditions and the risk characteristics of the underlying assets. To maintain or adjust the capital structure, the Group may issue new shares, convertible notes or enter into new debt arrangements.
The capital structure of the Group consists of equity attributable to the equity holders of the Company comprising other reserves and loans from a shareholder and convertible notes.
The Group's management reviews the capital structure on an annual basis. As part of this review, management considers the cost of capital, and the risks associated with each class of capital. The Group's overall strategy remains unchanged from 30 September 2024.
The Group is not subject to externally imposed capital requirements for the financial years ended30 September 2025 and 30 September 2024.
Related Shares:
Asia Strategic