30th Jan 2026 07:00
This announcement contains inside information for the purposes of Article 7 of the UK version of Regulation (EU) No 596/2014 which is part of UK law by virtue of the European Union (Withdrawal) Act 2018, as amended ("MAR"). Upon the publication of this announcement via a Regulatory Information Service, this inside information is now considered to be in the public domain.
30 January 2026
Thor Energy PLC
("Thor" or the "Company")
Quarterly Activities and Cash Flow Report October to December 2025
Thor Energy PLC ("Thor") (AIM, ASX: THR, OTCQB: THORF) is pleased to report on its activities for the Quarterly period October to December 2025.
Andrew Hume, CEO and Managing Director, Thor Energy Plc, commented:
"This final quarter of 2025 has fulfilled a pivotal year of strategic transformation for Thor Energy. I am delighted to report that we ended the year with a healthy financial position, having successfully reshaped the Company to prioritise the high-growth natural hydrogen and helium sector, whilst simultaneously reinforcing our strategic metals portfolio through portfolio rationalisation, intelligent monetisation and strong partnerships.
"At our flagship HY-Range Project (Regulated Substance Exploration Licence, RSEL 802) in South Australia, we continue to progress swiftly from concept to drill readiness. Following the exceptional results of May 2025's Phase 1 geochemical sampling program, we commenced Phase 2 in November, a design that is an extended monitoring campaign continuing through Q1 2026. This program enables rigorous measurement of gas flux over time and proactively ground-truths our high-grade anomalies. This high-fidelity dataset is a prerequisite for finalising the design of our major 2D seismic survey scheduled for mid-2026 and the subsequent drilling campaign.
"Crucially, this committed work program is supported by our successful non-dilutionary funding strategy. The 75% divestment of our US Uranium assets to Metals One and the 100% sale of the Molyhil Tungsten Project to Tivan Limited (completing post-period) simplified our portfolio and crucially facilitated the working capital necessary to advance our ambitions.
"Simultaneously, we have retained significant upside in our exciting South Australian copper-gold assets. The strategic investment of A$3.5 million into our investee company, EnviroCopper Limited, by an international energy company, validates the quality of these assets. With projects located within the renowned Copper Coast and historic Kapunda districts, we maintain material leverage to the region's significant copper and gold endowments. Through our well-thought-out corporate deal structures, Thor retains upside whilst ensuring our direct holding costs remain minimal.
"Thor enters 2026 as a focused, well-capitalised clean energy explorer, ready to unlock value across a curated and strategically diversified portfolio."
HY-RANGE PROJECT - "RSEL 802" - SOUTH AUSTRALIAN NATURAL HYDROGEN AND HELIUM
Building on the outstanding results of the Phase 1 survey reported on 7 July 2025-which identified hydrogen up to 3,000ppm and helium up to 27ppm-the Company commenced Phase 2 fieldwork during the quarter. Unlike standard spot-sampling or short-period monitoring, Phase 2 is being executed as a comprehensive monitoring programme which will provide the necessary information to confirm a consistent and productive natural hydrogen system, determine source to trap migration mechanism, and identify the specific pathways to aid prospect identification, maturation and integrated modelling. This campaign began in November 2025 and is scheduled to extend until March 2026, with work concentrated on the high prospectivity zones identified in Phase 1 (Figure 1), with new approaches being deployed which build on the learnings from Phase-1. Full details of the programme and results will be released when available.
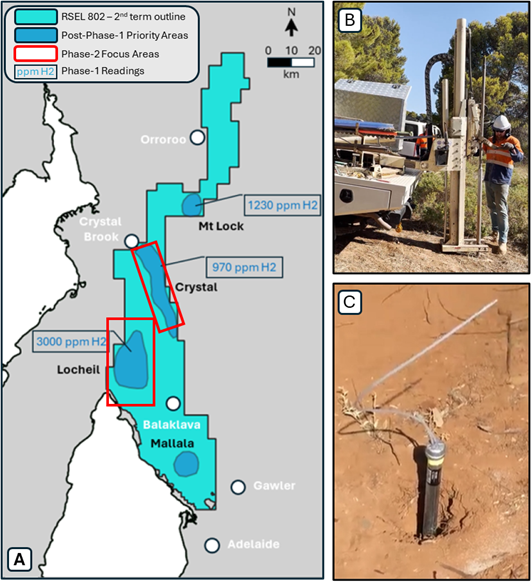
Figure 1A) RSEL 802 (2nd term) map illustrating priority areas identified following the Phase-1 geochemistry survey, and the location of Phase-2 focus areas
Figure 1B) Preparation of monitor site
Figure 1C) Mid installation process of monitor locations
Data from this ongoing geochemical programme will be integrated with our robust geological understanding and augmented by ancillary geophysical and geological studies, which will include core analysis and the interpretation of reprocessed legacy 2D seismic data.
Thor's integrated understanding forms the basis of design for our proprietary 2D exploration seismic acquisition campaign, targeted for mid-2026, with contract award expected during 2025 Q1. The results of this bespoke 2D seismic program will be pivotal for our natural hydrogen/helium project as we aim to integrate our findings, finalise prospect selection, and define drilling targets for fast-tracked exploration drilling. As a further benefit, the co-located Gas Storage Exploration Licences ("GSEL"), 804, 805 and 806 will also benefit from this work by helping to determine if suitable geological conditions could occur for the underground storage of hydrogen, natural gas or long-term sequestration of greenhouse gases.
STRATEGIC METALS PORTFOLIO - INTELLIGENT MONETISATION
US Uranium - Binding Agreement with DISA:
On 23 October 2025, Thor executed a full binding agreement with DISA Technologies, Inc. ("DISA"). This agreement allows DISA to evaluate and treat historically abandoned uranium mine waste dumps at Thor's Colorado projects using its patented High-Pressure Slurry Ablation ("HPSA") technology. Thor is entitled to a gross revenue share (sliding scale 2.5% to 4.0%) from the sale of recovered uranium and critical minerals, with no capital or operating expenditure required from Thor. Significantly, DISA received its final U.S. Nuclear Regulatory Commission ("NRC") Service Providers License during the quarter, paving the way for future deployment.
Molyhil Divestment:
Work continued during the quarter to satisfy conditions precedent regarding the sale of the Molyhil Tungsten Project ("FRAM JV") to Tivan Limited for a total consideration of A$6.56 million. This process was subsequently completed post-period on 19 January 2026, accompanied by a payment of A$2.25 million and capturing three equal annual payments of A$1,312,500 (totalling A$3,937,500), commencing September 2026.
RETAINING UPSIDE IN SOUTH AUSTRALIAN COPPER-GOLD & REE ASSETS
Whilst the Company has successfully monetised non-core metal exploration assets, we have strategically maintained significant exposure to copper-gold and critical rare earth elements ("REEs"), as essential components of the energy transition, aligned with Thor's fundamental strategic purpose. Furthermore, these assets host significant gold mineralisation, adding substantial value to the portfolio. This retention strategy is focused on our equity holding in EnviroCopper Limited ("ECL") and our direct 80% interest in the Alford East Copper-Gold Project.
On 27 October 2025, Thor announced that ECL had entered into a binding agreement with a large international energy company for a A$3.5 million investment to rapidly advance the Alford West and Kapunda projects. Thor's position in ECL continues to represent a strategic holding (20% post-period) with this investment ensuring that the Company maintains material upside exposure to these assets without the associated funding requirements.
These assets are located within South Australia's historic copper districts (Figure 2). The Alford West (held by ECL) and Alford East (Thor Energy, 80% and Operator) projects are situated within the world-famous Copper Coast area on the Yorke Peninsula, forming part of the prodigious Olympic Copper-Gold Province, with deposits interpreted as metasomatised IOCG systems with significant supergene enrichment. The Kapunda Project (held by ECL) represents a separate historic mining centre, characterised as a hybrid sedimentary-hydrothermal system with intense supergene enrichment. Both geological settings host oxide mineralisation, potentially amenable to low-impact In-Situ Recovery techniques.
Since these high-quality assets host significant recoverable copper, gold and REE mineralisation, Thor continues to maintain access to critical metals projects with minimal direct holding costs and the potential of timely pathways to commercialisation.
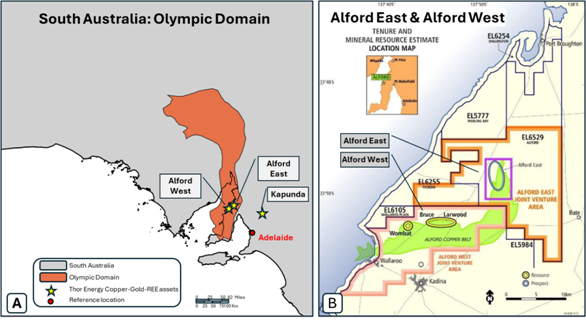
Figure 2A) Location of Thor South Australian metals assets. The Alford West and East projects are located within the southern portion of the Olympic Copper-Gold Province. The shaded area (red) represents the Olympic domain as defined by Tom Wise (2019), 'Prospectivity modelling of the Olympic Cu-Au Province', MESA Journal, vol. 90, no. 2, pp. 36-41
Figure 2B) Map zoomed to the Alford West / Alford East area of the northern Yorke Peninsula, illustrating overlap of the Alford Copper Belt (Green)
FINANCE, AND CASH MOVEMENTS
Cash Movement
Net cash outflows from Operating and Investing activities for the quarter of $63,000, which included outflows of $88,000 directly related to exploration activities. Thor ended the quarter with a cash balance of $1,660,000. Post period end, a further A$2,250,000 was received as a completion payment from Tivan (as announced on 19 January 2026).
Cashflows for the quarter include payments of $134,000 to Directors, comprising the CEO-Managing Director's salary and the Non-Executive Directors' salaries.
-ENDS-
The Board of Thor Energy Plc has approved this announcement and authorised its release.
For further information on the Company, please visit the website, or please contact the following:
Thor Energy PLC
Andrew Hume, Managing Director
Alastair Clayton, Non-Executive Chairman
Rowan Harland, Company Secretary
Tel: +61 (8) 6555 2950
Zeus Capital Limited (Nominated Adviser and Joint Broker)
Antonio Bossi / Darshan Patel / Liv Highton
Tel: +44 (0) 203 829 5000
SI Capital Limited (Joint Broker)
Nick Emerson
Tel: +44 (0) 1483 413 500
Yellow Jersey (Financial PR)
Dom Barretto / Shivantha Thambirajah
Tel: +44 (0) 20 3004 9512
About Thor Energy Plc
The Company is focused on natural Hydrogen, Helium and energy metals that are crucial in the shift to a clean energy economy, combined with portfolio exposure to precious metals. For further information on Thor Energy and to see an overview of its projects, please visit the Company's website at https://thorenergyplc.com/.
The Company confirms that it is not aware of any new information or data that materially affects the previously disclosed exploration results referenced in this announcement. Information included in the original market announcements that the form and context in which the Competent Person's findings are presented have not been materially modified from the original market announcements.
TENEMENT SCHEDULE
As of 31 December 2025, the consolidated entity holds an interest in the following Australian tenements:
Project | Tenement | Area kms2 | Area ha. | Holders | Interest |
HY-Range | RSEL 802 | 6332 | Go Exploration | 80.2% | |
Geo-Range | GSEL 804 | 2368 | Go Exploration | 80.2% | |
Geo-Range | GSEL 805 | 2389 | Go Exploration | 80.2% | |
Geo-Range | GSEL 806 | 1558 | Go Exploration | 80.2% | |
Project | Tenement | Area kms2 | Area ha. | Holders | Interest |
Molyhil * | EL22349 | 228.10 | Molyhil Mining Pty Ltd | 75% | |
Molyhil * | EL31130 | 9.51 | Molyhil Mining Pty Ltd | 75% | |
Molyhil * | ML23825 | 95.92 | Molyhil Mining Pty Ltd | 75% | |
Molyhil * | ML24429 | 91.12 | Molyhil Mining Pty Ltd | 75% | |
Molyhil * | ML25721 | 56.2 | Molyhil Mining Pty Ltd | 75% | |
Molyhil * | AA29732 | 38.6 | Molyhil Mining Pty Ltd | 75% | |
Molyhil * | MLS77 | 16.18 | Molyhil Mining Pty Ltd | 75% | |
Molyhil * | MLS78 | 16.18 | Molyhil Mining Pty Ltd | 75% | |
Molyhil * | MLS79 | 8.09 | Molyhil Mining Pty Ltd | 75% | |
Molyhil * | MLS80 | 16.18 | Molyhil Mining Pty Ltd | 75% | |
Molyhil * | MLS81 | 16.18 | Molyhil Mining Pty Ltd | 75% | |
Molyhil * | MLS82 | 8.09 | Molyhil Mining Pty Ltd | 75% | |
Molyhil * | MLS83 | 16.18 | Molyhil Mining Pty Ltd | 75% | |
Molyhil * | MLS84 | 16.18 | Molyhil Mining Pty Ltd | 75% | |
Molyhil * | MLS85 | 16.18 | Molyhil Mining Pty Ltd | 75% | |
Molyhil * | MLS86 | 8.05 | Molyhil Mining Pty Ltd | 75% | |
Bonya * | EL29701 | 204.5 | Molyhil Mining Pty Ltd | 40% | |
Bonya | EL32167 | 74.54 | Molyhil Mining Pty Ltd | 40% | |
Alford East | EL6529 | 315.1 | Hale Energy Pty Ltd | 80% oxide interest |
* Transfer of tenements to Tivan Limited completed post period.
USA mineral exploration licence portfolio
As of 31 December 2025, the consolidated entity holds 25% interest in the uranium and vanadium projects in USA States of Colorado and Utah as follows:
Claim Group | Serial Number | Claim Name | Area | Holders | Interest |
Vanadium King (Utah) | UMC445103 to UMC445202 | VK-001 to VK-100 | 100 blocks (2,066 acres) | Cisco Minerals Inc | 25% |
Radium Mountain (Colorado) | CMC292259 to CMC292357 | Radium-001 to Radium-099 | 99 blocks (2,045 acres) | Standard Minerals Inc | 25% |
Groundhog (Colorado) | CMC292159 to CMC292258 | Groundhog-001 to Groundhog-100 | 100 blocks (2,066 acres) | Standard Minerals Inc | 25% |
Appendix 5B
Mining exploration entity or oil and gas exploration entityquarterly cash flow report
Name of entity | ||
THOR ENERGY PLC | ||
ABN | Quarter ended ("current quarter") | |
121 117 673 | 31 December 2025 | |
Consolidated statement of cash flows | Current quarter$A'000 | Year to date (6 months)$A'000 | |
1. | Cash flows from operating activities | - - | - |
1.1 | Receipts from customers | ||
1.2 | Payments for | ||
(a) exploration & evaluation | (88) | (185) | |
(b) development | - | 0 | |
(c) production | - | 0 | |
(d) staff costs | (179) | (517) | |
(e) administration and corporate costs | (415) | (760) | |
1.3 | Dividends received (see note 3) | - | - |
1.4 | Interest received | - | - |
1.5 | Interest and other costs of finance paid | - | - |
1.6 | Income taxes paid | - | - |
1.7 | Government grants and tax incentives | - | - |
1.8 | Other | - | - |
1.9 | Net cash from / (used in) operating activities | (682) | (1,462) |
2. | Cash flows from investing activities | ||
2.1 | Payments to acquire or for: | ||
(a) entities | - | - | |
(b) tenements | 744 | 1,687 | |
(c) property, plant and equipment | - | - | |
(d) exploration & evaluation | - | - | |
(e) equity accounted investments | - | - | |
(f) other non-current assets (bonds) | - | - | |
2.2 | Proceeds from the disposal of: |
- |
- |
(a) entities | |||
(b) tenements (bond refunds) | - | - | |
(c) property, plant and equipment | - | - | |
(d) investments | - | - | |
(e) other non-current assets | - | -
| |
2.3 | Cash flows from loans to other entities | - | - |
2.4 | Dividends received (see note 3) | - | - |
2.5 | Other (Government grants) | - | - |
2.6 | Net cash from / (used in) investing activities | 744 | 1,687 |
3. | Cash flows from financing activities | - | -
|
3.1 | Proceeds from issues of equity securities (excluding convertible debt securities) | ||
3.2 | Proceeds from issue of convertible debt securities | - | - |
3.3 | Proceeds from exercise of options | - | |
3.4 | Transaction costs related to issues of equity securities or convertible debt securities | - | - |
3.5 | Proceeds from borrowings | - | - |
3.6 | Repayment of borrowings (lease liability) | - | - |
3.7 | Transaction costs related to loans and borrowings | - | - |
3.8 | Dividends paid | - | - |
3.9 | Other (funds received in advance of a placement) | - | - |
3.10 | Net cash from / (used in) financing activities | - | - |
4. | Net increase / (decrease) in cash and cash equivalents for the period | 63 | 225 |
4.1 | Cash and cash equivalents at beginning of period | 1,598 | 1,459 |
4.2 | Net cash from / (used in) operating activities (item 1.9 above) | (682) | (1,463) |
4.3 | Net cash from / (used in) investing activities (item 2.6 above) | 744 | 1,687 |
4.4 | Net cash from / (used in) financing activities (item 3.10 above) | - | - |
4.5 | Effect of movement in exchange rates on cash held | - | (23) |
4.6 | Cash and cash equivalents at end of period | 1,660 | 1,660 |
|
|
|
|
5. | Reconciliation of cash and cash equivalents at the end of the quarter (as shown in the consolidated statement of cash flows) to the related items in the accounts | Current quarter$A'000 | Previous quarter$A'000 |
5.1 | Bank balances | 1,660 | 1,598 |
5.2 | Call deposits | - | - |
5.3 | Bank overdrafts | - | - |
5.4 | Other (provide details) | ||
5.5 | Cash and cash equivalents at end of quarter (should equal item 4.6 above) | 1,660 | 1,598 |
6. | Payments to related parties of the entity and their associates | Current quarter$A'000 |
6.1 | Aggregate amount of payments to related parties and their associates included in item 1 | 134 |
6.2 | Aggregate amount of payments to related parties and their associates included in item 2 | - |
Note: if any amounts are shown in items 6.1 or 6.2, your quarterly activity report must include a description of, and an explanation for, such payments.
The amount at item 6.1 above represents fees paid to Non-Executive Directors, and remuneration paid to the Managing Director. | ||
7. | Financing facilities Note: the term "facility' includes all forms of financing arrangements available to the entity. Add notes as necessary for an understanding of the sources of finance available to the entity. | Total facility amount at quarter end$A'000 | Amount drawn at quarter end$A'000 |
7.1 | Loan facilities | - | - |
7.2 | Credit standby arrangements | - | - |
7.3 | Other (please specify) | - | - |
7.4 | Total financing facilities | - | - |
| |||
7.5 | Unused financing facilities available at quarter end | - | |
7.6 | Include in the box below a description of each facility above, including the lender, interest rate, maturity date and whether it is secured or unsecured. If any additional financing facilities have been entered into or are proposed to be entered into after quarter end, include a note providing details of those facilities as well. | ||
| |||
8. | Estimated cash available for future operating activities | $A'000 |
8.1 | Net cash from / (used in) operating activities (item 1.9) | (682) |
8.2 | (Payments for exploration & evaluation classified as investing activities) (item 2.1(d)) | - |
8.3 | Total relevant outgoings (item 8.1 + item 8.2) | (682) |
8.4 | Cash and cash equivalents at quarter end (item 4.6) | 1,660 |
8.5 | Unused finance facilities available at quarter end (item 7.5) | - |
8.6 | Total available funding (item 8.4 + item 8.5) | 1,660 |
8.7 | Estimated quarters of funding available (item 8.6 divided by item 8.3) | 2.4 |
Note: if the entity has reported positive relevant outgoings (ie a net cash inflow) in item 8.3, answer item 8.7 as "N/A". Otherwise, a figure for the estimated quarters of funding available must be included in item 8.7. | ||
8.8 | If item 8.7 is less than 2 quarters, please provide answers to the following questions: | |
8.8.1 Does the entity expect that it will continue to have the current level of net operating cash flows for the time being and, if not, why not? | ||
Answer: N/A | ||
8.8.2 Has the entity taken any steps, or does it propose to take any steps, to raise further cash to fund its operations and, if so, what are those steps and how likely does it believe that they will be successful? | ||
Answer: N/A | ||
8.8.3 Does the entity expect to be able to continue its operations and to meet its business objectives and, if so, on what basis? | ||
Answer: Yes
| ||
Note: where item 8.7 is less than 2 quarters, all of questions 8.8.1, 8.8.2 and 8.8.3 above must be answered. | ||
Compliance statement
1 This statement has been prepared in accordance with accounting standards and policies which comply with Listing Rule 19.11A.
2 This statement gives a true and fair view of the matters disclosed.
Date: 30 January 2026...........................................................
Authorised by: the Board....................................................................
(Name of body or officer authorising release - see note 4)
Notes
1. This quarterly cash flow report and the accompanying activity report provide a basis for informing the market about the entity's activities for the past quarter, how they have been financed and the effect this has had on its cash position. An entity that wishes to disclose additional information over and above the minimum required under the Listing Rules is encouraged to do so.
2. If this quarterly cash flow report has been prepared in accordance with Australian Accounting Standards, the definitions in, and provisions of, AASB 6: Exploration for and Evaluation of Mineral Resources and AASB 107: Statement of Cash Flows apply to this report. If this quarterly cash flow report has been prepared in accordance with other accounting standards agreed by ASX pursuant to Listing Rule 19.11A, the corresponding equivalent standards apply to this report.
3. Dividends received may be classified either as cash flows from operating activities or cash flows from investing activities, depending on the accounting policy of the entity.
4. If this report has been authorised for release to the market by your board of directors, you can insert here: "By the board". If it has been authorised for release to the market by a committee of your board of directors, you can insert here: "By the [name of board committee - eg Audit and Risk Committee]". If it has been authorised for release to the market by a disclosure committee, you can insert here: "By the Disclosure Committee".
5. If this report has been authorised for release to the market by your board of directors and you wish to hold yourself out as complying with recommendation 4.2 of the ASX Corporate Governance Council's Corporate Governance Principles and Recommendations, the board should have received a declaration from its CEO and CFO that, in their opinion, the financial records of the entity have been properly maintained, that this report complies with the appropriate accounting standards and gives a true and fair view of the cash flows of the entity, and that their opinion has been formed on the basis of a sound system of risk management and internal control which is operating effectively.
Related Shares:
Thor Energy