12th Feb 2026 07:00
APPENDIX 4D
SOUTH32 LIMITED
(ABN 84 093 732 597)
Results for announcement to the market
This page and the accompanying 63 pages comprise the half year end financial information given to the Australian Securities Exchange (ASX) under Listing Rule 4.2A. This statement includes the unaudited consolidated results of the South32 Group for the half year ended 31 December 2025 (H1 FY26) compared with the half year ended 31 December 2024 (H1 FY25).
The half year report should be read in conjunction with the Financial Report for the year ended 30 June 2025. Figures in italics indicate that an adjustment has been made since the financial information was previously reported.
US$M | H1 FY26 | H1 FY25 | % Change |
Revenue from continuing operations(a)(b) | 2,809 | 2,884 | (3%) |
Profit/(loss) after tax attributable to members[1] | 464 | 360 | 29% |
Other financial measures | |||
Underlying revenue(a)(b) | 4,008 | 3,850 | 4% |
Underlying earnings attributable to members1(a)(b) | 435 | 375 | 16% |
(a) On 29 August 2024, South32 sold its shareholding in Illawarra Metallurgical Coal to an entity owned by Golden Energy and Resources Pte Ltd and M Resources Pty Ltd[2]. As a result, Illawarra Metallurgical Coal was classified as a discontinued operation in the H1 FY26 and H1 FY25 results. Our H1 FY26 and H1 FY25 Group underlying financial measures include the results of Illawarra Metallurgical Coal for our period of ownership as well as finalisation adjustments for the upfront consideration.
(b) On 1 December 2025, South32 sold its shareholding in Cerro Matoso to an entity owned by CoreX Holding B.V[3]. As a result, Cerro Matoso was classified as a discontinued operation in the H1 FY26 and H1 FY25 restated results. Our H1 FY26 and H1 FY25 Group underlying financial measures include the financial contribution from Cerro Matoso prior to its sale.
Net tangible assets per share
Net tangible assets per ordinary share were US$2.02 as at 31 December 2025 (US$1.93 as at 30 June 2025)[4].
Dividends
The Board has resolved to pay an interim dividend of US 3.9 cents per share (fully-franked) for the half year ended 31 December 2025.
The record date for determining entitlements to dividends is 6 March 2026; payment date is 2 April 2026.
FINANCIAL RESULTS AND OUTLOOK HALF YEAR ENDED 31 DECEMBER 2025
ASX / LSE / JSE Share Code: S32; ADR: SOUHY
12 February 2026
South32 delivers strong financial results and growth in base metals
"Our consistent operating performance and higher base and precious metals prices underpinned strong financial results for the half.
"We delivered Underlying EBITDA of US$1.1B and 16 per cent growth in Underlying earnings to US$435M.
"We have today announced a fully-franked interim ordinary dividend of US 3.9 cents per share (US$175M) in respect of the December 2025 half year.
"Reflecting our strong financial position and positive outlook for the business, we have also increased our capital management program by US$100M to US$2.6B, with US$209M remaining to be returned to shareholders.
"FY26 production and Operating unit cost guidance is unchanged across our operated businesses, as we maintain a disciplined focus on delivering safe and reliable operating performance.
"We're continuing work to grow our base metals production and unlock value across multiple development horizons.
"At Hermosa, we advanced construction of our large-scale, long-life Taylor zinc-lead-silver project. We're also continuing work to unlock value from Hermosa's broader land package, today releasing further positive exploration drilling results from the Peake copper deposit.
"At Cannington, we have today announced a 28 per cent increase in the underground Ore Reserve, while also targeting further potential growth through both underground and open pit development options.
"Sierra Gorda progressed options to grow future copper production, advancing studies for the fourth grinding line project, and defining an exploration target at Catabela Northeast which highlights the potential for future mine life extension.
"As announced in December 2025, Mozal Aluminium will transition to care and maintenance in March 2026 due to the inability to secure sufficient and affordable electricity supply. We are working closely with our people and stakeholders through this change.
"I'd like to thank our teams around the world for their work to deliver these strong results, as we look to continue our positive momentum into the second half of the year."
Graham Kerr, South32 CEO
Financial Highlights
US$M | H1 FY26 | H1 FY25 | % Change |
Revenue from continuing operations[5][6] | 2,809 | 2,884 | (3%) |
Operating profit/(loss) from continuing operations5,6 | 532 | 488 | 9% |
Profit/(loss) after tax | 463 | 359 | 29% |
Profit/(loss) after tax attributable to members[7] | 464 | 360 | 29% |
Basic earnings/(loss) per share (US cents)[8] | 10.3 | 8.0 | 29% |
Ordinary dividends per share (US cents)[9] | 3.9 | 3.4 | 15% |
Ordinary shares on issue (million) | 4,486 | 4,517 | (0.7%) |
Other financial measures[10] |
|
|
|
Underlying revenue | 4,008 | 3,850 | 4% |
Underlying EBITDA | 1,107 | 1,018 | 9% |
Underlying EBITDA margin | 28.2% | 27.5% | 0.7% |
Underlying EBIT | 747 | 663 | 13% |
Underlying EBIT margin | 19.1% | 18.0% | 1.1% |
Underlying earnings attributable to members7 | 435 | 375 | 16% |
Basic Underlying earnings per share (US cents)8 | 9.7 | 8.3 | 17% |
ROIC | 11.3% | 9.5% | 1.8% |
Safety performance
Nothing is more important than the health, safety and wellbeing of our people. We continue to implement our global Safety Improvement Program, including investment in safety leadership through our LEAD Safely Every Day (LSED) program, together with further simplification of our systems and improved effectiveness of controls.
We achieved improved safety performance in H1 FY26, with lost time injury frequency (LTIF) reducing by 36% to 0.9 (FY25: 1.4) and total recordable injury frequency (TRIF) reducing by 24% to 2.8 (FY25: 3.7). Our leading indicator, significant hazard frequency, increased to 245 for H1 FY26 (FY25: 196), indicating an improved hazard awareness and a more proactive reporting culture.
Health and safety performance[11]
Performance metric | H1 FY26 | FY25 |
Fatalities from health and safety incidents | 0 | 1 |
Total lost time injury frequency (LTIF) | 0.9 | 1.4 |
Total recordable injury frequency (TRIF) | 2.8 | 3.7 |
Total significant hazard frequency | 245 | 196 |
People and culture
An inclusive culture and diverse workforce supports greater collaboration, innovation and performance. We continue to focus on building a workforce that represents the communities where we operate, and increasing the representation of women in leadership roles.
We measure our inclusion and diversity progress through a set of measurable objectives as described in the table below.
Inclusion and diversity performance11
Diversity representation (%) | FY26 measurable objective | H1 FY26 | FY25 |
Women in our workforce | Achieve at least 24.2%(a) | 24.1 | 23.1(b) |
Women on our Board | Maintain at least 40% | 50.0 | 54.5 |
Women in Lead Team | Maintain at least 40% | 42.9 | 50.0 |
Women in leadership roles | Achieve at least 23.6%(a) | 23.7 | 23.6(b) |
Local workforce diversity | Achieve at least 3 of 4 targets(a) | 3 | 5(b) |
(a) FY26 measurable objectives have been updated following the divestment of Cerro Matoso. Local workforce diversity has been revised to four targets from five targets, with an objective to achieve three of the four targets (75%).
(b) FY25 outcomes include Cerro Matoso. FY25 outcomes excluding Cerro Matoso which was divested on 1 December 2025 are as follows: Women in our workforce: 23.7%, Women in leadership roles: 23.1% and Local workforce diversity: 4 targets met representing 100%.
Addressing climate change
We have set a target to halve our net operational greenhouse gas (GHG) emissions (Scope 1 and 2) by FY35, from FY21 levels, and a long-term goal to achieve net zero GHG emissions across all scopes (Scope 1, 2 and 3) by 2050. Our approach to climate change is focused on positioning our portfolio for the energy transition, reducing our operational GHG emissions, supporting GHG emissions reduction across our value chains, and strengthening physical climate resilience.
A non-binding advisory resolution in relation to our second Climate Change Action Plan was passed by shareholders at our Annual General Meeting in October 2025, with 90% of the votes cast in favour of the resolution. Our Climate Change Action Plan 2025 is available on our website (www.south32.net).
Our operational GHG emissions increased by 16% in H1 FY26, reflecting an increased reliance on coal-fired electricity at Mozal Aluminium due to reduced hydroelectric power supply following drought conditions in Mozambique.
Greenhouse gas emissions
Million tonnes of CO2 equivalent | H1 FY26 | H1 FY25 |
Operational GHG emissions | 11.6 | 10.0 |
Business performance
Aluminium value chain
Alumina
Alumina saleable production increased by 3% to 2.6Mt in H1 FY26, as Brazil Alumina achieved record half year production and Worsley Alumina delivered planned volumes while completing scheduled calciner maintenance. FY26 production guidance remains unchanged at 5.1Mt.
Underlying EBITDA decreased by US$365M to US$178M in H1 FY26, for an operating margin of 18%, as improved volumes were more than offset by a 27% decrease in our average realised price of alumina.
Aluminium
Aluminium saleable production increased by 2% to 619kt in H1 FY26.
Hillside Aluminium saleable production was unchanged at 362kt in H1 FY26, as the smelter continued to test its maximum technical capacity, despite the impact of load-shedding. FY26 production guidance remains unchanged at 720kt[12].
Mozal Aluminium saleable production increased by 3% to 183kt in H1 FY26. On 16 December 2025[13], we announced Mozal Aluminium will transition to care and maintenance on or around 15 March 2026 due to the inability to secure sufficient and affordable electricity supply. FY26 production guidance for the period to March 2026 remains unchanged at 240kt12.
Brazil Aluminium saleable production increased by 16% to 74kt in H1 FY26. Despite this growth, production in Q2 FY26 was below plan due to unplanned pot outages and external energy disruptions. Production guidance has been revised to 135kt (from 160kt) in FY26 and 140kt (from 165kt) in FY27, as the smelter's operator implements measures to improve stability and continue the ramp-up of all three potlines.
Underlying EBITDA increased by US$115M to US$251M in H1 FY26, for an operating margin of 15%, reflecting a 6% increase in our average realised price of aluminium and lower alumina input prices at Hillside Aluminium and Brazil Aluminium.
Base metals
Sierra Gorda
Sierra Gorda payable copper equivalent production[14] was largely unchanged at 47.0kt in H1 FY26, with plant throughput and copper production in line with plan, while higher molybdenum output from the current mining phase offset lower planned gold production.
FY26 production guidance14 remains unchanged at 85.7kt (ore processed 21.8Mt, copper 72.0kt, molybdenum 1.2kt, gold 18.0koz and silver 600koz), with the operation positioned to potentially exceed guidance if strong volumes of molybdenum, gold and silver continue in H2 FY26.
Underlying EBITDA increased by US$178M to US$393M in H1 FY26, for an operating margin of 68%, due to higher realised metal prices.
Sierra Gorda continued to invest in studies and exploration to support future copper production growth.
Sierra Gorda is nearing completion of the feasibility study for the fourth grinding line project, which has the potential to increase plant throughput by ~20% to ~58Mtpa (100% basis), after which the joint venture partners will undertake an independent review to support a potential joint final investment decision in mid‑CY26.
At the Catabela Northeast prospect, adjacent to the Catabela pit, we have defined an Exploration Target[15] ranging from 1.1Bt @ 0.48% TCu to 2.9Bt @ 0.45% TCu, highlighting the potential for future mine life extension. Further exploration activity and technical assessment will be completed in CY26.
Cannington
Cannington payable zinc equivalent production[16] decreased by 18% to 102.8kt in H1 FY26, as higher ore processed was more than offset by lower planned metal grades. FY26 production guidance16 remains unchanged at 200.6kt (ore processed 1,850kdmt, zinc 40.0kt, lead 87.0kt and silver 8,200koz).
Underlying EBITDA increased by US$81M to US$211M in H1 FY26, for an operating margin of 53%, reflecting higher average realised metal prices and lower costs.
We continued work on underground and open pit life extension options at Cannington. This work has supported a further increase in the underground Ore Reserve by 3Mt to 13Mt in H1 FY26, extending the reserve life by approximately two years to FY33[17]. To support the extended mine life, we expect to invest additional capital expenditure of approximately US$65M to US$80M during FY27 and FY28, including for ventilation and electrical upgrades. Study work for the potential open pit development is expected to tollgate to pre-feasibility stage in CY26.
Hermosa project
We invested US$338M[18] of growth capital expenditure at Hermosa in H1 FY26, as we progressed construction of the Taylor zinc-lead-silver project, and completed the exploration decline for the Clark battery-grade manganese deposit.
At Taylor, we continue to sink the ventilation and main shafts, while progressing construction of surface infrastructure, following delivery of major components of the primary mill and flotation circuit.
FY26 growth capital expenditure guidance remains unchanged at US$750M[19].
As part of scheduled project execution at Taylor, an assessment of project milestones and capital expenditure will be completed in H2 FY26. This assessment will be informed by the pricing of additional underground and surface infrastructure packages scheduled to be awarded during this period.
We also invested US$14M in capitalised exploration at Hermosa in H1 FY26, continuing exploration drilling at the Peake deposit, which returned further high-grade copper results[20]. Further exploration and study work to support the potential to produce copper from Peake, leveraging the infrastructure for Taylor, will continue in H2 FY26.
Exploration
We invested US$30M (US$20M capitalised) in exploration programs at our existing operations and development options, including our Hermosa project and equity accounted investments (EAI) in H1 FY26.
We also invested US$15M in greenfield exploration programs in H1 FY26, as we continued work to discover our next generation of base metals mines.
We expanded our pipeline of copper exploration options in highly prospective regions as we entered into strategic alliances with Orogen Royalties Inc. targeting projects in western North America, and Aurum Discovery Limited, focusing on early stage prospects in Norway and Ireland.
Cerro Matoso
Cerro Matoso payable nickel production decreased by 19% to 15.0kt in H1 FY26, while Underlying EBITDA decreased by US$33M to US$11M in H1 FY26, reflecting a period of five months of operations prior to its divestment to a subsidiary of CoreX Holding B.V. on 1 December 2025[21].
Manganese
Australia Manganese
Australia Manganese production increased to 1,660kwmt in H1 FY26, as the operation achieved normalised production rates after executing its recovery plan following the impacts of Tropical Cyclone Megan. FY26 production guidance remains unchanged at 3,200kwmt, subject to potential wet season impacts.
Underlying EBITDA increased to US$107M in H1 FY26, with sales volumes increasing to 1,809kwmt, as shipping rates reached full capacity following the commissioning of new wharf infrastructure in Q4 FY25.
South Africa Manganese
South Africa Manganese production decreased by 2% to 1,057kwmt in H1 FY26, as the operation completed planned maintenance and underground development at Wessels. FY26 production guidance remains unchanged at 2,000kwmt, with further planned maintenance scheduled in Q3 FY26.
Underlying EBITDA decreased by US$20M to US$8M in H1 FY26, due to lower average realised manganese prices.
Financial performance
Profit and Loss
The Group's profit after tax attributable to members increased by US$104M to US$464M in H1 FY26, as we delivered strong operating results and capitalised on higher commodity prices. Underlying earnings attributable to members increased by US$60M to US$435M in H1 FY26. A reconciliation of profit/(loss) to Underlying earnings attributable to members is set out on page 10.
Underlying EBITDA increased by US$89M (or 9%) to US$1,107M for a Group operating margin of 28.2% (H1 FY25: 27.5%). Our strong financial results were driven by broadly higher commodity prices (+US$131M), notably copper, silver and aluminium, lower controllable costs (+US$44M), and the restart of operations at Australia Manganese (+US$100M). These benefits more than offset lower contributions from Illawarra Metallurgical Coal (IMC) (-US$50M) and Cerro Matoso (-US$21M) post divestment, as we continued to streamline our portfolio towards higher-margin businesses in critical metals.
Underlying EBIT increased by US$84M (or 13%) to US$747M in H1 FY26, as Underlying depreciation and amortisation was largely unchanged.
Cash Flow
Group free cash flow from operations, excluding EAIs, was an outflow of US$183M in H1 FY26 (H1 FY25: US$116M outflow), which reflected an increase in growth capital expenditure at Hermosa (-US$90M) and a temporary build in working capital due to higher commodity prices and the timing of sales.
Separately, we received distributions[22] of US$240M (H1 FY25: US$23M) from our EAIs in H1 FY26. This included a record distribution of US$180M from Sierra Gorda (H1 FY25: US$86M), reflecting strong operating performance and higher metal prices, and US$60M from our manganese business (H1 FY25: US$63M of funding) as we finalised external insurance recoveries related to Australia Manganese.
Group capital expenditure, excluding EAIs, exploration and intangibles, increased by US$41M to US$498M in H1 FY26, as higher growth capital expenditure at Hermosa (-US$90M) was partially offset by lower sustaining capital expenditure (+US$77M) following the divestments of IMC and Cerro Matoso.
Capital expenditure for our Sierra Gorda EAI, excluding exploration and intangibles, increased by US$10M to US$116M in H1 FY26, as the operation continued to invest in deferred stripping activity.
Capital expenditure for our manganese EAI, excluding exploration and intangibles, decreased by US$8M to US$64M in H1 FY26, as Australia Manganese executed its recovery plan in FY25, while South Africa Manganese completed work to access new mining areas at Wessels.
We returned US$152M to shareholders during H1 FY26, with US$117M in fully-franked ordinary dividends in respect of H2 FY25, and US$35M via our on-market share buy-back[23].
Balance Sheet
The Group finished the period with net debt of US$25M, with strong operating results and higher EAI distributions supporting our investment in growth at Hermosa (-US$338M) and returns to shareholders (-US$152M).
Dividends and Capital Management
Our unchanged capital management framework supports investment in our business and rewards shareholders as our financial performance improves. Consistent with our policy to distribute a minimum 40% of Underlying earnings attributable to members as ordinary dividends, the Board has resolved to pay a fully-franked interim ordinary dividend of US 3.9 cents per share (US$175M) in respect of H1 FY26, representing 40% of Underlying earnings attributable to members.
Reflecting our strong financial position and positive outlook for the business, we have also increased our capital management program by US$100M to US$2.6B, with US$209M remaining to be returned to shareholders by 26 February 2027[24].
Earnings reconciliation
Consistent with our accounting policies, various items are excluded from the Group's profit/(loss) to derive Underlying earnings[25]. Total adjustments to derive H1 FY26 Underlying EBIT (+US$184M), shown in the table below, include:
− | Significant items (+US$54M): recognition of employee separation costs and termination of contractual arrangements (+US$28M), and the write-down of raw materials and consumables (+US$26M), at Mozal Aluminium as the smelter transitions to care and maintenance[26]; |
− | Joint venture adjustments[27] (+US$241M): to reconcile the equity accounting position to a proportional consolidation basis for our manganese and Sierra Gorda EAIs; |
− | Gain on the disposal of subsidiaries and joint operations (-US$21M): recognition of cash proceeds from finalisation of the upfront consideration for the sale of IMC (-US$19M) and gain on disposal of Cerro Matoso (-US$2M); |
− | Impairment reversal of financial assets (-US$77M): periodic revaluation of the shareholder loan receivable from Sierra Gorda.An offsetting amount is recorded in the Sierra Gorda joint venture adjustments noted above; and |
− | Gain on non-trading derivative instruments and contingent consideration measured at fair value through profit and loss (-US$21M): revaluation of the contingent consideration receivable[28] from the sale of IMC reflecting lower metallurgical coal prices (+US$33M) and determination that no contingent consideration is payable[29] (-US$55M) in relation to our acquisition of Sierra Gorda. |
Further information on these adjustments is included in Note 3 Segment information to the financial statements on page 43.
Profit/(loss) to Underlying EBITDA reconciliation
US$M | H1 FY26 | H1 FY25 |
Operating profit/(loss) from continuing operations | 532 | 488 |
Operating profit/(loss) from discontinued operations | 31 | 32 |
Adjustments to derive Underlying EBIT: |
|
|
Significant items | 54 | - |
Joint venture adjustments27 | 241 | 22 |
(Gains)/losses on the disposal of subsidiaries and joint operations | (21) | 47 |
Exchange rate (gains)/losses on the restatement of monetary items | 8 | 7 |
Impairment losses/(reversals) of financial assets | (77) | 71 |
(Gains)/losses on non-trading derivative instruments and contingent consideration measured at fair value through profit and loss | (21) | (4) |
Total adjustments to derive Underlying EBIT | 184 | 143 |
Underlying EBIT | 747 | 663 |
Underlying depreciation and amortisation | 360 | 355 |
Underlying EBITDA | 1,107 | 1,018 |
Profit/(loss) to Underlying earnings attributable to members reconciliation
US$M | H1 FY26 | H1 FY25 |
Profit/(loss) after tax attributable to members | 464 | 360 |
Total adjustments to derive Underlying EBIT | 184 | 143 |
Total adjustments to derive Underlying net finance costs | (86) | (152) |
Total adjustments to derive Underlying income and royalty related tax expense | (127) | 24 |
Underlying earnings attributable to members | 435 | 375 |
Earnings analysis
The following key factors influenced Underlying EBIT in H1 FY26, relative to H1 FY25.
Reconciliation of movements in Underlying EBIT (US$M)[30][31]
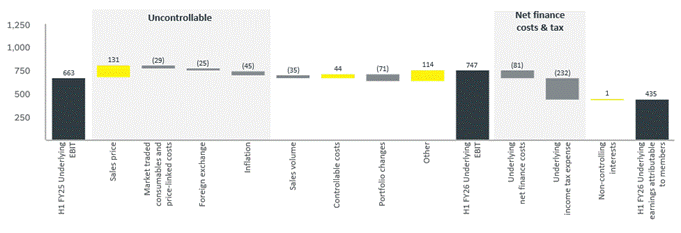
Earnings analysis | US$M | Commentary |
H1 FY25 Underlying EBIT | 663 |
|
Change in sales price | 131 | Higher average realised prices for our commodities, including: Silver (+US$142M) Copper (+US$137M) Aluminium (+US$100M) Partially offset by lower average realised prices for alumina (-US$258M) as prices declined from elevated levels in the prior period |
Net impact of price-linked costs | (29) | Higher aluminium smelter raw material input prices, primarily coke (-US$22M) Higher price-linked royalties at Cannington (-US$2M) |
Change in exchange rates | (25) | Stronger South African rand (-US$20M) and Brazilian real (-US$10M) Partially offset by a weaker Australian dollar (+US$5M) |
Change in inflation | (45) | General inflation across Australia (-US$19M), South America (-US$10M) and Southern Africa (-US$12M) Inflation-linked indexation of electricity prices at Hillside Aluminium (-US$4M) |
Change in sales volume | (35) | Higher volumes at Worsley Alumina (+US$60M) and Brazil Aluminium (+US$35M) More than offset by lower volumes at Hillside Aluminium (-US$30M) and Mozal Aluminium (-US$34M), reflecting the timing of shipments, and Cannington (-US$67M) |
Controllable costs | 44 | Inventory and volume related movements (+US$28M) primarily due to higher inventory at Mozal Aluminium as we manage customer commitments ahead of the smelter transitioning to care and maintenance Lower maintenance and contractor costs (+US$8M), primarily at Mozal Aluminium |
Portfolio changes | (71) | Reflects divestment of IMC (-US$50M) in August 2024 and divestment of Cerro Matoso (-US$21M) in December 2025 |
Other | 114 | Reflects the resumption of normalised production rates at Australia Manganese (+US$100M) following the impacts of Tropical Cyclone Megan |
H1 FY26 Underlying EBIT | 747 |
|
Net finance income/(costs)
The Group's Underlying net finance costs decreased by US$11M to US$81M in H1 FY26. These costs primarily comprised the unwinding of the discount applied to our closure and rehabilitation provisions (US$65M), interest on lease liabilities (US$29M), largely for our multi-fuel co-generation facility at Worsley Alumina, and interest on our US$700M of senior unsecured notes (US$16M).
Underlying net finance income/(costs) reconciliation
US$M | H1 FY26 | H1 FY25 |
Unwind of discount applied to closure and rehabilitation provisions | (65) | (65) |
Interest on lease liabilities | (29) | (29) |
Interest on senior unsecured notes | (16) | (16) |
Interest income on cash and cash equivalents | 32 | 30 |
Other | (3) | (12) |
Underlying net finance costs | (81) | (92) |
Add back earnings adjustment for exchange rate variations on net cash/(debt) | (25) | 37 |
Joint venture adjustments[32] | 111 | 115 |
Total adjustments to derive Underlying net finance costs | 86 | 152 |
Remove net finance costs from discontinued operations | 3 | 6 |
Net finance income/(costs) | 8 | 66 |
Tax expense
The Group's Underlying income tax and royalty related taxation expense increased by US$35M to US$232M in H1 FY26, for an Underlying effective tax rate (ETR) of 34.2% (FY25: 35.0%). Our Group Underlying ETR reflects the corporate tax rates[33] and royalty related taxes[34] of the jurisdictions in which we operate and our geographical earnings mix.
The Underlying ETR for our manganese business was 62.5% in H1 FY26, including the royalty related tax34 at Australia Manganese and the derecognition of certain deferred tax assets. The Underlying ETR for our Sierra Gorda EAI was 32.8% in H1 FY26, reflecting royalty related tax34.
Underlying income tax expense (including royalty related taxation) reconciliation
US$M | H1 FY26 | H1 FY25 |
Underlying EBIT | 747 | 663 |
Include: Underlying net finance costs | (81) | (92) |
Remove: Share of (profit)/loss of EAIs | 13 | 13 |
Underlying profit/(loss) before tax | 679 | 584 |
|
| |
Income tax expense/(benefit) from continuing operations | 108 | 198 |
Income tax expense/(benefit) from discontinued operations | (3) | 23 |
Tax effect of other adjustments to derive Underlying EBIT | 7 | - |
Tax effect of other adjustments to derive Underlying net finance costs | 7 | (11) |
Exchange rate variations on tax balances | 16 | (20) |
Joint venture adjustments relating to income tax32 | 72 | (1) |
Joint venture adjustments relating to royalty related tax32 | 25 | 8 |
Total adjustments to derive Underlying income tax (expense)/benefit | 127 | (24) |
Underlying income tax expense/(benefit) | 232 | 197 |
Underlying effective tax rate | 34.2% | 33.7% |
Cash flow
Group free cash flow from operations, excluding EAIs, was an outflow of US$183M in H1 FY26 (H1 FY25: US$116M outflow), which reflected an increase in growth capital expenditure at Hermosa (-US$90M) as well as a temporary build in working capital.
Working capital increased by US$130M in H1 FY26, due to higher commodity prices, the timing of sales from Mozal Aluminium to manage customer commitments in H2 FY26, and movements in payables. A planned drawdown of inventories at Mozal Aluminium is expected to add to the Group's cash generation in H2 FY26.
Separately, we received distributions[35] of US$240M (H1 FY25: US$23M) from our EAIs in H1 FY26. This included a record distribution of US$180M from Sierra Gorda (H1 FY25: US$86M), reflecting strong operating performance and higher metal prices, and US$60M from our manganese business (H1 FY25: US$63M of funding) as we finalised external insurance recoveries related to Australia Manganese.
Free cash flow from operations excluding EAIs
US$M | H1 FY26 | H1 FY25 |
Operating profit/(loss) from continuing and discontinued operations | 563 | 520 |
Non-cash or non-operating items | 191 | 280 |
Share of (profit)/loss from EAIs | (115) | (80) |
(Gain)/loss from sale of operations | (21) | 47 |
Change in working capital | (130) | (267) |
Cash generated from operations | 488 | 500 |
Total capital expenditure, excluding EAIs | (524) | (478) |
Operating cash flows generated from operations after capital expenditure | (36) | 22 |
Net interest paid[36] | (18) | (22) |
Income tax paid | (129) | (116) |
Free cash flow from operations | (183) | (116) |
Working capital movement
US$M | H1 FY26 | Commentary |
Trade and other receivables | 16 | Collection of receivables, partially offset by higher commodity prices in Q2 FY26 |
Inventories | (30) | Increase in finished good inventories in our aluminium value chain due to the timing of sales at Mozal Aluminium |
Trade and other payables | (101) | Timing of payments to suppliers |
Provisions and other liabilities | (15) |
|
Total working capital movement | (130) |
|
Capital expenditure
The Group's capital expenditure[37], excluding EAIs, increased by US$46M to US$524M in H1 FY26, as higher growth capital expenditure at Hermosa was partially offset by lower sustaining capital expenditure:
− | Safe and reliable capital expenditure, including Cerro Matoso (US$6M), decreased by US$77M to US$113M, reflecting a material reduction in sustaining capital intensity following the divestment of IMC; |
− | Improvement and life extension capital expenditure, including Cerro Matoso (US$2M), increased by US$28M to US$47M, as we progressed the development of new mining areas at Worsley Alumina; |
− | Growth capital expenditure increased by US$90M to US$338M[38] at Hermosa as we progressed critical path shaft sinking and construction of surface infrastructure for the Taylor zinc-lead-silver project, and completed the exploration decline for the Clark battery-grade manganese deposit; and |
− | Intangibles and capitalised exploration expenditure increased by US$5M to US$26M as we continued multiple exploration programs targeting base metals in highly prospective mineral belts. |
Our share of capital expenditure for our material EAIs was unchanged at US$185M in H1 FY26:
− | Capital expenditure for our Sierra Gorda EAI increased by US$7M to US$120M, as the operation continued its investment in deferred stripping; and |
− | Capital expenditure for our manganese EAIs decreased by US$7M to US$65M, as Australia Manganese executed its recovery plan in FY25, while South Africa Manganese completed work to access new mining areas at Wessels. |
Capital expenditure (South32 share)37
US$M | H1 FY26 | H1 FY25 |
Safe and reliable capital expenditure | (107) | (120) |
Improvement and life extension capital expenditure | (45) | (19) |
Growth capital expenditure | (338) | (248) |
Intangibles and the capitalisation of exploration expenditure | (26) | (21) |
Discontinued operations(a) | (8) | (70) |
Total capital expenditure (excluding EAIs) | (524) | (478) |
EAIs capital expenditure | (185) | (185) |
Total capital expenditure (including EAIs) | (709) | (663) |
(a) Reflects Cerro Matoso (H1 FY26: US$6M safe and reliable capital expenditure and US$2M improvement and life extension capital expenditure; H1 FY25: US$13M safe and reliable capital expenditure) and IMC (H1 FY26: nil; H1 FY25: US$57M safe and reliable capital expenditure).
Balance sheet
The Group finished the period with net debt of US$25M, with strong operating results and higher EAI distributions supporting our investment in growth at Hermosa (-US$338M) and returns to shareholders (-US$152M).
We continue to prioritise a strong balance sheet and investment grade credit rating through the cycle. Our current BBB+/Baa1 credit ratings were reaffirmed by S&P Global Ratings and Moody's, respectively, during CY25. We also retain access to significant liquidity, with our undrawn US$1.4B sustainability-linked revolving credit facility maturing in December 2028.
Net cash/(debt)
US$M | H1 FY26 | FY25 |
Cash and cash equivalents | 1,664 | 1,757 |
Lease liabilities | (733) | (713) |
Other interest bearing liabilities | (956) | (921) |
Net cash/(debt)(a) | (25) | 123 |
(a) FY25 net cash includes Cerro Matoso which was classified as held for sale.
Dividends and capital management
Our unchanged capital management framework supports investment in our business and rewards shareholders as our financial performance improves. Consistent with our policy to distribute a minimum 40% of Underlying earnings attributable to members as ordinary dividends, the Board has resolved to pay a fully-franked interim ordinary dividend of US 3.9 cents per share (US$175M) in respect of H1 FY26, representing 40% of Underlying earnings attributable to members.
Reflecting our strong financial position and positive outlook for the business, we have also increased our capital management program by US$100M to US$2.6B, with US$209M remaining to be returned to shareholders by 26 February 2027[39].
Dividends announced
Period | Dividend per share(US cents) | US$M | Franking | Pay-out ratio |
H1 FY24 | 0.4 | 18 | 100% | 45% |
H2 FY24 | 3.1 | 140 | 100% | 41% |
H1 FY25 | 3.4 | 154 | 100% | 41% |
H2 FY25 | 2.6 | 117 | 100% | 40% |
H1 FY26 | 3.9 | 175 | 100% | 40% |
South32 shareholders registered on the South African branch register will not be able to dematerialise or rematerialise their shareholdings between 4 and 6 March 2026 (both dates inclusive), nor will transfers to/from the South African branch register be permitted between 26 February and 6 March 2026 (both dates inclusive).
Details of the currency exchange rates applicable for the dividend will be announced to the relevant stock exchanges. Further dividend information is available on our website (www.south32.net).
South32 American Depositary Receipts (ADRs) each represent five fully paid ordinary shares in South32 and ADR holders will receive dividends accordingly, subject to the terms of the Depositary Agreement.
Dividend timetable | Date |
Announce currency conversion into South African rand | 27 February 2026 |
Last day to trade cum dividend on the Johannesburg Stock Exchange (JSE) | 3 March 2026 |
Ex-dividend date on the JSE | 4 March 2026 |
Ex-dividend date on the ASX and London Stock Exchange (LSE) | 5 March 2026 |
Record date (including currency election date for ASX) | 6 March 2026 |
Payment date | 2 April 2026 |
OUTLOOK
Production
FY26 production guidance remains unchanged across our operated assets, as we continue to focus on delivering safe and reliable operations.
Production guidance for non-operated Brazil Aluminium has been revised to 135kt (from 160kt) in FY26 and 140kt (from 165kt) in FY27, as the smelter's operator implements measures to improve stability and continue the ramp-up of all three potlines.
Production guidance (South32 share)
| H1 FY26 | FY26e(a) | FY27e(a) | Key FY26e guidance commentary |
Worsley Alumina | Guidance unchanged | |||
Alumina production (kt) | 1,893 | 3,750 | 3,900 | Planned calciner maintenance completed in Q1 FY26 |
Brazil Alumina (non-operated) |
|
| Guidance unchanged | |
Alumina production (kt) | 709 | 1,360 | 1,360 | Expected to continue to test nameplate capacity |
Brazil Aluminium (non-operated) |
|
| FY26 guidance revised to 135kt (from 160kt) | |
Aluminium production (kt) | 74 | ↓135 | ↓140 | Operator's revised ramp-up profile |
Hillside Aluminium[40] |
|
| Guidance unchanged | |
Aluminium production (kt) | 362 | 720 | 720 | Expected to continue to test maximum technical capacity |
Mozal Aluminium40 |
|
| Guidance unchanged | |
Aluminium production (kt) | 183 | 240 | N/A | Transitioning to care and maintenance in March 2026 |
Sierra Gorda (non-operated) |
|
| Guidance unchanged | |
Ore processed (Mt) | 10.9 | 21.8 | 21.8 | Potential upside to guidance from by-product volumes |
Payable copper equivalent production (kt)[41] | 47.0 | 85.7 | 90.2 | |
Payable copper production (kt) | 36.3 | 72.0 | 79.0 | |
Payable molybdenum production (kt) | 1.2 | 1.2 | 0.5 | |
Payable gold production (koz) | 10.9 | 18.0 | 20.0 | |
Payable silver production (koz) | 348 | 600 | 700 | |
Cannington |
|
| Guidance unchanged | |
Ore processed (kdmt) | 1,009 | 1,850 | 1,750 | Delivered improved underground mining rates in H1 FY26 |
Payable zinc equivalent production (kt)[42] | 102.8 | 200.6 | 204.7 | |
Payable silver production (koz) | 4,487 | 8,200 | 8,700 | |
Payable lead production (kt) | 42.3 | 87.0 | 80.0 | |
Payable zinc production (kt) | 18.7 | 40.0 | 43.0 | |
Australia Manganese |
|
| Guidance unchanged | |
Manganese ore production (kwmt) | 1,660 | 3,200 | 3,200 | Returned to normalised production rates |
South Africa Manganese |
|
| Guidance unchanged | |
Manganese ore production (kwmt) | 1,057 | 2,000 | 2,000 | Further maintenance scheduled in Q3 FY26 |
(a) The denotation (e) refers to an estimate or forecast year.
Costs and capital expenditure
Operating unit cost performance and guidance
Stable production and disciplined cost management saw Operating unit costs track in line with or below expectations in H1 FY26. As a result, FY26 Operating unit cost guidance has been maintained across all operated assets.
While Operating unit cost guidance is not provided for our aluminium smelters, their cost profile will continue to be influenced by producer currencies, and the prices of raw material inputs and energy.
Operating unit cost[43]
| H1 FY25 | H1 FY26 | Prior FY26e(a),[44] | New FY26e(a), [45] | H1 FY26 to H1 FY25 commentary FY26 new guidance to FY26 prior guidance commentary |
Worsley Alumina |
|
|
|
|
|
(US$/t) | 306 | 318 | 310 | 310 | H1 FY26: higher volumes and lower caustic soda consumption, offset by inflation and restructuring costs
FY26e guidance unchanged, with lower costs expected in H2 FY26 due to lower labour costs and deferral of non-essential activity |
Brazil Alumina (non-operated) |
|
|
|
|
|
(US$/t) | 320 | 320 | Not provided | Not provided | H1 FY26: higher volumes offset by a stronger Brazilian real
FY26e: will continue to be influenced by energy and raw material input prices |
Brazil Aluminium (non-operated) |
|
|
|
|
|
(US$/t) | 3,377 | 2,919 | Not provided | Not provided | H1 FY26: higher volumes and lower alumina input prices, more than offset a stronger Brazilian real
FY26e: will continue to be influenced by the price of raw material inputs and lower expected volumes in H2 FY26 |
Hillside Aluminium |
|
|
|
|
|
(US$/t) | 2,351 | 2,295 | Not provided | Not provided | H1 FY26: lower alumina input prices, more than offset a stronger South African rand and higher energy prices
FY26e: will continue to be influenced by the price of raw material inputs, the South African rand and inflation-linked energy costs |
Mozal Aluminium |
|
|
|
|
|
(US$/t) | 2,425 | 2,556 | Not provided | Not provided | H1 FY26: lower pot relining and maintenance spend, offset by higher alumina input prices and a stronger South African rand
FY26e: will continue to be influenced by the price of raw material inputs and the South African rand |
Sierra Gorda (non-operated) |
|
|
|
|
|
(US$/t)(b) | 17.1 | 17.0 | 17.0 | 17.0 | H1 FY26: lower ore mined as we increased development activity, partially offset by a drawdown in stockpiles
FY26e guidance unchanged
|
Cannington |
|
|
|
|
|
(US$/t)(b) | 197 | 183 | 205 | 205 | H1 FY26: higher ore processed and inventory movements, partially offset by higher price-linked royalties
FY26e guidance unchanged, with potentially higher price-linked royalties if metal prices remain at current levels |
Australia Manganese |
|
|
|
|
|
(US$/dmtu, FOB) | - | 2.31 | 2.40 | 2.40 | H1 FY26: costs in line as the operation delivered planned volumes
FY26e guidance unchanged |
South Africa Manganese |
|
|
|
|
|
(US$/dmtu, FOB) | 3.13 | 3.09 | 3.10 | 3.10 | H1 FY26: drawdown of low-cost inventory more than offset a stronger South African rand
FY26e guidance unchanged |
(a) The denotation (e) refers to an estimate or forecast year.
(b) US dollar per tonne of ore processed. Periodic movements in finished product inventory may impact Operating unit costs.
Capital expenditure guidance (excluding exploration and intangibles)
FY26 Group capital expenditure guidance, including EAIs, remains unchanged at US$1,400M, with:
− | Safe and reliable: revised to US$225M (from US$240M), due to the timing of spend at Brazil Alumina; |
− | Improvement and life extension: remains unchanged at US$100M as we continue to develop new mining areas at Worsley Alumina; and |
− | Growth: Hermosa capital expenditure remains unchanged at US$750M[46], as we progress construction of our large-scale, long-life Taylor zinc-lead-silver project. |
FY26 capital expenditure for our material EAIs has been revised to US$325M (from US$310M), with:
− | Sierra Gorda: revised to US$214M (from US$195M), due to higher deferred stripping activity; and |
− | Manganese: revised to US$111M (from US$115M), as we invest in water management infrastructure and mobile equipment at Australia Manganese, and planned capital works at South Africa Manganese. |
Capital expenditure excluding exploration and intangibles (South32 share)
US$M | H1 FY26 | FY26e(a) |
Worsley Alumina | 32 | 55 |
Brazil Alumina | 5 | 40 |
Brazil Aluminium | 9 | 15 |
Hillside Aluminium | 34 | 65 |
Mozal Aluminium[47] | 4 | 4 |
Cannington | 23 | 40 |
Cerro Matoso[48] | 6 | 6 |
Safe and reliable capital expenditure (excluding EAIs) | 113 | 225 |
Worsley Alumina | 41 | 90 |
Cerro Matoso48 | 2 | 2 |
Other operations | 4 | 8 |
Improvement and life extension capital expenditure (excluding EAIs) | 47 | 100 |
Hermosa | 338 | 750 |
Growth capital expenditure | 338 | 750 |
Total capital expenditure (excluding EAIs) | 498 | 1,075 |
Total capital expenditure (including EAIs) | 678 | 1,400 |
Capital expenditure for EAIs excluding exploration and intangibles (South32 share)
US$M | H1 FY26 | FY26e(a) |
Sierra Gorda | 111 | 200 |
Australia Manganese | 45 | 80 |
South Africa Manganese | 13 | 25 |
Safe and reliable capital expenditure (EAIs) | 169 | 305 |
Sierra Gorda | 5 | 14 |
Australia Manganese | 1 | 1 |
South Africa Manganese | 5 | 5 |
Improvement and life extension capital expenditure (EAIs) | 11 | 20 |
Total capital expenditure (EAIs) | 180 | 325 |
(a) The denotation (e) refers to an estimate or forecast year.
Capitalised exploration guidance
FY26 Group capitalised exploration guidance, including EAIs, is unchanged at US$40M as we progress base metals exploration programs across our portfolio.
Capitalised exploration (South32 share)
US$M | H1 FY26 | FY26e(a) |
Capitalised exploration (excluding EAIs) | 16 | 30 |
EAIs capitalised exploration | 4 | 10 |
Capitalised exploration (including EAIs) | 20 | 40 |
(a) The denotation (e) refers to an estimate or forecast year.
Other expenditure guidance
Other expenditure items presented below are on a proportional consolidation basis including our manganese and Sierra Gorda EAIs.
| H1 FY26 | FY26e(a) | Commentary |
Group and unallocated expense in Underlying EBIT (excluding greenfield exploration and third party products and services EBIT) | |||
(US$M) | 33 | 120 | Guidance unchanged
H1 FY26 reflected favourable inter-group inventory adjustments in our aluminium value chain |
Hermosa expenses included in Underlying EBIT | |||
(US$M) | 28 | 40 | Guidance unchanged |
Underlying depreciation and amortisation | |||
(US$M) | 360 | ↓720 | Guidance revised to US$720M (from US$780M)
Reflects updated mine life assumptions |
Underlying net finance costs |
|
|
|
(US$M) | 81 | 190 | Guidance unchanged |
Greenfield exploration |
|
|
|
(US$M) | 15 | 30 | Guidance unchanged |
(a) The denotation (e) refers to an estimate or forecast year.
OPERATIONS ANALYSIS
A summary of the underlying performance of the Group's operations is presented below and a more detailed analysis is presented on pages 23 to 31.
Operations table (South32 share)
| Underlying revenue | Underlying EBIT | ||
US$M | H1 FY26 | H1 FY25 | H1 FY26 | H1 FY25 |
Worsley Alumina | 746 | 916 | 70 | 280 |
Brazil Alumina | 267 | 408 | (3) | 146 |
Brazil Aluminium | 204 | 153 | (15) | (55) |
Hillside Aluminium | 1,021 | 986 | 171 | 89 |
Mozal Aluminium | 473 | 488 | 58 | 33 |
Sierra Gorda | 578 | 405 | 298 | 128 |
Cannington | 396 | 323 | 163 | 89 |
Hermosa | - | - | (28) | (17) |
Australia Manganese | 306 | - | 66 | (34) |
South Africa Manganese | 167 | 191 | (2) | 18 |
Third party products and services[49] | 136 | 190 | 6 | 10 |
Inter-segment / Group and unallocated | (479) | (593) | (48) | (106) |
South32 Group (excluding IMC and Cerro Matoso) | 3,815 | 3,467 | 736 | 581 |
IMC[50] | - | 144 | - | 50 |
Cerro Matoso | 193 | 239 | 11 | 32 |
South32 Group | 4,008 | 3,850 | 747 | 663 |
WORSLEY ALUMINA
Location: Western Australia, Australia
South32 share: 86 per cent
Worsley Alumina is an integrated bauxite mining and alumina refining operation in the South West of Western Australia. Alumina from Worsley Alumina is currently exported to our Hillside Aluminium and Mozal Aluminium smelters and other smelters around the world.
Volumes
Worsley Alumina saleable production increased by 2% (or 43kt) to 1,893kt in H1 FY26, as the operation delivered planned volumes while completing scheduled calciner maintenance. FY26 production guidance remains unchanged at 3,750kt.
Worsley Alumina commenced development of the Worsley Mine Development Project (the Project) in Q4 FY25, following receipt of final environmental approvals[51]. The Project is expected to deliver improved bauxite supply and sustain production to at least FY36[52].
Operating costs
Operating unit costs increased by 4%, to US$318/t in H1 FY26, as higher volumes and lower caustic soda consumption (H1 FY26: 120kg/t, H1 FY25: 134kg/t), reflecting improved bauxite quality, were more than offset by general inflation and one-off costs associated with workforce restructuring initiatives.
Our operating margin decreased to 21% (H1 FY25: 40%), as alumina prices declined from elevated levels in the prior period.
FY26 Operating unit cost guidance is unchanged at US$310/t, with costs expected to be lower in H2 FY26 (compared to H1 FY26) due to lower labour costs and deferral of non-essential activities in response to market conditions. Exchange rate and price assumptions for FY26 Operating unit cost guidance are detailed on page 18, footnote 45.
Financial performance
Underlying EBIT decreased by 75% (or US$210M) to US$70M in H1 FY26, as higher sales volumes (+US$38M) and lower caustic soda consumption (+US$12M), were more than offset by a 22% decrease in our average realised price of alumina (-US$208M).
Capital expenditure
Safe and reliable capital expenditure was US$32M in H1 FY26 and is expected to be US$55M in FY26 as we continue our investment in additional bauxite residue disposal capacity.
Improvement and life extension capital expenditure was US$41M in H1 FY26 and is expected to be US$90M in FY26 as we advance development of new mining areas as part of the Project, including the Nullaga mine development.
South32 share | H1 FY26 | H1 FY25 |
Alumina production (kt) | 1,893 | 1,850 |
Alumina sales (kt) | 1,863 | 1,789 |
Realised alumina sales price (US$/t) | 400 | 512 |
Operating unit cost (US$/t) | 318 | 306 |
|
|
|
South32 share (US$M) | H1 FY26 | H1 FY25 |
Underlying revenue | 746 | 916 |
Underlying EBITDA | 153 | 369 |
Underlying EBIT | 70 | 280 |
Net operating assets(a) | 1,722 | 1,707 |
Capital expenditure | 73 | 50 |
Safe and reliable | 32 | 38 |
Improvement and life extension | 41 | 12 |
(a) H1 FY25 reflects the balance as at 30 June 2025.
BRAZIL ALUMINA
Location: Pará and Maranhão, Brazil
South32 investment: Bauxite - 33 per cent
South32 share: Alumina - 36 per cent (non-operated)
Brazil Alumina includes a 33% interest in the Mineração Rio do Norte (MRN) bauxite mine and a 36% interest in the Alumar alumina refinery. Our share of bauxite produced from MRN is supplied to the Alumar alumina refinery. The alumina produced from the Alumar alumina refinery is supplied to the co-located Alumar aluminium smelter and exported to other smelters around the world.
Volumes
Brazil Alumina saleable production increased by 4% (or 27kt) to a record 709kt in H1 FY26, as the refinery operated above nameplate capacity. FY26 production guidance remains unchanged at 1,360kt.
Operating costs
Operating unit costs were unchanged at US$320/t in H1 FY26 as higher volumes were offset by a stronger Brazilian real.
Our operating margin decreased to 9% (H1 FY25: 43%) as alumina prices declined from elevated levels in the prior period.
While Operating unit cost guidance is not provided for this non-operated facility, the refinery will continue to be influenced by energy and raw material input prices.
Financial performance
Underlying EBIT decreased to a loss of US$3M in H1 FY26, as higher sales volumes (+US$17M) were more than offset by a 37% reduction in our average realised price of alumina (-US$158M).
Our share of the loss from our equity accounted interest in MRN was unchanged at US$13M in H1 FY26.
Capital expenditure
Capital expenditure decreased by US$22M to US$5M in H1 FY26 due to the timing of spend and refinery improvement projects completed in the prior period. Capital expenditure is expected to be US$40M (previously US$50M) in FY26.
MRN continues to execute the transmission line project to connect the MRN bauxite mine to the Brazilian power grid. The transmission line will enable MRN to reduce operating costs by replacing its diesel-powered generation with cost efficient renewable energy sources. Our share of capital expenditure for the transmission line was ~US$15M (33% share) in H1 FY26.
South32 share | H1 FY26 | H1 FY25 |
Alumina production (kt) | 709 | 682 |
Alumina sales (kt) | 719 | 691 |
Realised sales price (US$/t) | 371 | 590 |
Operating unit cost (US$/t)(a) | 320 | 320 |
|
|
|
South32 share (US$M)(b) | H1 FY26 | H1 FY25 |
Underlying revenue | 267 | 408 |
Underlying EBITDA | 25 | 174 |
Underlying EBIT | (3) | 146 |
Net operating assets(c) | 671 | 638 |
Capital expenditure | 5 | 27 |
Safe and reliable | 5 | 22 |
Improvement and life extension | - | 5 |
(a) Excludes the profit/(loss) from our equity accounted interest in MRN.
(b) Results for Brazil Alumina include MRN on an equity accounted basis.
(c) H1 FY25 reflects the balance as at 30 June 2025.
BRAZIL ALUMINIUM
Location: Maranhão, Brazil
South32 share: 40 per cent (non-operated)
Brazil Aluminium produces aluminium for domestic and export markets, with alumina supplied by the co-located Alumar alumina refinery. Our share of Brazil Aluminium production is powered by 100% renewable power.
Volumes
Brazil Aluminium saleable production increased by 16% (or 10kt) to 74kt in H1 FY26. Despite this growth, production in Q2 FY26 was below plan due to unplanned pot outages and external energy disruptions.
Production guidance has been revised to 135kt (from 160kt) in FY26 and 140kt (from 165kt) in FY27, as the smelter's operator implements measures to improve stability and continue the ramp-up of all three potlines.
Operating costs
Operating unit costs decreased by 14%, to US$2,919/t in H1 FY26,as higher volumes and lower alumina input prices, more than offset a stronger Brazilian real.
While Operating unit cost guidance is not provided, the smelter's cost profile will continue to be influenced by raw material input prices and the ramp-up profile for all three potlines.
Financial performance
Underlying EBIT improved by US$40M, to a loss of US$15M in H1 FY26, as higher sales volumes (+US$35M) and average realised aluminium prices (+US$16M) more than offset higher smelter raw materials consumption (-US$15M) to deliver increased volumes.
Capital expenditure
Capital expenditure was US$9M in H1 FY26 and is expected to be US$15M in FY26.
South32 share | H1 FY26 | H1 FY25 |
|
Aluminium production (kt) | 74 | 64 |
|
Aluminium sales (kt) | 74 | 61 |
|
Realised sales price (US$/t) | 2,757 | 2,508 |
|
Operating unit cost (US$/t) | 2,919 | 3,377 |
|
|
|
|
|
South32 share (US$M) | H1 FY26 | H1 FY25 |
|
Underlying revenue | 204 | 153 |
|
Underlying EBITDA | (12) | (53) |
|
Underlying EBIT | (15) | (55) |
|
Net operating assets(a) | 139 | 71 |
|
Capital expenditure | 9 | 6 |
|
Safe and reliable | 9 | 6 |
|
Improvement and life extension | - | - |
|
(a) H1 FY25 reflects the balance as at 30 June 2025.
HILLSIDE ALUMINIUM
Location: KwaZulu-Natal, South Africa
South32 share: 100 per cent
Hillside Aluminium is located in Richards Bay, South Africa, and is the largest aluminium smelter in the southern hemisphere. The smelter produces high-quality, primary aluminium for domestic and export markets.
Volumes
Hillside Aluminium saleable production was unchanged at 362kt in H1 FY26, as the smelter continued to test its maximum technical capacity, despite the impact of load-shedding. FY26 production guidance remains unchanged at 720kt[53].
Operating costs
Operating unit costs decreased by 2%, to US$2,295/t in H1 FY26,as the smelter continued to test its maximum technical capacity and benefitted from lower alumina input prices. These benefits more than offset a stronger South African rand and inflation-linked indexation of energy costs.
Our operating margin increased to 20% (H1 FY25: 12%), reflecting a 7% increase in the average realised price of aluminium together with lower costs.
While Operating unit cost guidance is not provided, the cost profile of the smelter will continue to be heavily influenced by the price of smelter raw material inputs and other external factors including the South African rand and inflation-linked indexation of energy costs.
The smelter's electricity is supplied by Eskom under a contract to 2031, with a tariff that is South African rand based and a rate of escalation linked to the South African Producer Price Index. We are continuing to work with Eskom and other stakeholders in the South African energy sector on pathways to secure low-carbon[54] electricity supply beyond 2031.
Financial performance
Underlying EBIT increased by 92% (or US$82M), to US$171M in H1 FY26, as higher average realised aluminium prices (+US$65M) combined with lower smelter raw material input prices (+US$34M), including alumina, more than offset a stronger South African rand (-US$11M), and lower sales volumes (-US$30M) due to the timing of shipments.
49 pots were relined at a cost of US$323k per pot in H1 FY26(H1 FY25: 95 pots at US$305k per pot), with ~70 pots scheduled to be relined in FY26. The smelter is deploying AP3XLE energy efficiency technology in its pot relining activity to further enhance the smelter's energy efficiency and reduce GHG emissions. At the end of H1 FY26, ~63% of the pots had been relined using AP3XLE technology.
Capital expenditure
Capital expenditure was US$34M in H1 FY26 and is expected to be US$65M in FY26 as we continue our investment to replace the pot tending assemblies.
South32 share | H1 FY26 | H1 FY25 |
Aluminium production (kt) | 362 | 362 |
Aluminium sales (kt) | 356 | 367 |
Realised sales price (US$/t) | 2,868 | 2,687 |
Operating unit cost (US$/t) | 2,295 | 2,351 |
|
|
|
South32 share (US$M) | H1 FY26 | H1 FY25 |
Underlying revenue | 1,021 | 986 |
Underlying EBITDA | 204 | 123 |
Underlying EBIT | 171 | 89 |
Net operating assets(a) | 737 | 788 |
Capital expenditure | 34 | 19 |
Safe and reliable | 34 | 19 |
Improvement and life extension | - | - |
(a) H1 FY25 reflects the balance as at 30 June 2025.
MOZAL ALUMINIUM
Location: Maputo, Mozambique
South32 share: 63.7 per cent
Mozal Aluminium is located near Maputo, Mozambique, and is a significant industrial employer in the country. The smelter produces high-quality, primary aluminium for domestic and export markets.
Volumes
Mozal Aluminium saleable production increased by 3% (or 5kt) to 183kt in H1 FY26.
On 16 December 2025[55], we announced that Mozal Aluminium will transition to care and maintenance on or around 15 March 2026 due to the inability to secure sufficient and affordable electricity supply. With the smelter transitioning to care and maintenance, we have ceased pot relining and procurement of smelter raw materials. FY26 production guidance remains unchanged at 240kt[56], based on operations continuing to March 2026.
Operating costs
Operating unit costs increased by 5%, to US$2,556/t in H1 FY26,as higher priced alumina and a stronger South African rand more than offset lower pot relining and maintenance spend, as we prepare to transition the smelter to care and maintenance.
Our operating margin decreased to 12% (H1 FY25: 14%), as a 4% increase in the average realised price of aluminium was more than offset by higher costs.
While Operating unit cost guidance is not provided, the cost profile of the smelter will continue to be heavily influenced by the price of smelter raw material inputs and external factors including the South African rand.
Financial performance
Underlying EBIT increased by 76% (or US$25M), to US$58M in H1 FY26, as higher average realised aluminium prices (+US$19M) and lower maintenance spend (+US$27M) more than offset lower sales volumes (-US$34M) due to the timing of sales. We expect to draw down finished goods inventory during H2 FY26.
Capital expenditure
Capital expenditure was US$4M in H1 FY26 and is expected to be US$4M (previously US$10M) for the period ending March 2026.
South32 share | H1 FY26 | H1 FY25 |
Aluminium production (kt) | 183 | 178 |
Aluminium sales (kt) | 162 | 174 |
Realised sales price (US$/t) | 2,920 | 2,805 |
Operating unit cost (US$/t) | 2,556 | 2,425 |
|
|
|
South32 share (US$M) | H1 FY26 | H1 FY25 |
Underlying revenue | 473 | 488 |
Underlying EBITDA | 59 | 66 |
Underlying EBIT | 58 | 33 |
Net operating assets(a) | 49 | 152 |
Capital expenditure | 4 | 12 |
Safe and reliable | 4 | 12 |
Improvement and life extension | - | - |
(a) H1 FY25 reflects the balance as at 30 June 2025.
SIERRA GORDA
Location: Antofagasta, Chile
South32 share: 45 per cent (non-operated)
Sierra Gorda is a large-scale, open pit mine in the prolific Antofagasta copper mining region, that produces copper, molybdenum, gold and silver.
Volumes
Sierra Gorda payable copper equivalent production[57] was largely unchanged at 47.0kt in H1 FY26, with plant throughput and copper production in line with plan, while higher molybdenum output from the current mining phase offset lower planned gold production.
FY26 production guidance57 remains unchanged at 85.7kt (ore processed 21.8Mt, copper 72.0kt, molybdenum 1.2kt, gold 18.0koz and silver 600koz), with the operation positioned to potentially exceed guidance if strong volumes of molybdenum, gold and silver continue in H2 FY26.
Operating costs
Operating unit costs decreased by 1%, to US$17.0/t ore processed in H1 FY26, reflecting lower ore mined as the operation increased development activity, partially offset by a drawdown in stockpiles.
Our operating margin increased to a record 68% (H1 FY25: 53%), reflecting higher average metal prices and lower costs.
FY26 Operating unit cost guidance is unchanged at US$17.0/t ore processed. Exchange rate and price assumptions for FY26 Operating unit cost guidance are detailed on page 18, footnote 45.
Financial performance
Underlying EBIT increased by 133% (or US$170M), to US$298M in H1 FY26, as higher average realised metal prices (+US$168M) and sales volumes (+US$5M) more than offset higher contractor costs (-US$9M).
Capital expenditure
Safe and reliable capital expenditure was US$111M in H1 FY26 and is expected to be US$200M (previously US$180M) in FY26, as the operation continues deferred stripping activity.
Improvement and life extension capital expenditure was US$5M in H1 FY26 and is expected to be US$14M in FY26, as the operation progresses the feasibility study for the fourth grinding line project. Following completion of the feasibility study, the joint venture partners will undertake an independent review to support a potential joint final investment decision in mid‑CY26.
South32 share | H1 FY26 | H1 FY25 |
Ore mined (Mt) | 11.6 | 12.6 |
Ore processed (Mt) | 10.9 | 11.1 |
Ore grade processed (%, Cu) | 0.42 | 0.42 |
Payable copper equivalentproduction (kt)57 | 47.0 | 47.2 |
Payable copper production (kt) | 36.3 | 36.7 |
Payable molybdenum production (kt) | 1.2 | 0.9 |
Payable gold production (koz) | 10.9 | 15.9 |
Payable silver production (koz) | 348 | 301 |
Payable copper sales (kt) | 36.5 | 37.9 |
Payable molybdenum sales (kt) | 1.3 | 0.7 |
Payable gold sales (koz) | 11.2 | 16.2 |
Payable silver sales (koz) | 344 | 317 |
Realised copper sales price (US$/lb) | 5.55 | 3.83 |
Realised molybdenum sales price(US$/lb) | 23.31 | 21.68 |
Realised gold sales price (US$/oz) | 4,107 | 2,593 |
Realised silver sales price (US$/oz) | 55.2 | 31.5 |
Operating unit cost(US$/t ore processed)[58] | 17.0 | 17.1 |
|
|
|
South32 share (US$M) | H1 FY26 | H1 FY25 |
Underlying revenue | 578 | 405 |
Underlying EBITDA | 393 | 215 |
Underlying EBIT | 298 | 128 |
Net operating assets(a) | 1,890 | 1,769 |
Capital expenditure | 116 | 106 |
Safe and reliable | 111 | 90 |
Improvement and life extension | 5 | 16 |
Exploration expenditure | 7 | 7 |
Exploration expensed | 3 | - |
(a) H1 FY25 reflects the balance as at 30 June 2025.
CANNINGTON
Location: Queensland, Australia
South32 share: 100 per cent
Cannington is an underground mine located in north-west Queensland, Australia, that produces high-grade lead and zinc concentrates with a high silver content.
Volumes
Cannington payable zinc equivalent production[59] decreased by 18% (or 23.0kt) to 102.8kt in H1 FY26, as higher ore processed was more than offset by lower planned metal grades.
FY26 production guidance59 remains unchanged at 200.6kt (ore processed 1,850kdmt, zinc 40.0kt, lead 87.0kt and silver 8,200koz).
Operating costs
Operating unit costs decreased by 7%, to US$183/t ore processed in H1 FY26, as higher ore processed and inventory movements more than offset higher price-linked royalties.
Our operating margin increased to 53% (H1 FY25: 40%), reflecting stronger metal prices together with lower costs.
While costs are tracking below plan, FY26 Operating unit cost guidance remains unchanged at US$205/t ore processed, with the potential for higher price-linked royalties if metal prices remain at current levels. Exchange rate and price assumptions for FY26 Operating unit cost guidance are detailed on page 18, footnote 45.
Financial performance
Underlying EBIT increased by 83% (or US$74M), to US$163M in H1 FY26, as higher average realised metal prices (+US$140M) more than offset lower planned sales volumes (-US$67M).
Capital expenditure
Capital expenditure was unchanged at US$23M in H1 FY26 and is expected to be US$40M in FY26 as we invest in underground development and activities to support mine life extensions.
Our work on mine life extension options has supported a further increase in the underground Ore Reserve by 3Mt to 13Mt in H1 FY26, extending the reserve life by approximately two years to FY33[60]. To support the extended mine life, we expect to invest additional capital expenditure of approximately US$65M to US$80M during FY27 and FY28, including for ventilation and electrical upgrades.
South32 share | H1 FY26 | H1 FY25 |
Ore mined (kwmt) | 1,088 | 999 |
Ore processed (kdmt) | 1,009 | 982 |
Ore grade processed (g/t, Ag) | 159 | 206 |
Ore grade processed (%, Pb) | 5.1 | 5.9 |
Ore grade processed (%, Zn) | 2.6 | 3.2 |
Payable zinc equivalent production (kt)59 | 102.8 | 125.8 |
Payable silver production (koz) | 4,487 | 5,615 |
Payable lead production (kt) | 42.3 | 49.6 |
Payable zinc production (kt) | 18.7 | 22.9 |
Payable silver sales (koz) | 4,570 | 5,469 |
Payable lead sales (kt) | 42.7 | 54.3 |
Payable zinc sales (kt) | 16.9 | 23.0 |
Realised silver sales price (US$/oz) | 58.4 | 29.4 |
Realised lead sales price (US$/t) | 1,897 | 1,823 |
Realised zinc sales price (US$/t) | 2,840 | 2,739 |
Operating unit cost(US$/t ore processed)[61] | 183 | 197 |
|
|
|
South32 share (US$M) | H1 FY26 | H1 FY25 |
Underlying revenue | 396 | 323 |
Underlying EBITDA | 211 | 130 |
Underlying EBIT | 163 | 89 |
Net operating assets(a) | 135 | 131 |
Capital expenditure | 23 | 23 |
Safe and reliable | 23 | 23 |
Improvement and life extension | - | - |
Exploration expenditure | 3 | 3 |
Exploration expensed | 1 | 1 |
(a) H1 FY25 reflects the balance as at 30 June 2025.
AUSTRALIA MANGANESE
Location: Northern Territory, Australia
South32 share: 60 per cent
Australia Manganese is Groote Eylandt Mining Company (GEMCO) in the Northern Territory, Australia, an open-cut mining operation that produces high-grade manganese ore.
Volumes
Australia Manganese saleable production increased to 1,660kwmt in H1 FY26, as the operation achieved normalised production rates after executing its recovery plan following the impacts of Tropical Cyclone Megan.
FY26 production guidance remains unchanged at 3,200kwmt, subject to potential wet season impacts.
Australia Manganese finalised insurance claims related to Tropical Cyclone Megan, with an additional US$153M (100% basis) in external insurance recoveries received in H1 FY26, bringing final approved recoveries to US$503M (100% basis).
Operating costs
Operating unit costs were US$2.31/dmtu in H1 FY26 and FY26 Operating unit cost guidance remains unchanged at US$2.40/dmtu. Exchange rate and price assumptions for FY26 Operating unit cost guidance are detailed on page 18, footnote 45.
Financial performance
Underlying EBIT increased to US$66M in H1 FY26 (H1 FY25: loss of US$34M), with sales volumes increasing to 1,809kwmt following the commissioning of new wharf infrastructure in Q4 FY25.
Depreciation and amortisation increased by US$38M to US$41M in H1 FY26 as operations resumed.
Income related to external insurance recoveries (US$92M) is excluded from Underlying EBIT as an earnings adjustment.
Capital expenditure
Capital expenditure was US$46M in H1 FY26 and is expected to be US$81M in FY26 as we continue planned investments in water management infrastructure and mobile equipment.
South32 share | H1 FY26 | H1 FY25 |
Manganese ore production (kwmt) | 1,660 | 639 |
Manganese ore sales (kwmt) | 1,809 | - |
Realised external manganese ore sales price (US$/dmtu, FOB)[62][63] | 3.81 | - |
Operating unit cost (US$/dmtu, FOB)63,[64] | 2.31 | - |
|
|
|
South32 share (US$M) | H1 FY26 | H1 FY25 |
Underlying revenue | 306 | - |
Underlying EBITDA | 107 | (31) |
Underlying EBIT | 66 | (34) |
Net operating assets(a) | 264 | 240 |
Capital expenditure | 46 | 47 |
Safe and reliable | 45 | 47 |
Improvement and life extension | 1 | - |
Exploration expenditure | 3 | 3 |
Exploration expensed | 3 | 3 |
(a) H1 FY25 reflects the balance as at 30 June 2025.
SOUTH AFRICA MANGANESE
Location: Northern Cape and Gauteng, South Africa
South32 share: Ore - 54.6 per cent, Alloy - 60 per cent (divested)
South Africa Manganese consists of two manganese mines in the Kalahari Basin, the open-cut Mamatwan mine and the underground Wessels mine.
In June 2025, Samancor Manganese Proprietary Limited completed the divestment of the Metalloys manganese alloy smelter[65], which had been placed on care and maintenance in FY20.
Volumes
South Africa Manganese saleable production decreased by 2% (or 25kt) to 1,057kwmt in H1 FY26, as the operation completed planned maintenance and underground development at Wessels.
FY26 production guidance remains unchanged at 2,000kwmt, with further planned maintenance scheduled in Q3 FY26.
Operating costs
Operating unit costs decreased by 1%, to US$3.09/dmtu in H1 FY26, as a drawdown of low-cost inventory more than offset a stronger South African rand.
FY26 Operating unit cost guidance is unchanged at US$3.10/dmtu. Exchange rate and price assumptions for FY26 Operating unit cost guidance are detailed on page 18, footnote 45.
Financial performance
Ore Underlying EBIT decreased by US$21M, to a loss of US$2M in H1 FY26, reflecting lower average realised manganese prices (-U$19M) and a stronger South African rand (-US$4M).
Capital expenditure
Capital expenditure was US$18M in H1 FY26 and is expected to be US$30M (previously US$35M) in FY26.
South32 share | H1 FY26 | H1 FY25 |
Manganese ore production (kwmt) | 1,057 | 1,082 |
Manganese ore sales (kwmt) | 1,094 | 1,088 |
Realised external manganese ore sales price (US$/dmtu, FOB)[66][67] | 3.36 | 3.85 |
Ore operating unit cost (US$/dmtu, FOB)67,[68] | 3.09 | 3.13 |
|
|
|
South32 share (US$M) | H1 FY26 | H1 FY25 |
Underlying revenue | 167 | 191 |
Manganese ore | 167 | 191 |
Manganese alloy | - | - |
Underlying EBITDA | 8 | 28 |
Manganese ore | 8 | 29 |
Manganese alloy | - | (1) |
Underlying EBIT | (2) | 18 |
Manganese ore | (2) | 19 |
Manganese alloy | - | (1) |
Net operating assets/(liabilities)(a) | 266 | 252 |
Manganese ore | 266 | 252 |
Manganese alloy | - | - |
Capital expenditure | 18 | 25 |
Safe and reliable | 13 | 16 |
Improvement and life extension | 5 | 9 |
(a) H1 FY25 reflects the balance as at 30 June 2025.
GLOSSARY OF TERMS AND ABBREVIATIONS
ADR
American Depositary Receipts.
ASX
Australian Securities Exchange.
Cu/TCu
Copper/total copper.
CY
Calendar year.
dmtu
Dry metric tonne unit.
EAI
Equity accounted investment.
FY
Financial Year.
Goal
Goal is defined as an aspiration to deliver an outcome for which we have not identified a pathway for delivery, but for which efforts will be pursued towards achieving that outcome, subject to certain assumptions or conditions.
g/t
Grams per tonne.
JSE
Johannesburg Stock Exchange.
kdmt
Thousand dry metric tonnes.
koz
Thousand ounces.
kt
Thousand tonnes.
ktpa
Thousand tonnes per annum.
kwmt
Thousand wet metric tonnes.
lb
Pound.
Leadership roles
A Leadership Role is a position in the organisational structure flagged as the head of an organisational unit.
Local workforce diversity
Local workforce diversity is a metric consisting of four equally weighted targets measuring local workforce diversity across the regions in which we operate. This includes Black People in the total workforce in South Africa, Black People in Management Roles in South Africa, Mozambique nationals in the Mozambique workforce and Aboriginal and Torres Strait Islander (ATSI) Peoples representation in the Australian workforce. In FY25, the Local workforce diversity metric also included a target for local community members hired into unionised positions at Cerro Matoso. This target was removed following the divestment of Cerro Matoso on 1 December 2025.
Lost time injury frequency (LTIF)
(The sum of lost time injuries x 1,000,000) ÷ exposure hours, for employees and contractors. This is stated in units of per million hours worked for employees and contractors. We adopt the United States Government Occupational Safety and Health Administration (OSHA) guidelines for the recording and reporting of occupational injuries and illnesses.
LSE
London Stock Exchange.
Moz
Million ounce.
Mt
Million tonne.
Mtpa
Million tonnes per annum.
MW
Megawatt.
Mwmt
Million wet metric tonne.
Operating cost
Operating cost is Underlying revenue less Underlying EBITDA excluding third party products and services.
Operating unit cost
Operating unit cost is Underlying revenue less Underlying EBITDA, excluding third party products and services, divided by sales volumes.
oz
Ounce.
Realised sales price
Realised sales price is calculated as Underlying revenue excluding third party products and services divided by sales volume.
ROIC
Return on invested capital (ROIC) is calculated as Underlying EBIT less the discount on rehabilitation provisions included in Underlying net finance costs, tax effected by the Group's Underlying effective tax rate (ETR) including our material equity accounted investments on a proportional consolidation basis, divided by the sum of fixed assets (excluding any rehabilitation assets, the impact of any impairments or impairment reversals, and unproductive capital) and inventories. For the half year report, financial results are annualised to reflect 12-month equivalent returns.
Significant hazard frequency
(The sum of significant hazards x 1,000,000) ÷ exposure hours. This is stated in units of per million hours worked for employees and contractors. A significant hazard is something that has the potential to cause harm, ill health or injury, or damage to property, plant or the environment.
South32 share
South32's ownership share of operations is presented as follows: Worsley Alumina (86% share), Brazil Alumina (36% share), Brazil Aluminium (40% share), Hillside Aluminium (100%), Mozal Aluminium (63.7% share), Sierra Gorda (45% share), Cannington (100%), Hermosa (100%), Australia Manganese (60% share) and South Africa Manganese ore (54.6% share). Prior to the divestment of Illawarra Metallurgical Coal on 29 August 2024, South32's ownership was 100%. Prior to the divestment of South Africa Manganese alloy on 3 June 2025, South32's ownership was 60%. Prior to divestment of Cerro Matoso on 1 December 2025, South32's ownership was 99.9%. Unless otherwise stated: all metrics reflect South32's share.
t
Tonne.
Target
Target is defined as an intended outcome in relation to which we have identified one or more pathways for delivery of that outcome, subject to certain assumptions or conditions.
Total recordable injury frequency (TRIF)
(The sum of recordable injuries x 1,000,000) ÷ exposure hours, for employees and contractors. This is stated in units of per million hours worked for employees and contractors. We adopt the United States Government Occupational Safety and Health Administration (OSHA) guidelines for the recording and reporting of occupational injuries and illnesses.
Underlying earnings attributable to members
Underlying earnings attributable to members is profit/(loss) after tax, net of amounts attributable to non-controlling interests and earnings adjustment items, from continuing and discontinued operations. Underlying earnings attributable to members is the key measure that South32 uses to assess the performance of the South32 Group, make decisions on the allocation of resources and assess senior management's performance.
Underlying EBIT
Underlying EBIT is profit/loss before net finance income/costs, tax and any earnings adjustments, including impairments, from continuing and discontinued operations. The performance of each of the South32 operations and operational management is assessed based on Underlying EBIT. In order to calculate Underlying EBIT, the following items are adjusted as applicable each period, irrespective of materiality: Exchange rate gains/losses on restatement of monetary items; Impairment losses/reversals; Gains/losses on disposal and consolidation of interests in operations; Gains/losses on non-trading derivative instruments and contingent consideration measured at fair value through profit or loss; Major corporate restructures; Joint venture adjustments; Exchange rate variations on net cash/debt; Tax effect of earnings adjustments; and Exchange rate variations on tax balances. In addition, items that do not reflect the underlying operations of South32, and are individually, or in combination with other related earnings adjustments, significant to the financial statements, are excluded to determine Underlying earnings. When applicable, significant items are detailed in the Financial Information.
Underlying EBIT margin
Comprises Underlying EBIT excluding third party products and services EBIT, divided by Underlying revenue excluding third party products and services revenue.
Underlying EBITDA
Underlying EBITDA is Underlying EBIT before Underlying depreciation and amortisation, and excludes third party products and services EBITDA. In order to calculate Underlying EBITDA, the following items are adjusted as applicable each period, irrespective of materiality: Exchange rate gains/losses on restatement of monetary items; Impairment losses/reversals; Gains/losses on disposal and consolidation of interests in operations; Gains/losses on non-trading derivative instruments and contingent consideration measured at fair value through profit or loss; Major corporate restructures; Joint venture adjustments; Exchange rate variations on net cash/debt; Tax effect of earnings adjustments; and Exchange rate variations on tax balances. In addition, items that do not reflect the underlying operations of South32, and are individually, or in combination with other related earnings adjustments, significant to the financial statements, are excluded to determine Underlying earnings. When applicable, significant items are detailed in the Financial Information.
Underlying EBITDA margin
Comprises Underlying EBITDA excluding third party products and services EBITDA, divided by Underlying revenue excluding third party products and services revenue. Also referred to as operating margin.
Underlying Effective Tax Rate (ETR)
Underlying ETR is Underlying income tax expense, including royalty related tax, divided by Underlying profit subject to tax.
Underlying revenue
Underlying revenue includes revenue from third party products and services.
US$B
US$ billion.
US$M
US$ million.

SOUTH32
FINANCIAL
INFORMATION
For the half year ended 31 December 2025
Contents
Consolidated income statement | 37 | |
Consolidated statement of comprehensive income | 38 | |
Consolidated balance sheet | 39 | |
Consolidated cash flow statement | 40 | |
Consolidated statement of changes in equity | 41 | |
Notes to financial statements |
| |
1. | Reporting entity | 42 |
2. | Basis of preparation | 42 |
3. | Segment information | 43 |
4. | Dividends | 49 |
5. | Earnings per share | 49 |
6. | Net finance income/(costs) | 50 |
7. | Financial assets and financial liabilities | 50 |
8. | Equity accounted investments | 53 |
9. | Disposal of subsidiaries | 53 |
10. | Subsequent events | 55 |
Directors' declaration | 56 | |
Directors' report | 57 | |
Lead auditor's independence declaration | 59 | |
Independent auditor's review report | 61 | |
Consolidated Income Statement
for the half year ended 31 December 2025
US$M | Note | H1 FY26 | H1 FY25Restated1 |
Continuing operations |
|
|
|
Revenue: |
|
|
|
Group production |
| 2,628 | 2,681 |
Third party products and services |
| 181 | 203 |
| 3 | 2,809 | 2,884 |
Other income |
| 59 | 60 |
Expenses excluding finance costs |
| (2,451) | (2,536) |
Share of profit/(loss) of equity accounted investments | 8 | 115 | 80 |
Operating profit/(loss) from continuing operations |
| 532 | 488 |
Comprising: |
|
|
|
Group production |
| 526 | 478 |
Third party products and services |
| 6 | 10 |
Operating profit/(loss) from continuing operations |
| 532 | 488 |
Finance income |
| 136 | 131 |
Finance costs |
| (128) | (65) |
Net finance income/(costs) | 6 | 8 | 66 |
Profit/(loss) before tax from continuing operations |
| 540 | 554 |
Income tax (expense)/benefit |
| (108) | (198) |
Profit/(loss) for the period from continuing operations |
| 432 | 356 |
|
|
|
|
Discontinued operations |
|
|
|
Profit/(loss) after tax from discontinued operations | 9 | 31 | 3 |
Profit/(loss) for the period |
| 463 | 359 |
|
|
|
|
Attributable to: |
|
|
|
Equity holders of South32 Limited |
| 464 | 360 |
Non-controlling interests |
| (1) | (1) |
|
|
|
|
Profit/(loss) for the period from continuing operations attributable to equity holders of South32 Limited: |
|
|
|
Basic earnings/(loss) per share (cents) | 5 | 9.6 | 7.9 |
Diluted earnings/(loss) per share (cents) | 5 | 9.6 | 7.9 |
|
|
|
|
Profit/(loss) for the period attributable to equity holders of South32 Limited: |
|
|
|
Basic earnings/(loss) per share (cents) | 5 | 10.3 | 8.0 |
Diluted earnings/(loss) per share (cents) | 5 | 10.3 | 8.0 |
1. Refer to note 9 Disposal of subsidiaries.
The accompanying notes form part of the half year consolidated financial statements.
Consolidated statement of comprehensive income
for the half year ended 31 December 2025
US$M | H1 FY26 | H1 FY25 |
Profit/(loss) for the period | 463 | 359 |
Other comprehensive income |
|
|
Items that may be reclassified to the Consolidated income statement: |
|
|
Translation of foreign operations | (2) | (2) |
Share of other comprehensive income/(loss) of equity accounted investments | - | 2 |
Total items that may be reclassified to the Consolidated income statement | (2) | - |
Items that will not be reclassified to the Consolidated income statement: |
|
|
Investments in equity instruments designated as fair value through other comprehensive income (FVOCI): |
|
|
Net fair value gains/(losses) | 114 | 19 |
Income tax (expense)/benefit | (25) | (6) |
Share of other comprehensive income/(loss) of equity accounted investments | (1) | - |
Total items that will not be reclassified to the Consolidated income statement | 88 | 13 |
Total other comprehensive income/(loss) | 86 | 13 |
Total comprehensive income/(loss) | 549 | 372 |
|
|
|
Attributable to: |
|
|
Equity holders of South32 Limited | 551 | 374 |
Non-controlling interests | (2) | (2) |
The accompanying notes form part of the half year consolidated financial statements.
Consolidated balance sheet
for the half year ended 31 December 2025
US$M | Note | H1 FY26 | FY25 |
ASSETS |
|
|
|
Current assets |
|
|
|
Cash and cash equivalents |
| 1,664 | 1,677 |
Trade and other receivables |
| 859 | 809 |
Other financial assets | 7 | - | 7 |
Inventories |
| 942 | 935 |
Current tax assets |
| 12 | 11 |
Other assets |
| 52 | 54 |
Assets held for sale |
| - | 306 |
Total current assets |
| 3,529 | 3,799 |
Non-current assets |
|
|
|
Trade and other receivables |
| 1,920 | 2,000 |
Other financial assets | 7 | 270 | 184 |
Inventories |
| 37 | 36 |
Property, plant and equipment |
| 6,736 | 6,429 |
Intangible assets |
| 202 | 196 |
Equity accounted investments |
| 643 | 590 |
Deferred tax assets |
| 453 | 486 |
Other assets |
| 7 | 7 |
Total non-current assets |
| 10,268 | 9,928 |
Total assets |
| 13,797 | 13,727 |
LIABILITIES |
|
|
|
Current liabilities |
|
|
|
Trade and other payables |
| 702 | 802 |
Interest bearing liabilities |
| 356 | 267 |
Other financial liabilities | 7 | 5 | - |
Current tax payables |
| 37 | 40 |
Provisions |
| 191 | 185 |
Deferred income |
| 10 | 8 |
Liabilities directly associated with assets held for sale |
| - | 264 |
Total current liabilities |
| 1,301 | 1,566 |
Non-current liabilities |
|
|
|
Interest bearing liabilities |
| 1,333 | 1,367 |
Other financial liabilities | 7 | 24 | 78 |
Deferred tax liabilities |
| 164 | 175 |
Provisions |
| 1,719 | 1,684 |
Total non-current liabilities |
| 3,240 | 3,304 |
Total liabilities |
| 4,541 | 4,870 |
Net assets |
| 9,256 | 8,857 |
EQUITY |
|
|
|
Share capital |
| 13,125 | 13,160 |
Treasury shares |
| (16) | (25) |
Reserves |
| (3,494) | (3,567) |
Accumulated losses |
| (371) | (723) |
Total equity attributable to equity holders of South32 Limited |
| 9,244 | 8,845 |
Non-controlling interests |
| 12 | 12 |
Total equity |
| 9,256 | 8,857 |
The accompanying notes form part of the half year consolidated financial statements.
Consolidated cash flow statement
for the half year ended 31 December 2025
US$M | H1 FY26 | H1 FY25Restated1 |
Operating activities |
| |
Profit/(loss) before tax from continuing operations | 540 | 554 |
Profit/(loss) before tax from discontinued operations | 28 | 26 |
Adjustments for: |
|
|
Significant items2 | 54 | (50) |
Depreciation and amortisation expense | 214 | 255 |
Impairment losses/(reversals) of financial assets | (77) | 71 |
Employee share awards expense | 9 | 10 |
Net finance (income)/costs | (5) | (60) |
Share of (profit)/loss of equity accounted investments | (115) | (80) |
(Gains)/losses on disposal of subsidiaries and joint operations | (21) | 47 |
Unrealised (gains)/losses on derivative instruments and contingent consideration measured at fair value through profit or loss (FVTPL) | (9) | (3) |
Other non-cash or non-operating items | - | (3) |
Changes in assets and liabilities: |
|
|
Trade and other receivables | 16 | (10) |
Inventories | (30) | (115) |
Trade and other payables | (101) | (95) |
Provisions and other liabilities | (15) | (47) |
Cash generated from operations | 488 | 500 |
Interest received | 235 | 119 |
Interest paid | (54) | (55) |
Income tax paid | (129) | (116) |
Dividends received | 1 | 2 |
Net cash flows from operating activities | 541 | 450 |
Investing activities |
|
|
Purchase of property, plant and equipment | (498) | (457) |
Purchase of intangible assets | (10) | (2) |
Exploration expenditure | (35) | (39) |
Exploration expenditure expensed and included in operating cash flows | 19 | 20 |
Investment in financial assets | (60) | (21) |
Proceeds from financial assets | 62 | 29 |
Payments for the acquisition of subsidiaries and joint operations, net of their cash | - | (4) |
Proceeds from the disposal of subsidiaries and joint operations, net of their cash | 10 | 954 |
Payments for preference shares issued by equity accounted investments | (24) | (63) |
Proceeds from redemption of preference shares issued by equity accounted investments | 84 | - |
Net cash flows from investing activities | (452) | 417 |
Financing activities |
|
|
Proceeds from interest bearing liabilities | 65 | 121 |
Repayment of interest bearing liabilities | (91) | (59) |
Purchase of shares by Employee Share Ownership Plan (ESOP) Trusts | (4) | (5) |
Share buy-back | (35) | (29) |
Dividends paid | (117) | (140) |
Contributions from non-controlling interests | - | 4 |
Net cash flows from financing activities | (182) | (108) |
Net increase/(decrease) in cash and cash equivalents | (93) | 759 |
Cash and cash equivalents, net of overdrafts, at the beginning of the period3 | 1,757 | 842 |
Effect of foreign exchange rate changes on cash and cash equivalents | - | (1) |
Cash and cash equivalents, net of overdrafts, at the end of the period | 1,664 | 1,600 |
1. Refer to note 9 Disposal of subsidiaries.
2. H1 FY26 relates to non-cash significant items, refer to note 3(b)(ii) Significant items. H1 FY25 relates to cash flows from significant items recognised in prior periods.
3. H1 FY26 cash and cash equivalents at the beginning of the period includes US$80 million classified as held for sale as part of the Cerro Matoso disposal group. Refer to note 9 Disposal of subsidiaries.
The accompanying notes form part of the half year consolidated financial statements.
Attributable to equity holders of South32 Limited |
| ||||||||
US$M | Share capital | Treasury shares | Financial assets reserve1 | Employee share awards reserve2 | Other reserves3 | Accumulated losses | Total | Non-controlling interests4 | Total equity |
Balance as at 1 July 2025 | 13,160 | (25) | (18) | 46 | (3,595) | (723) | 8,845 | 12 | 8,857 |
Profit/(loss) for the period | - | - | - | - | - | 464 | 464 | (1) | 463 |
Other comprehensive income/(loss) | - | - | 89 | - | (1) | (1) | 87 | (1) | 86 |
Total comprehensive income/(loss) | - | - | 89 | - | (1) | 463 | 551 | (2) | 549 |
Transactions with owners: |
|
|
|
|
|
|
|
|
|
Dividends | - | - | - | - | - | (117) | (117) | - | (117) |
Shares bought back and cancelled | (35) | - | - | - | - | - | (35) | - | (35) |
Employee share entitlements for unvested awards, net of tax | - | - | - | 11 | - | - | 11 | - | 11 |
Employee share awards vested and lapsed, net of tax | - | 13 | - | (24) | - | 6 | (5) | - | (5) |
Purchase of shares by ESOP Trusts | - | (4) | - | - | - | - | (4) | - | (4) |
Equity issued to holders of non-controlling interest | - | - | - | - | (2) | - | (2) | 2 | - |
Balance as at 31 December 2025 | 13,125 | (16) | 71 | 33 | (3,598) | (371) | 9,244 | 12 | 9,256 |
|
|
|
|
|
|
|
|
|
|
Balance as at 1 July 2024 | 13,216 | (43) | (43) | 58 | (3,590) | (638) | 8,960 | 11 | 8,971 |
Profit/(loss) for the period | - | - | - | - | - | 360 | 360 | (1) | 359 |
Other comprehensive income/(loss) | - | - | 13 | - | 1 | - | 14 | (1) | 13 |
Total comprehensive income/(loss) | - | - | 13 | - | 1 | 360 | 374 | (2) | 372 |
Transactions with owners: |
|
|
|
|
|
|
|
|
|
Dividends | - | - | - | - | - | (140) | (140) | - | (140) |
Shares bought back and cancelled | (29) | - | - | - | - | - | (29) | - | (29) |
Employee share entitlements for unvested awards, net of tax | - | - | - | 7 | - | - | 7 | - | 7 |
Employee share awards vested and lapsed, net of tax | - | 27 | - | (29) | - | - | (2) | - | (2) |
Purchase of shares by ESOP Trusts | - | (5) | - | - | - | - | (5) | - | (5) |
Equity issued to holders of non-controlling interest | - | - | - | - | - | - | - | 4 | 4 |
Balance as at 31 December 2024 | 13,187 | (21) | (30) | 36 | (3,589) | (418) | 9,165 | 13 | 9,178 |
1. Represents the fair value movement of investments in equity instruments designated as FVOCI.
2. Represents the accrued employee entitlements to share awards that have not yet vested.
3. Primarily consists of the common control transaction reserve of US$3,569 million, which reflects the difference between consideration paid and the carrying value of assets and liabilities acquired, as well as the gains/losses on disposal of entities, as part of the Group's demerger from BHP Billiton in 2015.
4. Relates to the minority shareholder (49.9 per cent) of Minera Sud Argentina S.A., which holds the Chita Valley copper porphyry exploration project in Argentina.
The accompanying notes form part of the half year consolidated financial statements.
Notes to financial statements - Basis of preparation
The consolidated financial statements of South32 Limited (referred to as the Company) and its subsidiaries and joint arrangements (collectively, the Group) for the half year ended 31 December 2025 were authorised for issue in accordance with a resolution of the Directors on 12 February 2026.
1.Reporting entity
South32 Limited is a for-profit company limited by shares incorporated in Australia. South32 Limited has a primary listing on the Australian Securities Exchange (ASX), a secondary listing on the Johannesburg Stock Exchange (JSE), is admitted to listing in the equity shares (international commercial companies secondary listing) category of the Official List of the UK Financial Conduct Authority and its ordinary shares are traded on the London Stock Exchange (LSE).
The nature of the operations and principal activities of the Group are described in note 3 Segment information.
2.Basis of preparation
The half year consolidated financial statements are general purpose condensed financial statements which:
- Have been prepared in accordance with AASB 134 Interim Financial Reporting, IAS 34 Interim Financial Reporting and the Corporations Act 2001;
- Have been prepared on a historical cost basis, except for post-retirement assets and obligations, derivative financial instruments and certain other financial assets and liabilities which are required to be measured at fair value;
- Are presented in US dollars, all values are rounded to the nearest million dollars (US$M or US$ million) unless otherwise stated, in accordance with ASIC Corporations (Rounding in Financial/Directors' Reports) Instrument 2016/191; and
- Have been prepared on the basis of accounting policies and methods of computation consistent with those applied in the consolidated financial statements for the year ended 30 June 2025.
The preparation of the half year consolidated financial statements has required management to apply accounting policies and methodologies that are based on complex and subjective estimates, assumptions and judgements. Management based its estimates and judgements on historical experience and assumptions it believes to be reasonable and realistic based on the current environment. Actual results may differ from those reported in these statements due to the uncertainties that characterise the assumptions and conditions on which the estimates are based. The significant judgements made by management in applying the Group's accounting policies and the key sources of estimation uncertainty were the same as those that applied to the consolidated financial statements for the year ended 30 June 2025.
For a full understanding of the financial performance and financial position of the Group, it is recommended that the half year consolidated financial statements be read in conjunction with the consolidated financial statements for the year ended 30 June 2025.
3.Segment information
(a)Description of segments
The operating segments (also referred to as operations) are organised and managed separately according to their location and the nature of products produced.
The Lead Team (the chief operating decision makers) and the Board of Directors monitor the segment results regularly for the purpose of making decisions about resource allocation and assessing performance.
The principal activities of each operating segment are summarised as follows:
Operating segment | Principal activities |
Worsley Alumina | Integrated bauxite mine and alumina refinery in Australia |
Brazil Alumina | Integrated bauxite mine and alumina refinery in Brazil |
Brazil Aluminium | Aluminium smelter in Brazil |
Hillside Aluminium | Aluminium smelter in South Africa |
Mozal Aluminium1 | Aluminium smelter in Mozambique |
Sierra Gorda | Copper mine in Chile |
Cannington | Silver, lead and zinc mine in Australia |
Hermosa | Base metals exploration and development project in the United States |
Australia Manganese | Manganese ore mine in Australia |
South Africa Manganese | Manganese ore mines in South Africa |
Cerro Matoso2 | Integrated laterite ferronickel mine and smelting complex in Colombia |
Illawarra Metallurgical Coal3 | Metallurgical coal mines in Australia |
1. On 16 December 2025, the Group announced that Mozal Aluminium will transition to care and maintenance in March 2026. Refer to note 3(b)(ii) Significant items.
2. On 1 December 2025, the Group completed the sale of Cerro Matoso. Refer to note 9 Disposal of subsidiaries.
3. On 29 August 2024, the Group completed the sale of Illawarra Metallurgical Coal. Refer to note 9 Disposal of subsidiaries.
All operations are operated by the Group except Brazil Alumina, Brazil Aluminium and Sierra Gorda.
(b)Segment results
The underlying information presented in the Group's segment results include non-IFRS financial measures and differs from the statutory financial information as it reflects the Group's interest in material equity accounted joint ventures on a proportional consolidation basis.
The Group's material equity accounted joint ventures are Australia Manganese and South Africa Manganese, inclusive of an allocation of Manganese Marketing, and Sierra Gorda. Refer to note 8 Equity accounted investments.
Segment performance is measured by Underlying revenue, Underlying EBIT and Underlying EBITDA. Underlying revenue is revenue, adjusted to reflect material equity accounted joint ventures on a proportional consolidation basis. Underlying EBIT is profit/(loss) before net finance income/(costs), income tax (expense)/benefit, and other earnings adjustment items, all adjusted to reflect material equity accounted joint ventures on a proportional consolidation basis. Underlying EBITDA is Underlying EBIT before depreciation and amortisation, adjusted to reflect material equity accounted joint ventures on a proportional consolidation basis.
Reconciliations of the underlying information to the statutory information included in the Group's consolidated financial statements are set out in note 3(b)(i) Underlying results reconciliation, including joint venture adjustments which reconcile the proportional consolidation of the material equity accounted joint ventures back to their statutory equity accounting positions.
The Group separately discloses sales of group production from sales of third party products and services because of the significant difference in profit margin earned on these sales.
It is the Group's policy that inter-segment transactions are made on an arm's length basis.
Group and unallocated items/eliminations represent group centre functions and consolidation adjustments.
Group financing and income taxes are primarily managed on a Group basis and are not allocated to operating segments.
Total assets and liabilities for each continuing operating segment represent operating assets and liabilities which predominantly exclude the carrying amount of non-material equity accounted investments, cash, interest bearing liabilities, tax balances and certain other financial assets and liabilities.
3.Segment information continued
(b)Segment results continued
| Continuing operations |
|
|
| Discontinued operations |
| ||||||||||
H1 FY26 US$M | Worsley Alumina | Brazil Alumina | Brazil Aluminium | Hillside Aluminium | Mozal Aluminium | Sierra Gorda1 | Cannington | Hermosa | Australia Manganese1 |
South Africa Manganese1 | Group and unallocated items/ eliminations | Group underlying results from continuing operations |
| Cerro Matoso2 | Illawarra Metallurgical Coal2 | Group underlying results1 |
Revenue from customers | 747 | 268 | 204 | 1,017 | 473 | 520 | 350 | - | 304 | 165 | (343) | 3,705 |
| 193 | - | 3,898 |
Other revenue3 | (1) | (1) | - | 4 | - | 58 | 46 | - | 2 | 2 | - | 110 |
| - | - | 110 |
Total underlying revenue | 746 | 267 | 204 | 1,021 | 473 | 578 | 396 | - | 306 | 167 | (343) | 3,815 |
| 193 | - | 4,008 |
Comprising: |
|
|
|
|
|
|
|
|
|
|
|
|
|
|
|
|
Group production | 358 | 176 | 204 | 1,021 | 473 | 578 | 396 | - | 306 | 167 | - | 3,679 |
| 193 | - | 3,872 |
Third party products and services4 | - | - | - | - | - | - | - | - | - | - | 136 | 136 |
| - | - | 136 |
Inter-segment revenue | 388 | 91 | - | - | - | - | - | - | - | - | (479) | - |
| - | - | - |
Total underlying revenue | 746 | 267 | 204 | 1,021 | 473 | 578 | 396 | - | 306 | 167 | (343) | 3,815 |
| 193 | - | 4,008 |
|
|
|
|
|
|
|
|
|
|
|
|
|
|
|
|
|
Underlying EBITDA | 153 | 25 | (12) | 204 | 59 | 393 | 211 | (24) | 107 | 8 | (28) | 1,096 |
| 11 | - | 1,107 |
Underlying depreciation and amortisation | (83) | (28) | (3) | (33) | (1) | (95) | (48) | (4) | (41) | (10) | (14) | (360) |
| - | - | (360) |
Underlying EBIT | 70 | (3) | (15) | 171 | 58 | 298 | 163 | (28) | 66 | (2) | (42) | 736 |
| 11 | - | 747 |
Comprising: |
|
|
|
|
|
|
|
|
|
|
|
|
|
|
|
|
Group production | 72 | 10 | (15) | 171 | 58 | 301 | 164 | (28) | 69 | (2) | (33) | 767 |
| 12 | - | 779 |
Exploration expenditure expensed | (2) | - | - | - | - | (3) | (1) | - | (3) | - | (15) | (24) |
| (1) | - | (25) |
Third party products and services4 | - | - | - | - | - | - | - | - | - | - | 6 | 6 |
| - | - | 6 |
Share of profit/(loss) of equity accounted investments | - | (13) | - | - | - | - | - | - | - | - | - | (13) |
| - | - | (13) |
Underlying EBIT | 70 | (3) | (15) | 171 | 58 | 298 | 163 | (28) | 66 | (2) | (42) | 736 |
| 11 | - | 747 |
Underlying net finance costs |
|
|
|
|
|
|
|
|
|
|
| (77) |
| (4) | - | (81) |
Underlying income tax expense |
|
|
|
|
|
|
|
|
|
|
| (207) |
| - | - | (207) |
Underlying royalty related tax expense |
|
|
|
|
|
|
|
|
|
|
| (25) |
| - | - | (25) |
Underlying earnings |
|
|
|
|
|
|
|
|
|
|
| 427 |
| 7 | - | 434 |
Total adjustments to profit/(loss)5 |
|
|
|
|
|
|
|
|
|
|
| 5 |
| 5 | 19 | 29 |
Profit/(loss) for the period |
|
|
|
|
|
|
|
|
|
|
| 432 |
| 12 | 19 | 463 |
|
|
|
|
|
|
|
|
|
|
|
|
|
|
|
|
|
Underlying exploration expenditure | 2 | - | - | - | - | 7 | 3 | 14 | 3 | - | 15 | 44 |
| 1 | - | 45 |
Underlying capital expenditure6 | 73 | 5 | 9 | 34 | 4 | 116 | 23 | 338 | 46 | 18 | 4 | 670 |
| 8 | - | 678 |
Underlying equity accounted investments | - | 2 | - | - | - | - | - | - | - | - | - | 2 |
| - | - | 2 |
Total underlying assets7 | 2,770 | 869 | 208 | 1,103 | 239 | 2,107 | 583 | 2,579 | 762 | 394 | 3,224 | 14,838 |
| - | - | 14,838 |
Total underlying liabilities7 | 1,048 | 198 | 69 | 366 | 190 | 217 | 448 | 181 | 498 | 128 | 2,239 | 5,582 |
| - | - | 5,582 |
1. The segment information reflects the Group's interest in material equity accounted joint ventures and is presented on a proportional consolidation basis, which is the measure used by the Group's management to assess their performance. The Group's underlying results includes the proportional elimination of revenue and corresponding expenses relating to freight services provided by the Group to material joint ventures of US$61 million and third party product revenue of US$16 million included in Group and unallocated items/eliminations. Refer to note 3(b)(i) Underlying results reconciliation for the joint venture adjustments that reconcile the underlying proportional consolidation to the statutory financial information.
2. The Cerro Matoso and Illawarra Metallurgical Coal operating segments have been classified as discontinued operations. Refer to note 9 Disposal of subsidiaries.
3. Underlying other revenue relates to fair value movements on provisionally priced contracts.
4. Underlying revenue on third party products and services sold from continuing operations comprises US$36 million for aluminium, US$16 million for manganese, US$44 million for freight services and US$40 million for raw materials. Underlying EBIT on third party products and services sold from continuing operations comprises US$3 million for aluminium, US$4 million for alumina, US$(2) million for freight services and US$1 million for raw materials.
5. Represents the total of all adjustments made to operating profit/(loss), net finance income/(costs) and income tax (expense)/benefit. Refer to note 3(b)(i) Underlying results reconciliation for further details.
6. Underlying capital expenditure excludes the purchase of intangibles and capitalised exploration expenditure.
7. Total underlying assets and liabilities for each continuing operating segment represent operating assets and liabilities which predominantly exclude the carrying amount of non-material equity accounted investments, cash, interest bearing liabilities, tax balances and certain other financial assets and liabilities.
3.Segment information continued
(b)Segment results continued
| Continuing operations |
|
|
| Discontinued operations |
| ||||||||||
H1 FY25 Restated1 US$M | Worsley Alumina | Brazil Alumina | Brazil Aluminium | Hillside Aluminium | Mozal Aluminium | Sierra Gorda2 | Cannington | Hermosa | Australia Manganese2 |
South Africa Manganese2 | Group and unallocated items/ eliminations | Group underlying results from continuing operations |
| Cerro Matoso1 | Illawarra Metallurgical Coal1 | Group underlying results2 |
Revenue from customers | 915 | 405 | 153 | 985 | 487 | 419 | 332 | - | - | 203 | (403) | 3,496 |
| 239 | 145 | 3,880 |
Other revenue3 | 1 | 3 | - | 1 | 1 | (14) | (9) | - | - | (12) | - | (29) |
| - | (1) | (30) |
Total underlying revenue | 916 | 408 | 153 | 986 | 488 | 405 | 323 | - | - | 191 | (403) | 3,467 |
| 239 | 144 | 3,850 |
Comprising: |
|
|
|
|
|
|
|
|
|
|
|
|
|
|
|
|
Group production | 451 | 280 | 153 | 986 | 488 | 405 | 323 | - | - | 191 | - | 3,277 |
| 239 | 116 | 3,632 |
Third party products and services4 | - | - | - | - | - | - | - | - | - | - | 190 | 190 |
| - | 28 | 218 |
Inter-segment revenue | 465 | 128 | - | - | - | - | - | - | - | - | (593) | - |
| - | - | - |
Total underlying revenue | 916 | 408 | 153 | 986 | 488 | 405 | 323 | - | - | 191 | (403) | 3,467 |
| 239 | 144 | 3,850 |
|
|
|
|
|
|
|
|
|
|
|
|
|
|
|
|
|
Underlying EBITDA | 369 | 174 | (53) | 123 | 66 | 215 | 130 | (15) | (31) | 28 | (82) | 924 |
| 44 | 50 | 1,018 |
Underlying depreciation and amortisation | (89) | (28) | (2) | (34) | (33) | (87) | (41) | (2) | (3) | (10) | (14) | (343) |
| (12) | - | (355) |
Underlying EBIT | 280 | 146 | (55) | 89 | 33 | 128 | 89 | (17) | (34) | 18 | (96) | 581 |
| 32 | 50 | 663 |
Comprising: |
|
|
|
|
|
|
|
|
|
|
|
|
|
|
|
|
Group production | 280 | 159 | (55) | 89 | 33 | 128 | 90 | (17) | (31) | 18 | (88) | 606 |
| 33 | 50 | 689 |
Exploration expenditure expensed | - | - | - | - | - | - | (1) | - | (3) | - | (18) | (22) |
| (1) | - | (23) |
Third party products and services4 | - | - | - | - | - | - | - | - | - | - | 10 | 10 |
| - | - | 10 |
Share of profit/(loss) of equity accounted investments | - | (13) | - | - | - | - | - | - | - | - | - | (13) |
| - | - | (13) |
Underlying EBIT | 280 | 146 | (55) | 89 | 33 | 128 | 89 | (17) | (34) | 18 | (96) | 581 |
| 32 | 50 | 663 |
Underlying net finance costs |
|
|
|
|
|
|
|
|
|
|
| (87) |
| (3) | (2) | (92) |
Underlying income tax expense |
|
|
|
|
|
|
|
|
|
|
| (166) |
| (9) | (14) | (189) |
Underlying royalty related tax expense |
|
|
|
|
|
|
|
|
|
|
| (8) |
| - | - | (8) |
Underlying earnings |
|
|
|
|
|
|
|
|
|
|
| 320 |
| 20 | 34 | 374 |
Total adjustments to profit/(loss)5 |
|
|
|
|
|
|
|
|
|
|
| 36 |
| (3) | (48) | (15) |
Profit/(loss) for the period |
|
|
|
|
|
|
|
|
|
|
| 356 |
| 17 | (14) | 359 |
|
|
|
|
|
|
|
|
|
|
|
|
|
|
|
|
|
Underlying exploration expenditure | - | - | - | - | - | 7 | 3 | 16 | 3 | - | 18 | 47 |
| 1 | 1 | 49 |
Underlying capital expenditure6 | 50 | 27 | 6 | 19 | 12 | 106 | 23 | 248 | 47 | 25 | 2 | 565 |
| 13 | 57 | 635 |
Underlying equity accounted investments8 | - | 15 | - | - | - | - | - | - | - | - | - | 15 |
| - | - | 15 |
Total underlying assets7 | 2,767 | 842 | 130 | 1,157 | 353 | 1,982 | 576 | 2,228 | 737 | 385 | 3,259 | 14,416 |
| 330 | - | 14,746 |
Total underlying liabilities7 | 1,060 | 204 | 59 | 369 | 201 | 213 | 445 | 196 | 497 | 133 | 2,246 | 5,623 |
| 266 | - | 5,889 |
1. Refer to note 9 Disposal of subsidiaries.
2. The segment information reflects the Group's interest in material equity accounted joint ventures and is presented on a proportional consolidation basis, which is the measure used by the Group's management to assess their performance. The Group's underlying results includes the proportional elimination of revenue and corresponding expenses relating to freight services provided by the Group to material joint ventures of US$32 million and third party product revenue of US$19 million included in Group and unallocated items/eliminations. Refer to note 3(b)(i) Underlying results reconciliation for the joint venture adjustments that reconcile the underlying proportional consolidation to the statutory financial information.
3. Underlying other revenue relates to fair value movements on provisionally priced contracts.
4. Underlying revenue on third party products and services sold from continuing operations comprises US$87 million for aluminium, US$6 million for alumina, US$19 million for manganese, US$26 million for freight services and US$52 million for raw materials. Underlying EBIT on third party products and services sold from continuing operations comprises US$2 million for aluminium, US$10 million for alumina and US$(2) million for freight services.
5. Represents the total of all adjustments made to operating profit/(loss), net finance income/(costs) and income tax (expense)/benefit. Refer to note 3(b)(i) Underlying results reconciliation for further details.
6. Underlying capital expenditure excludes the purchase of intangibles and capitalised exploration expenditure.
7. Underlying equity accounted investments, total underlying assets and total underlying liabilities for each operating segment are as at 30 June 2025. Total underlying assets and liabilities for each operating segment represent operating assets and liabilities which predominantly exclude the carrying amount of non-material equity accounted investments, cash, interest bearing liabilities, tax balances and certain other financial assets and liabilities.
3.Segment information continued
(b)Segment results continued
(i)Underlying results reconciliation
The following tables reconcile the underlying segment information to the statutory information included in the Group's half year consolidated financial statements:
H1 FY26 US$M | Continuing operations | Discontinued operations1 | Total |
Underlying EBIT | 736 | 11 | 747 |
Significant items2 | (54) | - | (54) |
Joint venture adjustments3,4 | (241) | - | (241) |
Exchange rate gains/(losses) on restatement of monetary items5 | (7) | (1) | (8) |
Impairment (losses)/reversals of financial assets5,6 | 77 | - | 77 |
Gain on the disposal of subsidiaries and joint operations7 | - | 21 | 21 |
Gains/(losses) on derivative instruments and contingent consideration measured at FVTPL5,8 | 21 | - | 21 |
Operating profit/(loss) | 532 | 31 | 563 |
|
|
|
|
Underlying net finance cost | (77) | (4) | (81) |
Joint venture adjustments3,4 | 111 | - | 111 |
Exchange rate variations on net cash/(debt) | (26) | 1 | (25) |
Net finance income/(costs) | 8 | (3) | 5 |
|
|
|
|
Underlying income tax expense | (207) | - | (207) |
Underlying royalty related tax expense | (25) | - | (25) |
Joint venture adjustments relating to income tax expense3,4 | 72 | - | 72 |
Joint venture adjustments relating to royalty related tax expense4,5 | 25 | - | 25 |
Tax effect of other adjustments to derive Underlying EBIT | 7 | - | 7 |
Tax effect of other adjustments to derive Underlying net finance costs | 7 | - | 7 |
Exchange rate variations on tax balances | 13 | 3 | 16 |
Income tax (expense)/benefit | (108) | 3 | (105) |
|
|
|
|
Underlying earnings | 427 | 7 | 434 |
Total adjustments to profit/(loss) | 5 | 24 | 29 |
Profit/(loss) for the period | 432 | 31 | 463 |
|
|
|
|
Underlying earnings attributable to: |
|
|
|
Equity holders of South32 Limited | 428 | 7 | 435 |
Non-controlling interests | (1) | - | (1) |
1. Refer to note 9 Disposal of subsidiaries.
2. Refer to note 3(b)(ii) Significant items.
3. The segment information reflects the Group's interest in material equity accounted joint ventures and is presented on a proportional consolidation basis, which is the measure used by the Group's management to assess their performance. Joint venture adjustments reconcile the proportional consolidation to the statutory equity accounting positions, recognised in share of profit/(loss) of equity accounted investments in the Consolidated income statement.
4. The net impact of all joint venture adjustments to the Group's profit/(loss) for the period amounts to US$(33) million of which US$(91) million relates to the Sierra Gorda segment and US$58 million relates to the Australia Manganese segment. The Sierra Gorda joint venture adjustments include a revaluation loss of US$77 million (US$56 million post-tax) relating to the shareholder loan payable that was eliminated from the Group's Underlying earnings upon proportional consolidation, and a royalty related tax expense significant item of US$34 million relating to the remeasurement of deferred tax balances to reflect the revised royalty rates associated with the Mining Royalty Law in Chile. The Australia Manganese joint venture adjustments include a significant item of US$92 million (US$59 million post-tax) relating to insurance income recognised as Australia Manganese finalised its insurance recoveries for the impacts of Tropical Cyclone Megan at Groote Eylandt Mining Company Pty Ltd (GEMCO) in March 2024.
5. Recognised in expenses excluding finance costs in the Consolidated income statement.
6. Refer to note 3(b)(iii) Impairment of financial assets.
7. Includes a gain of US$2 million for the disposal of Cerro Matoso and a gain of US$19 million in relation to the FY25 disposal of Illawarra Metallurgical Coal following the finalisation of working capital, net debt and capital expenditure adjustments during H1 FY26.
8. Includes a loss of US$33 million on the revaluation of the contingent consideration receivable from the divestment of Illawarra Metallurgical Coal and a gain of US$55 million on the revaluation of the contingent consideration payable for the acquisition of Sierra Gorda.
3.Segment information continued
(b)Segment results continued
(i)Underlying results reconciliation continued
H1 FY25 Restated1 US$M | Continuing operations | Discontinued operations1 | Total |
Underlying EBIT | 581 | 82 | 663 |
Joint venture adjustments2,3 | (22) | - | (22) |
Exchange rate gains/(losses) on restatement of monetary items4 | (4) | (3) | (7) |
Impairment (losses)/reversals of financial assets4,5 | (71) | - | (71) |
Loss on the disposal of subsidiaries and joint operations | - | (47) | (47) |
Gains/(losses) on derivative instruments and contingent consideration measured at FVTPL4,6 | 4 | - | 4 |
Operating profit/(loss) | 488 | 32 | 520 |
|
|
|
|
Underlying net finance cost | (87) | (5) | (92) |
Joint venture adjustments2,3 | 115 | - | 115 |
Exchange rate variations on net cash/(debt) | 38 | (1) | 37 |
Net finance income/(costs) | 66 | (6) | 60 |
|
|
|
|
Underlying income tax expense | (166) | (23) | (189) |
Underlying royalty related tax expense | (8) | - | (8) |
Joint venture adjustments relating to income tax expense2,3 | (1) | - | (1) |
Joint venture adjustments relating to royalty related tax expense2,3 | 8 | - | 8 |
Tax effect of other adjustments to derive Underlying EBIT | (1) | 1 | - |
Tax effect of other adjustments to derive Underlying net finance costs | (11) | - | (11) |
Exchange rate variations on tax balances | (19) | (1) | (20) |
Income tax (expense)/benefit | (198) | (23) | (221) |
|
|
|
|
Underlying earnings | 320 | 54 | 374 |
Total adjustments to profit/(loss) | 36 | (51) | (15) |
Profit/(loss) for the period | 356 | 3 | 359 |
|
|
|
|
Underlying earnings attributable to: |
|
|
|
Equity holders of South32 Limited | 321 | 54 | 375 |
Non-controlling interests | (1) | - | (1) |
1. Refer to note 9 Disposal of subsidiaries.
2. The segment information reflects the Group's interest in material equity accounted joint ventures and is presented on a proportional consolidation basis, which is the measure used by the Group's management to assess their performance. Joint venture adjustments reconcile the proportional consolidation to the statutory equity accounting positions, recognised in share of profit/(loss) of equity accounted investments in the Consolidated income statement.
3. The net impact of all joint venture adjustments to the Group's profit/(loss) for the year amounts to US$100 million of which US$53 million relates to the Sierra Gorda segment and US$47 million relates to the Australia Manganese segment. The Sierra Gorda joint venture adjustments include a revaluation gain of US$71 million (US$52 million post-tax) relating to the shareholder loan payable that was eliminated from the Group's Underlying earnings upon proportional consolidation. The Australia Manganese joint venture adjustments include a significant item of US$76 million (US$48 million post-tax) relating to the impacts of Tropical Cyclone Megan at GEMCO in March 2024, including insurance income, expenses relating to idle capacity charges, repairs and clean-up costs.
4. Recognised in expenses excluding finance costs in the Consolidated income statement.
5. Refer to note 3(b)(iii) Impairment of financial assets.
6. Includes a gain of US$53 million on the revaluation of the contingent consideration receivable from the divestment of Illawarra Metallurgical Coal and a loss of US$50 million on the revaluation of the contingent consideration payable for the acquisition of Sierra Gorda.
3.Segment information continued
(b)Segment results continued
(i)Underlying results reconciliation continued
H1 FY26 US$M | Group underlying results | Joint venture adjustments | Discontinued operations adjustments1 | Group statutory results |
Total revenue | 4,008 | (1,006) | (193) | 2,809 |
Depreciation and amortisation | 360 | (146) | - | 214 |
Share of profit/(loss) of equity accounted investments | (13) | 128 | - | 115 |
Exploration expenditure2 | 45 | (10) | - | 35 |
Capital expenditure2 | 678 | (180) | - | 498 |
Equity accounted investments | 2 | 641 | - | 643 |
Total assets | 14,838 | (1,041) | - | 13,797 |
Total liabilities | 5,582 | (1,041) | - | 4,541 |
1. Refer to note 9 Disposal of subsidiaries.
2. The Group statutory results include the cash flows from discontinued operations, consistent with the Consolidated cash flow statement.
H1 FY25 Restated1 US$M | Group underlying results | Joint venture adjustments | Discontinued operations adjustments1 | Group statutory results |
Total revenue | 3,850 | (583) | (383) | 2,884 |
Depreciation and amortisation | 355 | (100) | (12) | 243 |
Share of profit/(loss) of equity accounted investments | (13) | 93 | - | 80 |
Exploration expenditure2 | 49 | (10) | - | 39 |
Capital expenditure2 | 635 | (178) | - | 457 |
Equity accounted investments3 | 15 | 575 | - | 590 |
Total assets3 | 14,746 | (1,019) | - | 13,727 |
Total liabilities3 | 5,889 | (1,019) | - | 4,870 |
1. Refer to note 9 Disposal of subsidiaries.
2. The Group statutory results include the cash flows from discontinued operations, consistent with the Consolidated cash flow statement.
3. Equity accounted investments, total assets and total liabilities are as at 30 June 2025.
(ii)Significant items
Significant items are those items, not separately identified in note 3(b)(i) Underlying results reconciliation, whose nature and amount are considered material to the Group's consolidated financial statements.
H1 FY26 US$M | Gross | Tax | Net |
Mozal Aluminium care and maintenance impacts | (54) | - | (54) |
Total significant items | (54) | - | (54) |
Mozal Aluminium care and maintenance impacts
In December 2025, the Group announced that Mozal Aluminium will transition to care and maintenance in March 2026 as the Group has been unable to secure sufficient and affordable electricity supply for Mozal Aluminium beyond March 2026, when the current electricity supply agreement expires. As a result, the Group has recognised expenses in H1 FY26 that do not reflect the performance of the underlying operation, and which have therefore been classified as significant items.
In FY25 the Group had recognised the maximum impairment of property, plant and equipment and intangible assets after considering the recoverable amount of individual assets within the Mozal Aluminium cash generating unit, as well as a write-down of inventory based on management's estimated net realisable value of the inventory on hand at that time. In H1 FY26 the Group recognised further inventory write-downs of US$26 million, a provision for employee redundancies of US$25 million, and an onerous contract payable of US$3 million. These costs, totalling US$54 million, are included in expenses excluding finance costs in the Consolidated income statement.
There were no significant items within the Group's consolidated financial statements for the half year ended 31 December 2024.
3.Segment information continued
(b)Segment results continued
(iii)Impairment of financial assets
The Group recognised the following impairment (losses)/reversals of financial assets:
US$M | H1 FY26 | H1 FY25 |
Trade and other receivables | 77 | (71) |
Total net impairment (losses)/reversals of financial assets1 | 77 | (71) |
1. Relates to the purchased credit impaired receivable from Sierra Gorda.
Shareholder loan receivable from Sierra Gorda
The loan has a contractual interest rate of 8 per cent and the repayment of the loan by Sierra Gorda is dependent on its financial performance. At 31 December 2025, the Group updated its estimated timing of the loan repayments and as a result recognised an impairment reversal of US$77 million (H1 FY25: impairment of US$71 million) which is included in expenses excluding finance costs in the Consolidated income statement. The net present value of the expected future cash flows of the loan was informed by, and is sensitive to, the Group's copper price assumption, with a range of US$4.73/lb - US$4.88/lb used, in real terms, and a production profile and costs based on management's planning processes. An effective interest rate of 9 per cent, as determined on the date of acquisition, was applied to discount the future loan repayments.
4.Dividends
US$M | H1 FY26 | H1 FY25 |
Prior year final dividend1 | 117 | 140 |
Total dividends declared and paid during the period | 117 | 140 |
1. On 28 August 2025, the Directors resolved to pay a fully franked final dividend of US 2.6 cents per share (US$117 million) in respect of the 2025 financial year. The dividend was paid on 16 October 2025.
5.Earnings per share
Basic earnings/(loss) per share amounts are calculated based on profit or loss attributable to equity holders of South32 Limited and the weighted average number of shares outstanding during the period.
Diluted earnings/(loss) per share amounts are calculated based on profit or loss attributable to equity holders of South32 Limited and the weighted average number of shares outstanding after adjustment for the effects of all dilutive potential shares.
The following reflects the profit or loss and share data used in the basic and diluted earnings/(loss) per share computations:
Profit/(loss) attributable to equity holders US$M | H1 FY26 | H1 FY25Restated1 |
Continuing operations | 433 | 357 |
Discontinued operations | 31 | 3 |
Profit/(loss) attributable to equity holders of South32 Limited (basic) | 464 | 360 |
Profit/(loss) attributable to equity holders of South32 Limited (diluted) | 464 | 360 |
1. Refer to note 9 Disposal of subsidiaries.
Weighted average number of shares Million | H1 FY26 | H1 FY25 |
Basic earnings/(loss) per share denominator1 | 4,491 | 4,515 |
Shares contingently issuable under ESOPs | 10 | 13 |
Diluted earnings/(loss) per share denominator | 4,501 | 4,528 |
1. The basic earnings/(loss) per share denominator is the aggregate of the weighted average number of shares after deduction of the weighted average number of treasury shares outstanding and shares permanently cancelled through the on-market share buy-back program.
Earnings/(loss) per share US cents | H1 FY26 | H1 FY25Restated1 |
Continuing operations |
|
|
Basic earnings/(loss) per share | 9.6 | 7.9 |
Diluted earnings/(loss) per share | 9.6 | 7.9 |
Attributable to ordinary equity holders of South32 Limited |
|
|
Basic earnings/(loss) per share | 10.3 | 8.0 |
Diluted earnings/(loss) per share | 10.3 | 8.0 |
1. Refer to note 9 Disposal of subsidiaries.
6.Net finance income/(costs)
US$M | H1 FY26 | H1 FY25Restated1 |
Finance income |
|
|
Interest on loans to equity accounted investments | 88 | 91 |
Other interest income | 48 | 40 |
Total finance income | 136 | 131 |
Finance costs |
|
|
Interest on borrowings | (27) | (29) |
Interest on lease liabilities | (27) | (27) |
Discounting on provisions and other liabilities | (48) | (47) |
Exchange rate variations on net cash/(debt) | (26) | 38 |
Total finance costs | (128) | (65) |
Net finance income/(costs) | 8 | 66 |
1. Refer to note 9 Disposal of subsidiaries.
7.Financial assets and financial liabilities
The following table presents the financial assets and liabilities by class at their carrying amounts:
H1 FY26 US$M | Held at FVTPL | Designated as FVOCI | Amortised cost | Total |
Financial assets |
|
|
|
|
Cash and cash equivalents | - | - | 1,664 | 1,664 |
Trade and other receivables1,2 | 146 | - | 598 | 744 |
Total current financial assets | 146 | - | 2,262 | 2,408 |
Trade and other receivables1,2 | - | - | 1,874 | 1,874 |
Other financial assets: |
|
|
|
|
Investments in equity instruments designated as FVOCI | - | 244 | - | 244 |
Contingent consideration receivable | 26 | - | - | 26 |
Total non-current financial assets | 26 | 244 | 1,874 | 2,144 |
Total financial assets | 172 | 244 | 4,136 | 4,552 |
Financial liabilities |
|
|
|
|
Trade and other payables3 | - | - | 694 | 694 |
Interest bearing liabilities | - | - | 356 | 356 |
Other financial liabilities: |
|
|
|
|
Derivative contracts | 5 | - | - | 5 |
Total current financial liabilities | 5 | - | 1,050 | 1,055 |
Interest bearing liabilities | - | - | 1,333 | 1,333 |
Other financial liabilities: |
|
|
|
|
Contingent consideration payable | 24 | - | - | 24 |
Total non-current financial liabilities | 24 | - | 1,333 | 1,357 |
Total financial liabilities | 29 | - | 2,383 | 2,412 |
1. Includes current loans to equity accounted investments of US$275 million and non-current loans to equity accounted investments of US$1,670 million.
2. Excludes current input taxes of US$115 million and non-current input and other taxes of US$46 million included in other receivables.
3. Excludes current input taxes of US$8 million included in other payables.
FY25 US$M | Held at FVTPL | Designated as FVOCI | Amortised cost | Total |
Financial assets |
|
|
|
|
Cash and cash equivalents | - | - | 1,677 | 1,677 |
Trade and other receivables1,2 | 133 | - | 578 | 711 |
Other financial assets: |
|
|
|
|
Derivative contracts | 7 | - | - | 7 |
Total current financial assets | 140 | - | 2,255 | 2,395 |
Trade and other receivables1,2 | - | - | 1,927 | 1,927 |
Other financial assets: |
|
|
|
|
Investments in equity instruments designated as FVOCI | - | 130 | - | 130 |
Contingent consideration receivable | 54 | - | - | 54 |
Total non-current financial assets | 54 | 130 | 1,927 | 2,111 |
Total financial assets | 194 | 130 | 4,182 | 4,506 |
Financial liabilities |
|
|
|
|
Trade and other payables3 | 2 | - | 796 | 798 |
Interest bearing liabilities | - | - | 267 | 267 |
Total current financial liabilities | 2 | - | 1,063 | 1,065 |
Interest bearing liabilities | - | - | 1,367 | 1,367 |
Other financial liabilities: |
|
|
|
|
Contingent consideration payable | 78 | - | - | 78 |
Total non-current financial liabilities | 78 | - | 1,367 | 1,445 |
Total financial liabilities | 80 | - | 2,430 | 2,510 |
1. Includes current loans to equity accounted investments of US$233 million and non-current loans to equity accounted investments of US$1,737 million.
2. Excludes current input taxes of US$98 million and non-current input and other taxes of US$73 million included in other receivables.
3. Excludes current input taxes of US$4 million included in other payables.
(i)Fair value measurement
The carrying values of the Group's financial assets and liabilities measured at amortised cost are equal to or approximate their respective fair values, except for senior unsecured notes which have a carrying value of US$693 million (FY25: US$693 million) and a fair value of US$678 million (FY25: US$655 million), and lease liabilities with a carrying value of US$733 million (FY25: US$713 million), for which a fair value has not been determined. The fair value of the Group's senior unsecured notes is estimated based on quoted market prices at the reporting date and are classified as Level 1 on the fair value hierarchy as shown below.
For financial assets and liabilities measured at fair value, the Group uses quoted marked prices in active markets for identical assets where available. Where no price information is available from a quoted market source, alternative market mechanisms or recent comparable transactions, the fair value is estimated based on the Group's views, net of valuation allowances, to accommodate for liquidity, modelling, credit and other risks implicit in such estimates.
The following table shows the Group's financial assets and liabilities carried at fair value with reference to the nature of valuation inputs used:
Level 1 | Valuation is based on unadjusted quoted prices in active markets for identical financial assets and liabilities. |
Level 2 | Valuation is based on inputs (other than quoted prices included in Level 1) that are observable for the financial asset or liability, either directly (i.e. as unquoted prices) or indirectly (i.e. derived from prices). |
Level 3 | Valuation includes inputs that are not based on observable market data. |
H1 FY26 US$M | Level 1 | Level 2 | Level 3 | Total |
Financial assets and liabilities |
|
|
|
|
Trade and other receivables | - | 146 | - | 146 |
Derivative contract liabilities | (5) | - | - | (5) |
Investments in equity instruments designated as FVOCI1 | 233 | - | 11 | 244 |
Contingent consideration receivable | - | - | 26 | 26 |
Contingent consideration payable | - | - | (24) | (24) |
Total | 228 | 146 | 13 | 387 |
1. Includes US$81 million for the Group's investment in Trilogy Metals Inc., the Group's joint venture partner in Ambler Metals. In October 2025, the Group entered into an agreement to sell 8.2 million of its shares to the U.S. Department of War for US$18 million and to grant a 10-year call option over a further 6.2 million shares, exercisable at US$0.01 per share following completion of the construction of the Ambler Access Project. The transaction completion remains subject to obtaining the required exchange and regulatory approvals prior to 31 March 2026, after which the agreement may be terminated. As completion remains uncertain, this transaction has not been reflected in the Group's H1 FY26 financial statements. For more information, refer to the South32 7 October 2025 media release "South32 Backs U.S. Government move to advance access to critical minerals in Alaska".
(i)Fair value measurement continued
FY25 US$M | Level 1 | Level 2 | Level 3 | Total |
Financial assets and liabilities |
|
|
|
|
Trade and other receivables | - | 133 | - | 133 |
Trade and other payables | - | (2) | - | (2) |
Derivative contract assets | 7 | - | - | 7 |
Investments in equity instruments designated as FVOCI | 119 | - | 11 | 130 |
Contingent consideration receivable | - | - | 54 | 54 |
Contingent consideration payable | - | - | (78) | (78) |
Total | 126 | 131 | (13) | 244 |
The following table shows the movements in the Group's Level 3 financial assets and liabilities:
US$M | H1 FY26 | H1 FY25 |
At the beginning of the period | (13) | (8) |
Addition of financial assets1 | 5 | 115 |
Net unrealised gains/(losses) recognised in the Consolidated income statement2 | 21 | 3 |
At the end of the period | 13 | 110 |
1. The addition in H1 FY26 relates to the price-linked contingent consideration of up to US$100 million related to the disposal of Cerro Matoso. Refer to note 9 Disposal of subsidiaries.
2. Recognised in expenses excluding finance costs in the Consolidated income statement.
The fair value of the Level 3 financial assets and liabilities is determined using inputs other than observable market data and is calculated using appropriate valuation models, including discounted cash flow modelling, with inputs such as commodity prices, production forecasts and inflation. The potential effect of using reasonably possible alternative assumptions in these models for those assets and liabilities that are material and sensitive to level 3 valuation inputs, based on directionally changing all these inputs either favourably or unfavourably by 10 per cent while holding all other variables constant, is disclosed below:
|
|
| Impact on carrying amount | |
H1 FY26 US$M | Carrying amount | Significant inputs | Favourable | Unfavourable |
Financial assets |
|
|
|
|
Contingent consideration receivable | 21 | Coal price1 Production volumes2 | 119 | (21) |
1. Coal price inputs reflect estimates of future commodity prices.
2. Production volumes inputs reflect estimates of future production.
8.Equity accounted investments
The Group's material interests in equity accounted investments are as follows:
|
|
| Ownership interest % | |
Material joint ventures | Country of incorporation | Principal activity | H1 FY26 | FY25 |
Australia Manganese1,2 | Australia | Manganese ore mine | 60 | 60 |
South Africa Manganese1,3 | South Africa | Manganese ore mines | 60 | 60 |
Manganese Marketing1,4 | Singapore | Sales, marketing and distribution | 60 | 60 |
Sierra Gorda1,5 | Chile | Copper mine | 45 | 45 |
1. Joint control is contractually achieved as joint venture parties unanimously consent on decisions over the joint venture's relevant activities.
2. Australia Manganese consists of an investment in GEMCO.
3. The Group holds a 60 per cent interest in Samancor Holdings (Pty) Ltd (Samancor). Samancor indirectly owns 74 per cent of Hotazel Manganese Mines (Pty) Ltd (HMM), which gives the Group its indirect legal ownership interest of 44.4 per cent. Of the remaining 26 per cent of HMM, 17 per cent of the interests were acquired by B-BBEE entities using vendor finance with the loans repayable via distributions attributable to these parties, pro rata to their share in HMM. Until these loans are repaid, the Group's interest in HMM is accounted for at 54.6 per cent.
4. Manganese Marketing consists of an investment in Samancor Marketing Pte Ltd.
5. Sierra Gorda consists of an investment in Sierra Gorda Sociedad Contractual Minera.
Share of profit/(loss) of equity accounted investments US$M | H1 FY26 | H1 FY25 |
Australia Manganese | 77 | 7 |
South Africa Manganese | (8) | 7 |
Manganese Marketing | 5 | (1) |
Sierra Gorda | 54 | 80 |
Individually immaterial | (13) | (13) |
Total | 115 | 80 |
9.Disposal of subsidiaries
Non-current assets and disposal groups (inclusive of directly associated liabilities) are reclassified to current assets held for sale if their carrying amount is highly probable to be recovered through sale rather than through continuing use, and are available for immediate sale in their present condition.
A discontinued operation is a component of the Group's business that represents a separate major line of business or geographical area of operations that has been disposed of or is classified as held for sale. When an operation is classified as discontinued, the comparative financial results are restated as if the operation had been discontinued from the start of the comparative period.
Cerro Matoso
In July 2025, the Group announced its decision to enter into a binding agreement for the sale of Cerro Matoso to an entity owned by CoreX Holding B.V. The sale completed on 1 December 2025 and resulted in a gain on disposal of US$2 million. The sale consideration included a nominal upfront cash consideration and contingent consideration of up to US$100 million, subject to customary working capital and net debt adjustments.
Cerro Matoso was classified as held for sale and presented separately on the Group's FY25 Consolidated balance sheet. The disposal group represents the entire Cerro Matoso segment, which comprises the Group's 99.9% interest in Cerro Matoso S.A., 100% interest in South32 Energy S.A.S. E.S.P. and other investment holding companies.
Cerro Matoso is an integrated laterite ferronickel mine and smelting complex in Colombia. As a separate major component of the Group, Cerro Matoso has also been presented as a discontinued operation in the Group's Consolidated income statement, with the comparative financial results restated as if the operation had been discontinued from the start of the comparative period.
The results of the discontinued operation are as follows:
US$M | H1 FY26 | H1 FY25 |
Revenue: |
|
|
Group production | 193 | 239 |
| 193 | 239 |
Other income | 1 | 2 |
Expenses excluding finance costs | (184) | (209) |
Gain on disposal of the discontinued operation | 2 | - |
Operating profit/(loss) from a discontinued operation | 12 | 32 |
Finance income | 1 | 1 |
Finance costs | (4) | (4) |
Net finance income/(costs) | (3) | (3) |
Profit/(loss) before tax from a discontinued operation | 9 | 29 |
Income tax (expense)/benefit | 3 | (12) |
Profit/(loss) for the period from a discontinued operation | 12 | 17 |
|
| |
Total comprehensive income from a discontinued operation attributable to the equity holders of South32 Limited | 12 | 17 |
|
| |
Basic earnings/(loss) per share (cents) | 0.3 | 0.4 |
Diluted earnings/(loss) per share (cents) | 0.3 | 0.4 |
The cash flows from the discontinued operation are as follows:
US$M | H1 FY26 | H1 FY25 |
Net cash flows from operating activities | 2 | 21 |
Net cash flows from investment activities | (27) | (13) |
The effect of disposal on the results and financial position of the Group is as follows:
US$M | H1 FY26 |
Consideration |
|
Upfront consideration, net of transaction costs | 12 |
Contingent price-linked consideration | 5 |
Total consideration | 17 |
Net assets disposed of |
|
Cash and cash equivalents | 21 |
Trade and other receivables | 56 |
Inventories | 109 |
Property, plant and equipment | 86 |
Intangible assets | 5 |
Current tax assets | 9 |
Deferred tax assets | 2 |
Other assets | 1 |
Trade and other payables | (63) |
Interest bearing liabilities | (4) |
Provisions | (207) |
Net assets disposed of | 15 |
Gain on disposal | 2 |
|
|
Consideration received, net of transaction costs, satisfied in cash | 2 |
Cash and cash equivalents disposed of | (21) |
Net cash outflow | (19) |
Illawarra Metallurgical Coal
In February 2024, the Group announced its decision to enter into a binding agreement for the sale of Illawarra Metallurgical Coal to an entity owned by Golden Energy and Resources Pte Ltd (GEAR) and M Resources Pty Ltd (M Resources). The sale completed on 29 August 2024 and resulted in an overall net loss on disposal of US$28 million, of which an estimated loss of US$47 million was recognised in FY25 and a gain of US$19 million recognised in H1 FY26 upon finalisation of the working capital, net debt and capital expenditure adjustments to the upfront consideration. The sale consideration included an upfront and deferred cash consideration of US$1,300 million, before adjustments, and contingent price-linked consideration of up to US$350 million.
The disposal group represents the entire Illawarra Metallurgical Coal segment, which comprises Illawarra Coal Holdings Pty Ltd and its subsidiaries, a 16.7 per cent interest in the Port Kembla Coal Terminal, and certain associated external contractual arrangements held by South32 Marketing Pte Ltd which were novated to Illawarra Metallurgical Coal prior to completion. As a separate major component of the Group, Illawarra Metallurgical Coal has also been presented as a discontinued operation in the Group's Consolidated income statement.
The results of the discontinued operation are as follows:
US$M | H1 FY26 | H1 FY25 |
Revenue: |
|
|
Group production | - | 116 |
Third party products and services | - | 28 |
| - | 144 |
Expenses excluding finance costs | - | (97) |
Gain/(loss) on disposal of the discontinued operation | 19 | (47) |
Operating profit/(loss) from a discontinued operation | 19 | - |
Finance costs | - | (3) |
Net finance income/(costs) | - | (3) |
Profit/(loss) before tax from a discontinued operations | 19 | (3) |
Income tax (expense)/benefit | - | (11) |
Profit/(loss) for the period from a discontinued operation | 19 | (14) |
|
| |
Total comprehensive income/(loss) from a discontinued operation attributable to the equity holders of South32 Limited | 19 | (14) |
|
| |
Basic earnings/(loss) per share (cents) | 0.4 | (0.3) |
Diluted earnings/(loss) per share (cents) | 0.4 | (0.3) |
The cash flows from the discontinued operation are as follows:
US$M | H1 FY26 | H1 FY25 |
Net cash flows from operating activities | - | 86 |
Net cash flows from investment activities | 29 | 880 |
Net cash flows from financing activities | - | (1) |
10.Subsequent events
Capital management
On 12 February 2026, the Directors resolved to pay a fully-franked interim dividend of US 3.9 cents per share (US$175 million) in respect of the 2026 financial half year. The dividends will be paid on 2 April 2026. The dividends have not been provided for in the half year consolidated financial statements and will be recognised in the second half of the 2026 financial year.
On 12 February 2026, the Directors resolved to increase the existing on-market share buy-back program by US$100 million, with US$209 million remaining to be returned to shareholders by 26 February 2027.
No other matters or circumstances have arisen since the end of the period that have significantly affected, or may significantly affect, the operations, results of operations or state of affairs of the Group in subsequent accounting periods.
Directors' declaration
In accordance with a resolution of the Directors of the Company, we state that:
In the opinion of the Directors:
(a) The consolidated financial statements and notes that are set out on pages 37 to 55 for the half year ended 31 December 2025 are in accordance with the Corporations Act 2001, including:
(i) Giving a true and fair view of the Group's financial position as at 31 December 2025 and of its performance for the half year ended on that date; and
(ii) Complying with Australian Accounting Standard AASB 134 Interim Financial Reporting and Corporations Regulations 2001.
(b) There are reasonable grounds to believe that the Company will be able to pay its debts as and when they become due and payable.
Signed in accordance with a resolution of the Board of Directors.
Karen Wood AMChair
Graham KerrChief Executive Officer and Managing Director
Dated 12 February 2026
Directors' report
The Directors of the Group present the consolidated financial statements for the half year ended 31 December 2025 and the auditor's review report thereon.
Directors
The Directors of the Company, both during and since the end of the period, are:
Ms Karen Wood AM
Mr Graham Kerr
Mr Frank Cooper AO (retired 23 October 2025)
Dr Xiaoling Liu
Mr Carlos Mesquita
Dr Ntombifuthi (Futhi) Mtoba (retired 23 October 2025)
Ms Jane Nelson
Mr Wayne Osborn
Ms Sharon Warburton
Mr Stephen Pearce
Ms Mandlesilo (Mandla) Msimang
Mr Geoff Healy (appointed 2 December 2025)
The company secretary of the Company, both during and since the end of the period, is Claire Tolcon.
Review and results of operations
A review of the operations of the consolidated entity during the period and of the results of those operations is contained on pages 3 to 32.
Strategic risks and uncertainties
Due to the international scope of the Group's operations and the industries in which it is engaged, there are a number of risk factors and uncertainties which could have an effect on the Group's results and operations over the next six months.
The following information outlines the most significant strategic exposures identified across the Group. The risks are not listed in any particular order:
- Keeping our people safe and well
- Portfolio reshaping
- Climate change and environment
- Maintain, realise or enhance the value of our Mineral Resources and Ore Reserves
- Cybersecurity and privacy
- Predictable operational performance
- Delivering our project portfolio
- Supply chain security
- Shaping our culture and managing diverse talent
- Evolving societal expectations
- Political risks, actions by government and/or authorities
- Global economic uncertainty and liquidity
Further information on these risks and how they are managed can be found on pages 64 to 73 of the Annual Report for the year ended 30 June 2025, a copy of which is available on the Group's website at www.south32.net.
Events subsequent to the balance sheet date
Refer to note 10 Subsequent events to the consolidated financial statements on page 55.
No other matters or circumstances have arisen since the end of the period that have significantly affected, or may significantly affect, the operations, results of operations or state of affairs of the Group in subsequent accounting periods.
UK responsibility statements
The Directors state that to the best of their knowledge the Financial Results and Outlook on pages 3 to 32 is compliant with DTR 4.2.7R and DTR 4.2.8R of the Disclosure Guidance and Transparency Rules in the United Kingdom, namely:
(a) | Includes an indication of important events that have occurred during the first six months of the financial year, and their impact on the condensed set of financial statements, and a description of the principal risks and uncertainties for the remaining six months of the financial year; and |
(b) | Disclosure has been made for related party transactions that have taken place in the first six months of the current financial year and that have materially affected the financial position or performance of the enterprise during that period, and any changes in the related party transactions described in the last annual report that could have a material effect on the financial position or performance of the enterprise in the first six months of the current financial year. |
Lead Auditor's Independence Declaration
A copy of the lead auditor's independence declaration as required under Section 307C of the Corporations Act 2001 is set out on page 59.
Rounding of amounts
The Australian Securities and Investments Commission (ASIC) Corporations (Rounding in Financial/Directors' Reports) Instrument 2016/191 applies to the Group and amounts in the half year consolidated financial statements and this Directors' Report have been rounded in accordance with this instrument to the nearest million US dollars, unless stated otherwise.
This Directors' Report is made in accordance with a resolution of the Board.
Karen Wood AM | Graham Kerr |
Chair | Chief Executive Officer and Managing Director |
Dated 12 February 2026
Lead Auditor's Independence Declaration under
Section 307C of the Corporations Act 2001
To the Directors of South32 Limited
I declare that, to the best of my knowledge and belief, in relation to the review of South32 Limited for the half-year ended 31 December 2025 there have been:
1. no contraventions of the auditor independence requirements as set out in the Corporations Act 2001 in relation to the review; and
2. no contraventions of any applicable code of professional conduct in relation to the review.
|
|
KPMG | Jane Bailey |
| Partner |
| Perth |
| 12 February 2026 |
KPMG, an Australian partnership and a member firm of the KPMG global organisation of independent member firms affiliated with KPMG International Limited, a private English company limited by guarantee. All rights reserved. The KPMG name and logo are trademarks used under license by the independent member firms of the KPMG global organisation. Liability limited by a scheme approved under Professional Standards Legislation.
Independent Auditor's Review Report | |
To the shareholders of South32 Limited | |
Conclusion |
|
We have reviewed the accompanying Half-year Consolidated Financial Statements of South32 Limited. Based on our review, which is not an audit, we have not become aware of any matter that makes us believe that the Half-year Consolidated Financial Statements of South32 Limited does not comply with the Corporations Act 2001, including: - Giving a true and fair view of the Group's financial position as at 31 December 2025 and of its performance for the half-year ended on that date; and - Complying with Australian Accounting Standard AASB 134 Interim Financial Reporting and the Corporations Regulations 2001. | The Half-year Consolidated Financial Statements comprises: - Consolidated balance sheet as at 31 December 2025; - Consolidated income statement, Consolidated statement of comprehensive income, Consolidated statement of changes in equity and Consolidated cash flow statement for the half-year ended on that date; - Notes 1 to 10 comprising a summary of material accounting policies and other explanatory information; and - The Directors' Declaration. The Group comprises South32 Limited (the Company) and the entities it controlled at the half year's end or from time to time during the half-year. |
Basis for Conclusion |
|
We conducted our review in accordance with ASRE 2410 Review of a Financial Report Performed by the Independent Auditor of the Entity and ISRE 2410 Review of interim Financial Information Performed by the Independent Auditor of the Entity. Our responsibilities are further described in the Auditor's Responsibilities for the Review of the Half-year Consolidated Financial Statements section of our report. We are independent of the Group in accordance with the auditor independence requirements of the Corporations Act 2001 and the ethical requirements of the APES 110 Code of Ethics for Professional Accountants (including Independence Standards) issued by the Accounting Professional & Ethical Standards Board Limited (the Code) that are relevant to audits of annual financial reports of public interest entities in Australia. We have fulfilled our other ethical responsibilities in accordance with these requirements. | |
KPMG, an Australian partnership and a member firm of the KPMG global organisation of independent member firms affiliated with KPMG International Limited, a private English company limited by guarantee. All rights reserved. The KPMG name and logo are trademarks used under license by the independent member firms of the KPMG global organisation. Liability limited by a scheme approved under Professional Standards Legislation.
Responsibilities of the Directors for the Half-year Consolidated Financial Statements |
The Directors of the Company are responsible for: - The preparation of the Half-year Consolidated Financial Statements that gives a true and fair view in accordance with Australian Accounting Standards and the Corporations Act 2001; and - Such internal control as the Directors determine is necessary to enable the preparation of the Half-year Consolidated Financial Statements that gives a true and fair view and is free from material misstatement, whether due to fraud or error.
|
Auditor's Responsibilities for the Review of the Half-year Consolidated Financial Statements |
Our responsibility is to express a conclusion on the Half-year Consolidated Financial Statements based on our review. ASRE 2410 and ISRE 2410 require us to conclude whether we have become aware of any matter that makes us believe that the Half-year Consolidated Financial Statements does not comply with the Corporations Act 2001 including giving a true and fair view of the Group's financial position as at 31 December 2025 and its performance for the half-year ended on that date, and complying with Australian Accounting Standard AASB 134 Interim Financial Reporting and the Corporations Regulations 2001. A review of Half-year Consolidated Financial Statements consists of making enquiries, primarily of persons responsible for financial and accounting matters, and applying analytical and other review procedures. A review is substantially less in scope than an audit conducted in accordance with Australian Auditing Standards and consequently does not enable us to obtain assurance that we would become aware of all significant matters that might be identified in an audit. Accordingly, we do not express an audit opinion. |
KPMG | Jane Bailey |
| Partner |
| Perth |
| 12 February 2026 |
Forward-looking statements
This release contains forward-looking statements, including statements about trends in commodity prices and currency exchange rates; demand for commodities; production forecasts; plans, strategies and objectives of management; capital costs and scheduling; operating costs; anticipated productive lives of projects, mines and operations; and provisions and contingent liabilities. These forward-looking statements reflect expectations at the date of this release, however they are not guarantees or predictions of future performance. They involve known and unknown risks, uncertainties and other factors, many of which are beyond our control, and which may cause actual results to differ materially from those expressed in the statements contained in this release. Readers are cautioned not to put undue reliance on forward-looking statements. Except as required by applicable laws or regulations, the South32 Group does not undertake to publicly update or review any forward-looking statements, whether as a result of new information or future events. Past performance cannot be relied on as a guide to future performance. South32 cautions against reliance on any forward-looking statements or guidance.
Non-IFRS financial information
This release includes certain non-IFRS financial measures, including Underlying earnings, Underlying EBIT and Underlying EBITDA, Underlying revenue, Underlying net finance costs, Underlying depreciation and amortisation, Underlying operating costs, Underlying income tax expense, Underlying royalty related tax expense, Basic Underlying earnings per share, Underlying effective tax rate, Underlying EBIT margin, Underlying EBITDA margin, Free cash flow, net cash/debt, net operating assets and ROIC. These measures are used internally by management to assess the performance of our business, make decisions on the allocation of our resources and assess operational management. Non-IFRS measures have not been subject to audit or review and should not be considered as an indication of or alternative to an IFRS measure of profitability, financial performance or liquidity.
No offer of securities
Nothing in this release should be read or understood as an offer or recommendation to buy or sell South32 securities, or be treated or relied upon as a recommendation or advice by South32.
No financial or investment advice - South Africa
South32 does not provide any financial or investment 'advice' as that term is defined in the South African Financial Advisory and Intermediary Services Act, 37 of 2002, and we strongly recommend that you seek professional advice.
FURTHER INFORMATION
Investor relations Ben BakerM +61 403 763 086 | Media relations Jamie MacdonaldM +61 408 925 140 |
Further information on South32 can be found at www.south32.net.
South32 Limited (ABN 84 093 732 597)
Registered in Australia
(Incorporated in Australia under the Corporations Act 2001)
Registered Office: Level 2, 100 St Georges Terrace
Perth Western Australia 6000 Australia
ISIN: AU000000S320
Approved for release by Graham Kerr, Chief Executive Officer
JSE Sponsor: The Standard Bank of South Africa Limited
12 February 2026
[1] Members are equity holders of South32 Limited. Amounts reported as attributable to members are stated net of amounts attributable to non-controlling interests.
[2] Refer to market release "Completion of Illawarra Metallurgical Coal Sale" dated 29 August 2024.
[3] Refer to market release "Completion of Cerro Matoso Divestment" dated 1 December 2025.
[4] Net tangible assets as at 31 December 2025 includes all right-of-use assets and lease liabilities, in accordance with AASB 16 Leases.
[5] On 29 August 2024, South32 sold its shareholding in Illawarra Metallurgical Coal to an entity owned by Golden Energy and Resources Pte Ltd and M Resources Pty Ltd. As a result, Illawarra Metallurgical Coal was classified as a discontinued operation in the H1 FY26 and H1 FY25 results.
[6] On 1 December 2025, South32 sold its shareholding in Cerro Matoso to an entity owned by CoreX Holding B.V. As a result, Cerro Matoso was classified as a discontinued operation in the H1 FY26 and H1 FY25 restated results.
[7] Members are equity holders of South32 Limited. Amounts reported as attributable to members are stated net of amounts attributable to non-controlling interests.
[8] Basic earnings per share is calculated as profit/(loss) after tax attributable to members divided by the weighted average number of shares for the period. Basic Underlying earnings per share is calculated as Underlying earnings attributable to members divided by the weighted average number of shares for the period. The weighted average number of shares for H1 FY26 is 4,491 million (H1 FY25: 4,515 million).
[9] H1 FY26 ordinary dividends per share is calculated as H1 FY26 ordinary dividend announced (US$175M) divided by the number of shares on issue at 31 December 2025 (4,486 million).
[10] The underlying information reflects the Group's interest in material equity accounted joint ventures and is presented on a proportional consolidation basis. Our Group underlying financial measures reflect continuing and discontinued operations. Financial measures listed in this table and subsequently repeated throughout our Financial Results and Outlook Half Year Ended 31 December 2025 are defined in the Glossary of terms and abbreviations on page 28.
[11] Health and safety, and inclusion and diversity metrics listed on this page are defined in the Glossary of terms and abbreviations on page 28.
[12] Production guidance for Hillside Aluminium and Mozal Aluminium does not assume any load-shedding impact on production.
[13] Refer to market release "Mozal Aluminium Update" dated 16 December 2025.
[14] Payable copper equivalent production (kt) was calculated by aggregating revenues from copper, molybdenum, gold and silver, and dividing the total Revenue by the price of copper. FY25 realised prices for copper (US$4.18/lb), molybdenum (US$21.12/lb), gold (US$2,877/oz) and silver (US$31.7/oz) have been used for H1 FY26, FY26e and FY27e.
[15] The information in this announcement that relates to the Exploration Target for the Catabela Northeast prospect was declared as part of South32's "2026 Half Year Financial Results" presentation (www.south32.net) dated 12 February 2026 and prepared by Competent Persons in accordance with the requirements of the JORC Code. South32 confirms that it is not aware of any new information or data that materially affects the information included in the original market announcement. South32 confirms that the form and context in which the Competent Persons findings are presented have not been materially modified from the original market announcement.
[16] Payable zinc equivalent (kt) was calculated by aggregating revenues from payable silver, lead and zinc, and dividing the total Revenue by the price of zinc. FY25 realised prices for zinc (US$2,648/t), lead (US$1,883/t) and silver (US$31.9/oz) have been used for H1 FY26, FY26e and FY27e.
[17]The information in this announcement that relates to Ore Reserve and/or Mineral Resource estimates for Cannington was declared as part of South32's "2026 Half Year Financial Results" presentation (www.south32.net) dated 12 February 2026 and prepared by Competent Persons in accordance with the requirements of the JORC Code. South32 confirms that it is not aware of any new information or data that materially affects the information included in the original market announcement. All material assumptions and technical parameters underpinning the estimates in the relevant market announcement continue to apply and have not materially changed. South32 confirms that the form and context in which the Competent Persons findings are presented have not been materially modified from the original market announcement.
[18] Hermosa growth capital expenditure excludes lease payments of US$24M for self generated power assets directly attributable to construction of infrastructure at the Taylor deposit. These self generated power costs were included in our capital cost estimate provided in market release "Final Investment Approval to Develop Hermosa's Taylor Deposit" dated 15 February 2024.
[19] Hermosa growth capital expenditure guidance excludes expected lease payments of ~US$50M for self generated power assets directly attributable to construction of infrastructure at the Taylor deposit. These self generated power costs were included in our capital cost estimate provided in market release "Final Investment Approval to Develop Hermosa's Taylor Deposit" dated 15 February 2024.
[20] The information in this announcement that relates to the exploration results for the Peake deposit is extracted from the market announcement "2026 Half Year Financial Results" presentation (www.south32.net) dated 12 February 2026. The information was prepared by R Wilson, Competent Person, in accordance with the requirements of the JORC Code. South32 confirms that it is not aware of any new information or data that materially affects the information included in the original market announcement. South32 confirms that the form and context in which the Competent Person's findings are presented have not been materially changed from the original market announcement.
[21] Refer to market release "Completion of Cerro Matoso Divestment" dated 1 December 2025.
[22] Net distributions from our material EAIs (manganese and Sierra Gorda) includes dividends, capital contributions and net repayments/drawdowns of shareholder loans, which should not be considered as an indication of or alternative to an IFRS measure of profitability, financial performance or liquidity. H1 FY26 net distributions from our material EAIs comprise a distribution (+US$180M) from Sierra Gorda and a net distribution from Australia Manganese (+US$60M). The distribution from Sierra Gorda (US$180M) relates to accrued interest.
[23] We returned US$35M via the on-market share buy-back in H1 FY26, purchasing 17M shares at an average price of A$3.08 per share.
[24] Since inception of our capital management program, US$1.8B has been allocated to our on-market share buy-back (837M shares at an average price of A$3.06 per share) and US$525M returned in the form of special dividends.
[25] Our Group underlying financial measures reflect continuing and discontinued operations.
[26] Refer to market release "Mozal Aluminium Update" dated 16 December 2025.
[27] The underlying information reflects the Group's interest in material equity accounted joint ventures and is presented on a proportional consolidation basis, which is the measure used by the Group's management to assess its performance. The joint venture adjustments reconcile the proportional consolidation to the equity accounting position included in the Group's consolidated financial statements.
[28] Applicable for five years from the date of completion of the sale of IMC, with no annual cap. The first two years will be calculated and paid on the second anniversary of completion and annually thereafter. The contingent price-linked consideration will be calculated as 50% of incremental metallurgical coal revenue from equity production, net of royalties, based on the following metallurgical coal price thresholds: Year 1: US$200/t, Year 2: US$200/t, Year 3: US$190/t, Year 4: US$180/t, Year 5: US$180/t.
[29] Under the sale agreement, contingent price-linked consideration of up to US$500M, was payable at threshold copper production rates and prices for years 2022 to 2025. Specifically, 50% of incremental revenue realised above the following copper price threshold, only where payable copper production exceeds the agreed threshold: CY25: US$3.80/lb and 158kt Cu. The production threshold was not achieved in CY25. As a result, no amount is payable for CY25 and the contingent consideration payable was written down to nil in H1 FY26 (FY25: US$55M).
[30] Sales price variance reflects the revenue impact of changes in commodity prices, based on the current period's sales volume. Price-linked costs variance reflects the change in royalties together with the change in input costs driven by changes in commodity prices or market traded consumables. Foreign exchange reflects the impact of exchange rate movements on local currency denominated costs and sales. Sales volume variance reflects the revenue impact of sales volume changes, based on the comparative period's sales prices. Controllable costs variance represents the impact from changes in the Group's controllable local currency cost base, including the variable cost impact of production volume changes on expenditure, and period-on-period movements in inventories. The controllable cost variance excludes earnings adjustments including significant items.
[31] Underlying net finance costs, Underlying income tax expense (includes Underlying royalty related tax expense) and amounts attributable to non-controlling interests are actual H1 FY26 results, not half-on-half variances.
[32] The underlying information reflects the Group's interest in material equity accounted joint ventures and is presented on a proportional consolidation basis, which is the measure used by the Group's management to assess its performance. The joint venture adjustments reconcile the proportional consolidation to the equity accounting position included in the Group's consolidated financial statements.
[33] The corporate tax rates applicable to the countries where the Group operates include: Australia 30%, South Africa 27%, Colombia 35%, Mozambique 0%, Brazil 34% and Chile 27%.
[34] Australia Manganese is subject to a royalty related tax equal to 20% of adjusted EBIT. Sierra Gorda is subject to a royalty related tax based on the amount of copper sold and the mining operating margin, the rate is between 5% and 14% for annual sales over 50kt of refined copper. These royalties are included in Underlying royalty related tax expense.
[35] Net distributions from our material EAIs (manganese and Sierra Gorda) includes dividends, capital contributions and net repayments/drawdowns of shareholder loans, which should not be considered as an indication of or alternative to an IFRS measure of profitability, financial performance or liquidity. H1 FY26 net distributions from our material EAIs comprise a distribution (+US$180M) from Sierra Gorda and a net distribution from Australia Manganese (+US$60M). The distribution from Sierra Gorda (US$180M) relates to accrued interest.
[36] Net interest paid excludes amounts reported as net distributions from material EAIs.
[37] Total capital expenditure comprises capital expenditure, capitalised exploration and the purchase of intangibles. Capital expenditure comprises safe and reliable capital expenditure, improvement and life extension capital expenditure (including decarbonisation), and growth capital expenditure.
[38] Hermosa growth capital expenditure excludes lease payments of US$24M for self generated power assets directly attributable to construction of infrastructure at the Taylor deposit. These self generated power costs were included in our capital cost estimate provided in market release "Final Investment Approval to Develop Hermosa's Taylor Deposit" dated 15 February 2024.
[39] Since inception of our capital management program, US$1.8B has been allocated to our on-market share buy-back (837M shares at an average price of A$3.06 per share) and US$525M returned in the form of special dividends.
[40] Production guidance for Hillside Aluminium and Mozal Aluminium does not assume any load-shedding impact on production.
[41] Payable copper equivalent production (kt) was calculated by aggregating revenues from payable copper, molybdenum, gold and silver, and dividing the total Revenue by the price of copper. FY25 realised prices for copper (US$4.18/lb), molybdenum (US$21.12/lb), gold (US$2,877/oz) and silver (US$31.7/oz) have been used for H1 FY26, FY26e and FY27e.
[42] Payable zinc equivalent production (kt) was calculated by aggregating revenues from payable silver, lead and zinc, and dividing the total Revenue by the price of zinc. FY25 realised prices for zinc (US$2,648/t), lead (US$1,883/t) and silver (US$31.9/oz) have been used for H1 FY26, FY26e and FY27e.
[43]Operating unit cost is Underlying revenue less Underlying EBITDA, excluding third party products and services, divided by sales volumes. Operating cost is Underlying revenue less Underlying EBITDA excluding third party products and services. Additional manganese disclosures are included in footnotes 63 and 67 on pages 26 and 27.
[44]FY26e prior Operating unit cost guidance includes royalties (where appropriate), the influence of exchange rates, and includes various assumptions for FY26, including: an alumina price of US$350/t; a manganese ore price of US$4.40/dmtu for 44% manganese product; a nickel price of US$7.00/lb; a silver price of US$36.0/oz; a lead price of US$2,000/t (gross of treatment and refining charges); a zinc price of US$2,650/t (gross of treatment and refining charges); a copper price of US$4.40/lb (gross of treatment and refining charges); a molybdenum price of US$19.00/lb (gross of treatment and refining charges); a gold price of US$3,300/oz; an AUD:USD exchange rate of 0.66; a USD:ZAR exchange rate of 18.20; a USD:COP exchange rate of 4,250; USD:CLP exchange rate of 950; and a reference price for caustic soda; which reflect forward markets as at August 2025 or our internal expectations.
[45] FY26e new Operating unit cost guidance includes royalties (where appropriate), the influence of exchange rates, and includes various assumptions for FY26, including: an alumina price of US$340/t; a manganese ore price of US$4.40/dmtu for 44% manganese product; a silver price of US$47.0/oz; a lead price of US$2,000/t (gross of treatment and refining charges); a zinc price of US$2,980/t (gross of treatment and refining charges); a copper price of US$4.80/lb (gross of treatment and refining charges); a molybdenum price of US$22.00/lb (gross of treatment and refining charges); a gold price of US$3,900/oz; an AUD:USD exchange rate of 0.66; a USD:ZAR exchange rate of 17.50; a USD:COP exchange rate of 3,940; USD:CLP exchange rate of 950; and a reference price for caustic soda; which reflect forward markets as at February 2026 or our internal expectations.
[46] Hermosa growth capital expenditure guidance excludes expected lease payments of ~US$50M for self generated power assets directly attributable to construction of infrastructure at the Taylor deposit. These self generated power costs were included in our capital cost estimate provided in market release "Final Investment Approval to Develop Hermosa's Taylor Deposit" dated 15 February 2024.
[47] Guidance for Mozal Aluminium reflects the period ending March 2026.
[48] Reflects five months of ownership prior to the divestment of Cerro Matoso on 1 December 2025.
[49] H1 FY26 Underlying revenue on third party products and services sold from continuing operations comprises US$36M for aluminium, US$16M for manganese, US$44M for freight services and US$40M for raw materials. H1 FY26 Underlying EBIT on third party products and services sold from continuing operations comprises US$3M for aluminium, US$4M for alumina, US$(2)M for freight services and US$1M for raw materials. H1 FY25 Underlying revenue on third party products and services sold from continuing operations comprises US$87M for aluminium, US$6M for alumina, US$19M for manganese, US$26M for freight services and US$52M for raw materials. H1 FY25 Underlying EBIT on third party products and services sold from continuing operations comprises US$2M for aluminium, US$10M for alumina and US$(2)M for freight services.
[50] H1 FY25 underlying results for IMC include third party products and services. H1 FY25 Underlying revenue on third party products and services sold was US$28M and Underlying EBIT on third party products and services sold was nil.
[51] Refer to market release "Worsley Mine Development Project Receives Federal Approval" dated 12 February 2025.
[52] Subject to receipt of any necessary secondary approvals. The information in this announcement that refers to Production Target and forecast financial information for Worsley Alumina is based on Proved (87%) and Probable (13%) Ore Reserves. The Ore Reserves underpinning the Production Target have been prepared by G Burnham and reported in accordance with the requirements of the JORC Code and is available to view in South32's 2025 Annual Report (www.south32.net) published on 28 August 2025. South32 confirms that all material assumptions underpinning the Production Target and forecast financial information derived from the Production Target continue to apply and have not materially changed.
[53] Production guidance for Hillside Aluminium does not assume any load-shedding impact on production.
[54] Refers to substantially lower levels of GHG emissions when compared to the current state. Where used in relation to South32's products or portfolio, it refers to enhancement of existing methods, practices and technologies to substantially lower the level of embodied GHG emissions as compared to the current state.
[55] Refer to market release "Mozal Aluminium Update" dated 16 December 2025.
[56] Production guidance for Mozal Aluminium does not assume any load-shedding impact on production.
[57] Payable copper equivalent production (kt) was calculated by aggregating revenues from copper, molybdenum, gold and silver, and dividing the total Revenue by the price of copper. FY25 realised prices for copper (US$4.18/lb), molybdenum (US$21.12/lb), gold (US$2,877/oz) and silver (US$31.7/oz) have been used for H1 FY25, H1 FY26, FY26e and FY27e.
[58] Sierra Gorda Operating unit cost is Underlying revenue less Underlying EBITDA divided by ore processed. Periodic movements in finished product inventory may impact Operating unit costs.
[59] Payable zinc equivalent (kt) was calculated by aggregating revenues from payable zinc, lead and silver, and dividing the total Revenue by the price of zinc. FY25 realised prices for zinc (US$2,648/t), lead (US$1,883/t) and silver (US$31.9/oz) have been used for H1 FY25, H1 FY26, FY26e and FY27e.
[60] The information in this announcement that relates to Ore Reserve and/or Mineral Resource estimates for Cannington was declared as part of South32's "2026 Half Year Financial Results" presentation (www.south32.net) dated 12 February 2026 and prepared by Competent Persons in accordance with the requirements of the JORC Code. South32 confirms that it is not aware of any new information or data that materially affects the information included in the original market announcement. All material assumptions and technical parameters underpinning the estimates in the relevant market announcement continue to apply and have not materially changed. South32 confirms that the form and context in which the Competent Persons findings are presented have not been materially modified from the original market announcement.
[61] Cannington Operating unit cost is Underlying revenue less Underlying EBITDA divided by ore processed. Periodic movements in finished product inventory may impact Operating unit costs.
[62] Realised ore prices are calculated as external sales Underlying revenue less freight and marketing costs, divided by external sales volume.
[63] H1 FY26 average manganese content of external ore sales was 41.4% on a dry basis. 100% of H1 FY26 external manganese ore sales were completed on a CIF basis. H1 FY26 realised FOB ore prices and Operating unit costs have been adjusted for freight and marketing costs of US$32M, consistent with our FOB cost guidance. No ore sales in H1 FY25.
[64] FOB Ore Operating unit cost is Underlying revenue less Underlying EBITDA, freight and marketing costs, divided by ore sales volumes.
[65] Refer to media release "Completion of Metalloys Manganese Alloy Smelter Divestment" dated 3 June 2025.
[66] Realised ore prices are calculated as external sales Underlying revenue less freight and marketing costs, divided by external sales volume.
[67] H1 FY26 average manganese content of external ore sales was 38.3% on a dry basis (H1 FY25: 39.0%). 95% of H1 FY26 external manganese ore sales (H1 FY25: 89%) were completed on a CIF basis. H1 FY26 realised FOB ore prices and Operating unit costs have been adjusted for freight and marketing costs of US$28M (H1 FY25: US$30M), consistent with our FOB cost guidance.
[68] FOB Ore Operating unit cost is Underlying revenue less Underlying EBITDA, freight and marketing costs, divided by ore sales volumes.
Related Shares:
South32 Limited