24th Feb 2026 07:00
24 February 2026
BROOKS MACDONALD GROUP PLC
2026 Half-year results
"We have momentum and are well positioned for further growth."
Brooks Macdonald Group plc ("Brooks Macdonald" or the "Group") today announces results for the six months to 31 December 2025 ("H1 2026" or "H1").
Andrea Montague, CEO of Brooks Macdonald, commented:
"Today's results demonstrate we have good momentum across the business starting with positive net flows and better revenues. We've established Brooks Financial and completed the integration creating a scalable, whole of market financial planning capability. We've made deliberate investments in the business to drive sustainable growth and I'm confident our capability in investment management and distribution positions us for the future."
Financial highlights
· Total funds under management and advice1 ("FUMA") increased by 5% to £20.1 billion (30 June 2025: £19.1billion). Of this, funds under management1 ("FUM") were £17.8 billion and advised only assets were £2.3 billion.
· Net inflows of £2 million (H1 2025: net outflows £262 million), first half year of positive net flows since H2 2023.
· Revenue increased by 12% to £58.2 million, supported by higher financial planning and fee income, partly offset by lower interest and transactional income.
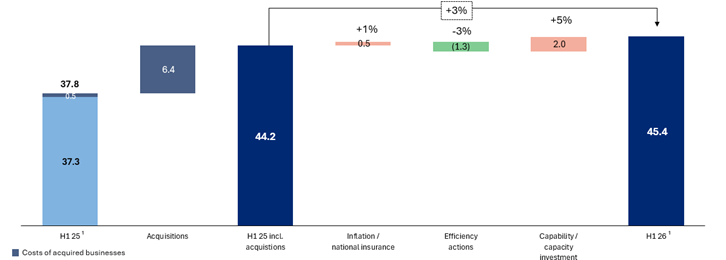
· Total underlying costs increased by 3% to £45.4 million, excluding acquisitions and net finance income2. Overall underlying costs, including acquisitions increased by 20%, compared to the prior period (H1 2025: £37.8 million).
· Underlying profit before tax ("PBT") of £13.6 million, representing a margin of 23.4%.
· Statutory PBT of £6.2 million (H1 2025: £12.6 million) reflects higher organic investment, M&A and integration costs.
· The Board has recommended an interim dividend of 31.0 pence per share, up 3%.
Strategic and operational highlights
· Executing our 'Reignite Growth' strategy, with good progress across all three strategic priorities.
· Deliberate investments in the business in areas such as digital capability, AI and product innovation to deliver excellent client service, broaden and deepen client reach, drive scale and efficiency and a return to positive net flows.
· Continued to enhance the client experience through digital developments including the launch of the Brooks Macdonald mobile app and improved onboarding of clients through digitisation.
· Advanced strategic initiatives across client service, distribution, product innovation, and efficiency, including nationwide adviser engagement.
· Deploying AI to reduce administrative burden which will free capacity to spend more time serving clients.
· Focus on efficiency delivered organisational restructuring savings equivalent to £3 million on an annualised basis.
· Delivered consistent year‑on‑year double‑digit growth in Managed Portfolio Service ("MPS") assets.
· Bespoke Portfolio Service ("BPS") assets growth of 4%, with c.50% reduction in net outflows, 8% increase in high‑net‑worth client numbers and an increase of 4% in advisers using more than one BPS service.
· Established Brooks Financial and completed the integration. Realised over £1 million in annualised cost synergies and established a scalable, whole of market financial planning business with 98% client retention.
· Strong investment performance delivered by our Centralised Investment Proposition is underpinning momentum in both BPS and MPS.
· Defaqto Gold award for Discretionary Fund Management Service for the fifth consecutive year.
Key financials
£ millions unless stated otherwise | H1 2026 | H1 2025 | Change |
Revenue | 58.2 | 51.9 | 12% |
Underlying operating expenses 2 | (45.4) | (37.8) | 20% |
Underlying PBT | 13.6 | 15.5 | (12)% |
Underlying operating profit margin | 23.4% | 29.9% | (6.5)ppts |
Statutory PBT | 6.2 | 12.6 | (51)% |
Underlying diluted earnings per share | 64.2p | 68.8p | (7)% |
Statutory diluted earnings per share from cont. operations | 29.4p | 56.2p | (48)% |
Interim dividend per share | 31.0p | 30.0p | 3% |
The table above includes alternative performance measures used by the Group. Further detail, including reconciliations to statutory measures, is presented in the Financial review section of this announcement.
Outlook and notice of third quarter 2026 FUMA update
We remain focused on delivering our 'Reignite Growth' strategy and expect to continue to invest organically in initiatives aligned to our strategic priorities, as well as reviewing potential financial planning M&A opportunities.
We expect H1 revenue trends to continue into H2 and for H2 costs, before the FSCS levy, to remain broadly in line with H1. We currently expect the full-year 2026 financial performance to be in line with market expectations and remain confident in delivering our medium-term targets of annualised net flows of +5% and BAU cost growth of <5%.
The Group will publish its third quarter 2026 FUMA update on 15 April 2026.
2026 half-year results presentation
A presentation to investors and financial analysts, including a recorded webcast will be published shortly on our website at: https://www.brooksmacdonald.com/fy-results
A Q&A session with Andrea Montague, CEO, and Katherine Jones, CFO, will be held at 9.00am GMT on 24 February 2026, via a live webcast, or by dialling in using the conference call details below. Registration for the Q&A is required and can be accessed via a link: https://brrmedia.news/BM_HYQ&A
Dial in numbers:
UK-wide: +44 (0) 33 0551 0200
UK toll free: +44 (0) 808 109 0700
Password (if prompted): Quote 'Brooks Macdonald'
Notes:
Numbers are subject to rounding.
1. On 8 December 2025, two TM Brunsdon funds, managed by Brooks Macdonald Asset Management Limited ("BMAM") on behalf of Brunsdon Financial, were merged with two IFSL Magnus funds, and BMAM ceased to act as their investment manager. The earlier periods have been amended accordingly to reflect the funds' liquidation. Prior to their liquidation, net outflows across both funds in the second quarter added to £0.1 million, which have also been excluded from the reported Funds net flows. Over the past four quarters, combined FUM across the two funds averaged £128 million, with combined average quarterly net outflows of £0.1 million.
2. Excludes net finance income of £0.8 million (H1 2025: £1.4 million).
Investor enquiries
Brooks Macdonald
Andrea Montague, CEO
Katherine Jones, CFO
Eva Hatfield, Director of Investor Relations +44 (0) 7418 923 061
Email: [email protected]
Media enquiries
Misha Bayliss +44 (0) 20 74275465
Oscar Burnett +44 (0) 20 74275435
Email: [email protected]
About Brooks Macdonald
Brooks Macdonald Group plc is a leading UK-focused wealth manager.
Proudly serving IFAs and clients since 1991, Brooks Macdonald is independent, financially strong, and aims to deliver strong and consistent investment performance for clients to meet their financial objectives. Brooks Macdonald provides innovative investment solutions to support IFAs and their clients throughout their entire lives as needs and circumstances change. The Group is recognised as an innovator in the industry having been one of the first to develop and launch key products such as Managed Portfolio Service.
Realising Ambitions. Securing Futures. We are Brooks Macdonald.
Forward-looking statements
This announcement may include statements, beliefs or opinions that are, or may be deemed to be, "forward-looking statements". These forward-looking statements may be identified by the use of forward-looking terminology, including the terms "believes", "estimates", "plans", "projects", "anticipates", "targets", "aims", "continues", "expects", "intends", "hopes", "may", "will", "would", "could" or "should" or, in each case, their negative or other variations or comparable terminology, or by discussions of strategy, plans, objectives, goals, future events or intentions. No representation or warranty is made that any of these statements or forecasts will come to pass or that any forecast results will be achieved. Forward-looking statements may and often do differ materially from actual results. Any forward-looking statements contained in the announcement speak only as of their respective dates, reflect Brooks Macdonald's current view with respect to future events and are subject to risks relating to future events and other risks, uncertainties and assumptions relating to Brooks Macdonald's business, results of operations, financial position, liquidity, prospects, growth and strategies.
Except as required by any applicable law or regulation, Brooks Macdonald expressly disclaims any obligation or undertaking to release publicly any updates or revisions to any forward-looking statements contained in this announcement or any other forward-looking statements it may make whether as a result of new information, future developments or otherwise.
Financial review
Basis of presentation
The consolidated financial results for the six months ended 31 December 2025 include financial results of the three financial planning businesses acquired in FY25.
The prior period includes discontinued operations relating to the activities and operations of the Defensive Capital Fund and Brooks Macdonald International, which were sold in November 2024 and February 2025, respectively. It also reflects the financial results of the recent acquisitions, from their respective acquisition dates.
Financial results summary
The table below shows our financial performance for six months ended 31 December 2025 and 2024, unless otherwise stated, and includes alternative performance measures used by the Group.
£ billion | 31 Dec 25 | 30 Jun 25 |
Total FUMA1 | 20.1 | 19.1 |
Total FUM1 | 17.8 | 16.5 |
| ||
£ million | H1 2026 | H1 2025 |
Net flows | 2 | (262) |
| ||
Fee income | 37.8 | 37.1 |
Financial planning income | 13.6 | 5.1 |
Transactional and FX income | 3.9 | 5.9 |
Interest income | 2.9 | 3.8 |
Total revenue | 58.2 | 51.9 |
Fixed staff costs | (23.8) | (18.1) |
Variable staff costs | (5.0) | (5.0) |
Total staff costs | (28.8) | (23.1) |
Non-staff costs | (16.6) | (14.7) |
Total underlying costs | (45.4) | (37.8) |
Net finance income | 0.8 | 1.4 |
Underlying profit before tax | 13.6 | 15.5 |
Underlying adjustments | (7.4) | (2.9) |
Statutory profit before tax | 6.2 | 12.6 |
Taxation | (1.5) | (2.4) |
Statutory profit after tax | 4.7 | 10.2 |
Result from discontinued operations | - | (0.6) |
Total comprehensive income for the period | 4.7 | 9.6 |
1. Prior period FUM has been restated to reflect the liquidation of two third-party funds in December 2025. See note 1 to the Financial highlights above for further detail.
Movements in FUMA, by service
£ million (unless stated otherwise) | Opening assets 1 Jul 25 | Gross inflows | Gross outflows | Net flows | Market and investment performance | Closing assets 31 Dec 2025 | Annualised net flows growth | FUM growth |
BPS | 8,528 | 490 | (701) | (211) | 572 | 8,889 | (4.9)% | 4.2% |
MPS Custody | 906 | 16 | (89) | (73) | 72 | 905 | (16.1)% | (0.1)% |
MPS Platform | 5,983 | 1,086 | (724) | 362 | 563 | 6,908 | 12.1% | 15.5% |
Total MPS | 6,889 | 1,102 | (813) | 289 | 635 | 7,813 | 8.4% | 13.4% |
Funds1 | 1,084 | 58 | (134) | (76) | 77 | 1,085 | (14.0)% | 0.1% |
Total FUM1 | 16,501 | 1,650 | (1,648) | 2 | 1,284 | 17,786 | 0.0% | 7.8% |
Advised only assets | 2,577 | 2,320 | ||||||
Total FUMA | 19,078 | 20,106 | 5.4% |
1. Prior period Funds and Total FUM have been restated to reflect the liquidation of two third-party funds in December 2025. See note 1 to the Financial Highlights above for further detail. Numbers subject to rounding.
Total FUMA increased 5% to £20.1 billion (30 June 2025: £19.1 billion), driven by strong market and investment performance. Closing FUMA comprised total FUM of £17.8 billion (30 June 2025: £16.5 billion) and advised only assets of £2.3 billion (30 June 2025: £2.6 billion).
Growth in FUM was driven by £1.3 billion of market and investment performance. Total net inflows of £2 million were much improved compared to the prior period (H1 2025: outflows £262 million), with a sequential improvement over four half-year periods.
Overall, BPS FUM Increased by 4% to £8.9 billion (30 June 2025: £8.5 billion), supported by strong market and investment performance of £572 million. Net outflows across our BPS offering of £211 million reduced by 48% (H1 2025: outflows £408 million), driven by higher gross inflows across BPS Core.
Total MPS FUM increased by 13% to £7.8 billion (30 June 2025: £6.9 billion), driven by strong market and investment performance of £635 million and continued strong net inflows across our Platform MPS of £362 million (H1 2025: inflows £288 million), partially offset by outflows across our MPS Custody book of £73 million (H1 2025: outflows £53 million).
Advised only assets were £2.3 billion (30 June 2025: £2.6 billion), contributing to total advised assets of £5.3 billion (30 June 2025: £5.3 billion). Over time, in line with our strategy and subject to client suitability, a greater proportion of these advised only assets may become managed and advised.
Revenue
Total revenue increased by 12% to £58.2 million (H1 2025: £51.9 million). Growth was driven by higher financial planning income of £13.6 million (H1 2025: £5.1 million) supported by recent acquisitions, and higher fee income of £37.8 million (H1 2025: £37.1 million), due to higher average FUMA. This was partially offset by lower transactional and FX income, of £3.9 million (H1 2025: £5.9 million), and lower interest income of £2.9 million (H1 2025: £3.8 million).
The reduction in transactional and FX income principally reflects lower trading volumes compared to H1 2025, whilst the reduced interest income largely reflects lower prevailing interest rates over the period.
Revenue, average FUM and yields
Revenue | Average FUM | Yields | |||||||
H1 2026 £m | H1 2025 £m | Change % | H1 2026 £m | H1 2025 £m | Change % | H1 2026 bps | H1 2025 bps | Change bps | |
BPS fees | 26.1 | 26.6 | (2.1) | 8,559 | 8,546 | 0.2 | 60.4 | 61.8 | (1.4) |
BPS transactional and FX income | 3.9 | 5.9 | (33.4) | 9.1 | 13.6 | (4.5) | |||
Total BPS | 30.0 | 32.5 | (7.7) | 8,559 | 8,546 | 0.2 | 69.5 | 75.4 | (5.9) |
MPS Custody | 2.7 | 2.8 | (5.0) | 908 | 952 | (4.6) | 58.4 | 58.6 | (0.2) |
MPS Platform | 5.5 | 4.0 | 38.7 | 6,483 | 4,578 | 41.6 | 17.2 | 17.5 | (0.3) |
Total MPS | 8.2 | 6.8 | 21.8 | 7,391 | 5,530 | 33.7 | 22.1 | 24.4 | (2.3) |
Funds | 3.1 | 3.3 | (5.6) | 1,415 | 1,467 | (3.5) | 43.8 | 44.9 | (1.1) |
Total (excluding interest income) | 41.3 | 42.6 | (2.9) | 17,365 | 15,543 | 11.7 | 47.2 | 54.4 | (7.2) |
Interest income - BPS | 2.7 | 3.4 | (21.8) |
|
|
| 6.2 | 8.0 | (1.8) |
Interest income - MPS Custody | 0.2 | 0.4 | (50.0) |
|
|
| 6.2 | 8.0 | (1.8) |
Total FUM-related revenue | 44.2 | 46.4 | (4.6) | 17,365 | 15,543 | 11.7 | 50.6 | 59.2 | (8.6) |
Financial planning | 13.6 | 5.1 | 165 |
|
|
| 50.8 | 39.2 | 11.6 |
Other income | 0.4 | 0.4 | - | ||||||
Total non-FUM-related revenue | 14.0 | 5.5 | 156 |
|
|
| |||
Total revenue | 58.2 | 51.9 | 12.3 |
| |||||
The Group's FUM related yield decreased by 8.6bps to 50.6bps (H1 2025: 59.2bps), due to a number of factors across the products as noted below.
Whilst the yield on BPS fees reduced marginally to 60.4bps (H1 2025: 61.8bps), the total BPS yield decreased by 5.9bps to 69.5bps (H1 2025: 75.4bps), largely due to lower transactional income as a result of the lower overall trading and portfolio rebalancing in the period.
The yield on total MPS decreased by 2.3bps to 22.1bps (H1 2025: 24.4bps). This is primarily due to strong growth across the lower yield Platform MPS assets, including assets acquired in H2 2025, with average Platform MPS FUM up 42% compared to the prior period.
The yield on interest income, net of amounts paid to clients, decreased by 1.8bps to 6.2bps (H1 2025: 8.0bps). This principally reflects lower average interest rates over the period, in line with reductions in the Bank of England ("BoE") base rate.
The yield on financial planning income increased 11.6bps to 50.8bps (H1 2025: 39.2bps). This primarily reflects the higher yield across the recent acquisitions.
Underlying costs
Underlying costs increased 3% to £45.4 million, excluding the costs acquired with the financial planning businesses of £6.4 million (H1 2025: £0.5 million) and the net finance income of £0.8 million (H1 2025: £1.4 million). This reflects the impact of inflationary and National Insurance ("NI") increases of £0.5 million (+1%), and the impact of investment in capability and capacity to support business growth, of £2.0 million (+5%).
This was partly offset by efficiency actions totalling £1.3 million (-3%), which included integration synergies of £0.6 million, non-staff costs savings of £0.2 million and restructuring cost savings of £0.5 million.
On an annualised basis, the restructuring savings are equivalent to £3 million. Overall underlying costs, including acquisitions, increased by 20% vs the prior period (H1 2025: £37.8 million).
Underlying cost analysis (£m)
1. Excludes net finance income of £0.8 million (H1 2025: £1.4 million).
Staff costs
Excluding acquisitions, staff costs increased by 1% to £28.8 million, with the impact of higher NI rates, inflationary increases, and senior hires, largely offset by efficiency actions. Total staff costs, including acquisitions, increased by 25% compared to the prior period (H1 2025: £23.1 million).
Non-staff costs
Excluding acquisitions, non-staff costs increased by 8% to £16.6 million, driven by higher spend on client engagement and brand awareness in line with our strategy, as well as higher depreciation and amortisation charges. Including acquisitions, total non-staff costs increased by 14% compared to the prior period (H1 2025: £14.7 million).
Profit before tax
Reflecting the revenue and cost dynamics described above, underlying profit before tax ("PBT") decreased by 12% to £13.6 million (H1 2025: £15.5 million), and the underlying profit margin was 23.4% (H1 2025: 29.9%).
On a statutory basis, the PBT was £6.2 million (H1 2025: £12.6 million). This was driven by the same dynamics as underlying PBT, as well as higher non-recurring one off items including acquisition and integration costs and organisational restructuring costs.
Reconciliation between underlying and statutory PBT
Underlying PBT is considered by the Board to be an appropriate reflection of the Group's performance when compared to the statutory results as this excludes income and expense categories, which are deemed to be of a non-recurring nature or non-operating items. The Non-IFRS financial information section includes a glossary of the Group's APMs and the criteria for how each are considered. A reconciliation between underlying and statutory PBT for H1 2026, with comparative financial information is presented in the below table.
£ million | H1 2026 | H1 2025 |
Underlying profit before tax | 13.6 | 15.5 |
Acquisition and integration related costs | (1.2) | (2.5) |
Amortisation of acquired client relationships | (2.4) | (1.7) |
Strategic transformation and restructuring | (6. 8) | (1.1) |
Other non-operating items | 3.0 | 2.4 |
Total underlying adjustments | (7.4) | (2.9) |
Statutory profit before tax | 6.2 | 12.6 |
Acquisition and integration related costs (£1.2 million charge)
These represent costs incurred in relation to the Group's recent acquisitions, and include legal fees, fair value adjustments and finance costs in relation to the deferred contingent consideration and integration costs. The H1 2026 charge includes the share-based payment for share options awarded to onboarded employees as part of the integration of prior period acquisitions.
Amortisation of acquired client relationships (£2.4 million charge)
Intangible assets are recognised on the acquisition of new businesses and in the course of acquiring FUM and financial advice portfolios. These are amortised over their useful life, which has been assessed to range between six and 20 years.
Strategic transformation and restructuring (£6.8 million charge)
This primarily relates to significant one-off initiatives and organisational changes intended to reshape the business and enhance future operational efficiency. Of this, £2.8 million relates to organisational restructuring, primarily redundancy costs incurred to streamline operations and eliminating duplication across core processes. The remainder relates to reviewing our products and propositions to meet client needs and investing in digital capabilities including AI.
Other non-operating items (£3.0 million credit)
The other non-operating income in H1 2026 primarily includes insurance proceeds relating to the settlement of legacy matters of £4.7 million, partly offset by head office dual running costs of £1.2 million, relating to the Group's head office relocation. The prior period credit comprised a refund from HMRC, partly offset by the costs associated with the move to the Main Market of the London Stock Exchange.
Taxation
The underlying tax charge decreased to £3.3 million (H1 2025: £4.2 million), representing an effective tax rate ("ETR") of 24.1% (H1 2025: 27.3%). The difference compared to the corporate tax rate of 25.0% was largely due to non-taxable income arising from the reversal of accruals that had previously been treated as non-deductible for tax purposes.
The statutory tax charge was £1.5 million (H1 2025: £3.4 million), representing an ETR of 23.7% (H1 2025: 27.0%). The higher ETR in the prior period was driven by acquisition and disposal activity that gave rise to non-deductible expenses and an adjustment to depreciation, which didn't recur in H1 2026. Refer to note 5 of the condensed consolidated financial statements for further information.
Earnings per share ("EPS")
Underlying diluted EPS from continuing operations decreased by 7% to 64.2p (H1 2025: 68.8p), reflecting the reduction in the underlying PBT, partly offset by lower underlying tax charge and lower weighted average share count following the share buyback. Statutory diluted EPS from continuing operations decreased by 48% to 29.4p (H1 2025: 56.2p), in line with the reduction in statutory profit. Diluted weighted average number of shares in issue reduced to 16.1 million (H1 2025: 16.4 million), following the recent share buyback. Details on the basic and diluted EPS are provided in note 6 of the condensed consolidated financial statements.
Pence (unless stated otherwise) | H1 2026 | H1 2025 |
EPS from continuing operations |
| |
Basic | 30.3 | 56.9 |
Diluted | 29.4 | 56.2 |
EPS from discontinued operations |
| |
Basic | - | 2.3 |
Diluted | - | 2.3 |
Underlying EPS from continuing operations |
| |
Basic | 66.1 | 69.6 |
Diluted | 64.2 | 68.8 |
Weighted average number of shares in issue | 15,637,396 | 16,210,734 |
Effect of dilutive share options | 480,643 | 186,225 |
Diluted weighted average number of shares in issue | 16,118,039 | 16,396,959 |
Financial position, capital, cash and dividend
£ million (unless stated otherwise) | 31 Dec 25 | 30 Jun 25 |
Net assets | 149.2 | 154.4 |
Excess capital after internal capital buffer1 | 12.0 | 15.6 |
Cash resources and liquid assets | 27.0 | 53.8 |
Interim dividend | 31.0p | 30.0p |
1. Excess capital after internal capital buffer is stated before payment of the interim dividend.
Net assets and capital
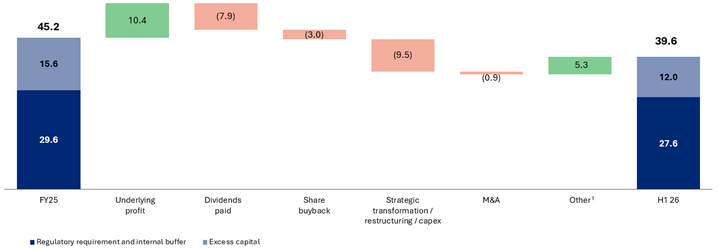
Net assets decreased by 3% to £149.2 million at 31 December 2025 (30 June 2025: £154.4 million). Total tangible net assets (net assets excluding intangibles) were £29.6 million at 31 December 2025 (30 June 2025: £35.0 million). As at 31 December 2025, the Group had regulatory capital resources of £39.6 million (30 June 2025: £45.2 million) excluding the impact of the interim dividend payment of c.£4.9 million payable in April 2026.
The reduction in capital resources was predominantly driven by payment of final dividend for financial year 2025 of £7.9 million, the repurchase of shares through the share buyback programme of £3.0 million, and investment in strategic transformation, restructuring and capital expenditure of £9.5 million to drive growth and efficiencies. This was partially offset by £5.3 million of other items, largely relating to insurance proceeds from legacy matters.
The total net assets and the regulatory capital resources consider the respective period's profits as these are deemed to be verified at the date of publication of the interim results. In applying its internal capital management approach, the Group seeks to maintain a capital buffer in addition to the regulatory minimum requirement. At 31 December 2025, after taking into account the regulatory minimum requirement and internal capital buffer, the excess capital was £12.0 million (30 June 2025: £15.6 million), excluding the impact of the interim dividend payment.
Capital position (£m)
1. Other includes insurance recoveries from litigation relating to legacy matters of £4.7 million and increase in share-based payment reserve of £2.2 million, partly offset by purchase of shares by the Employee Benefit Trust ("EBT") of £1.2 million, and head office dual running costs of £1.2 million, and other items.
Liquidity
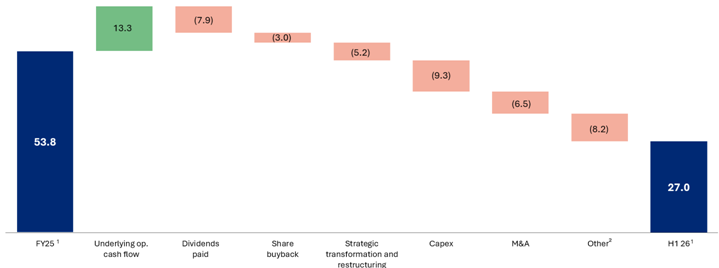
Total cash resources and liquid assets at 31 December 2025 were £27.0 million (30 June 2025: £53.8 million). The reduction in the period includes the final dividend payment of £7.9 million and the remainder of the share buyback of £3.0 million, £5.2 million of strategic transformation and restructuring costs, capital expenditure of £9.3 million, and earn-out payments and integration costs relating to recent acquisitions of £6.5 million.
Strategic transformation and restructuring costs include organisational restructuring to deliver cost savings, the costs of reviewing our products and propositions to meet client needs and investment in digital capabilities including AI. Capital expenditure includes property fit-out costs, driven by the Group's head office relocation in November 2025, and improvements to front office workflow processes and back-office systems to enhance efficiency and automation.
Investment is expected to continue in H2 aligned to our strategic priorities. Given the completion of the office move in H1, the overall investment in H2 is expected to be at a lower level compared to H1.
Cash position (£m)
1. Group liquid assets are inclusive of UK government gilts and money market funds which are classified as a liquid resource in nature due to their ability to be easily translated into cash.
2. Other includes insurance recoveries from litigation relating to legacy matters of £4.7 million, offset by purchase of shares by the EBT of £1.2 million, head office dual-running costs of £0.9 million, and timing differences of cash payments of £4.8 million for variable pay and £6.0 million for movements in payables, and other items.
Dividend
The Board recognises the importance of dividends to shareholders and the benefit of providing sustainable shareholder returns. In line with our progressive dividend policy, the Board declared interim dividend of 31.0 pence per share (H1 2025: 30.0 pence), up 3%. The interim dividend will be paid on 10 April 2026 to shareholders on the register as at 13 March 2026.
Share buyback
In January 2025, the Group initiated a share buyback programme of up to £10.0 million, consistent with its capital allocation priorities. The share buyback programme concluded in October 2025, with 643,330 shares acquired for a total consideration of £10 million. Of this total, 105,330 shares were acquired in the six months to 31 December 2025, for a total consideration of £3.0 million. All acquired shares have been cancelled.
Condensed consolidated statement of comprehensive income for the six months ended 31 December 2025
Note | Six months ended 31 Dec 2025 (unaudited) |
Six months ended 31 Dec 2024 (unaudited) | Year ended 30 Jun 2025 (audited) | |||
£'000 | £'000 | £'000 | ||||
Revenue | 4 | 58,226 | 51,864 | 111,560 | ||
Administrative costs | (57,047) | (43,385) | (99,282) | |||
Gross profit | 1,179 | 8,479 | 12,278 | |||
Other gains/(losses) - net | 129 | 17 | (272) | |||
Operating profit | 1,308 | 8,496 | 12,006 | |||
Finance income |
| 1,132 | 1,494 | 2,827 | ||
Finance costs |
| (897) | (107) | (597) | ||
Other non-operating income |
| 4,661 | 2,741 | 3,283 | ||
Profit before tax |
| 6,204 | 12,624 | 17,519 | ||
Taxation | 5 | (1,470) | (3,405) | (5,889) | ||
Profit for the period attributable to equity holders of the Company |
| 4,734 | 9,219 | 11,630 | ||
Profit from discontinued operations |
| - | 378 | 9,354 | ||
Other comprehensive income |
| - | - | - | ||
Total comprehensive income for the period attributable to equity holders of the Company |
| 4,734 | 9,597 | 20,984 | ||
Earnings per share from continuing operations | ||||||
Basic | 6 | 30.3p | 56.9p | 72.0p | ||
Diluted | 6 | 29.4p | 56.2p | 71.4p | ||
| ||||||
Earnings per share from discontinued operations |
| |||||
Basic | 6 | - | 2.3p | 57.9p | ||
Diluted | 6 | - | 2.3p | 57.4p | ||
The above condensed consolidated statement of comprehensive income should be read in conjunction with the accompanying notes.
Condensed consolidated statement of financial position as at 31 December 2025
|
|
| |||||
Note | 31 Dec 2025 (unaudited) £'000 | Restated 31 Dec 2024 (unaudited)1 £'000 | 30 Jun 2025 (audited) £'000 | ||||
Assets | |||||||
Non-current assets | |||||||
Intangible assets | 8 | 119,574 | 77,248 | 119,465 | |||
Property, plant and equipment | 9 | 6,711 | 937 | 3,418 | |||
Right-of-use assets | 10 | 11,554 | 2,621 | 12,790 | |||
Financial assets at amortised cost | 13 | 14,963 | 30,019 | 19,925 | |||
Deferred contingent consideration receivable | 14 | 14,499 | 661 | 13,899 | |||
Total non-current assets | 167,301 | 111,486 | 169,497 | ||||
Current assets | |||||||
Financial assets at fair value through profit or loss | 13 | 1,216 | 938 | 1,095 | |||
Deferred contingent consideration receivable | 14 | 80 | - | 289 | |||
Trade and other receivables | 25,851 | 25,625 | 25,881 | ||||
Cash and cash equivalents | 12,073 | 29,475 | 33,915 | ||||
Net assets held for sale | - | 28,012 | - | ||||
Total current assets | 39,220 | 84,050 | 61,180 | ||||
Total assets | 206,521 | 195,536 | 230,677 | ||||
Liabilities | |||||||
Non-current liabilities | |||||||
Lease liabilities | 11 | 13,531 | 1,113 | 14,218 | |||
Provisions | 12 | 181 | 403 | 773 | |||
Deferred contingent consideration payable | 15 | - | 1,714 | 1,929 | |||
Net deferred tax liabilities | 8,601 | 5,614 | 9,163 | ||||
Other non-current liabilities | 882 | 228 | 1,044 | ||||
Total non-current liabilities |
| 23,195 | 9,072 | 27,127 | |||
Current liabilities | |||||||
Lease liabilities | 11 | 748 | 1,916 | 700 | |||
Provisions | 12 | 1,072 | 953 | 1,890 | |||
Deferred contingent consideration payable | 15 | 11,328 | 4,472 | 14,176 | |||
Trade and other payables | 20,212 | 20,504 | 31,294 | ||||
Current tax liabilities | 757 | 1,980 | 1,041 | ||||
Total current liabilities |
| 34,117 | 29,825 | 49,101 | |||
Net assets |
| 149,209 | 156,639 | 154,449 | |||
Equity | |||||||
Share capital | 17 | 159 | 165 | 160 | |||
Share premium | 17 | 83,987 | 83,915 | 83,987 | |||
Other reserves | 198 | 192 | 197 | ||||
Retained earnings | 64,865 | 72,367 | 70,105 | ||||
Total equity | 149,209 | 156,639 | 154,449 | ||||
1 Restated to reclassify the share-based payment reserve from other reserves to retained earnings (refer to note 2(b)).
The above condensed consolidated statement of financial position should be read in conjunction with the accompanying notes.
The condensed consolidated financial statements were approved by the Board of Directors and authorised for issue on 23 February 2026, signed on their behalf by:
Andrea Montague Katherine Jones
CEO CFO
Company registration number: 4402058
Condensed consolidated statement of changes in equity for the six months ended 31 December 2025
Note | Share capital £'000 | Share premium £'000 | Other reserves1 £'000 | Retained earnings1 £'000 | Total £'000 | |
Balance at 1 July 2024 | 165 | 83,135 | 192 | 68,843 | 152,335 | |
Comprehensive income | ||||||
Profit for the period from continuing operations | - | - | - | 9,219 | 9,219 | |
Profit from discontinued operations | - | - | - | 378 | 378 | |
Total comprehensive income | - | - | - | 9,597 | 9,597 | |
Transactions with owners | ||||||
Issue of ordinary shares | 17 | - | 780 | - | - | 780 |
Share-based payments | 18 | - | - | - | 2,088 | 2,088 |
Purchase of own shares by Employee Benefit Trust | - | - | - | (750) | (750) | |
Tax on share options | - | - | - | 461 | 461 | |
Dividends paid | 7 | - | - | - | (7,872) | (7,872) |
Total transactions with owners | - | 780 | - | (6,073) | (5,293) | |
Balance at 31 December 2024 | 165 | 83,915 | 192 | 72,367 | 156,639 | |
Comprehensive income | ||||||
Profit for the period from continuing operations | - | - | - | 2,411 | 2,411 | |
Profit from discontinued operations | - | - | - | 8,976 | 8,976 | |
Total comprehensive income | - | - | - | 11,387 | 11,387 | |
Transactions with owners | ||||||
Issue of ordinary shares | 17 | - | 72 | - | - | 72 |
Share-based payments | 18 | - | - | - | 768 | 768 |
Purchase of own shares by Employee Benefit Trust | - | - | - | (1,816) | (1,816) | |
Shares repurchased in share buyback programme | 17 | (5) | - | 5 | (6,971) | (6,971) |
Tax on share options | - | - | - | (807) | (807) | |
Dividends paid | 7 | - | - | - | (4,823) | (4,823) |
Total transactions with owners | (5) | 72 | 5 | (13,649) | (13,577) | |
Balance at 30 June 2025 | 160 | 83,987 | 197 | 70,105 | 154,449 | |
Comprehensive income | ||||||
Profit for the period from continuing operations | - | - | - | 4,734 | 4,734 | |
Total comprehensive income | - | - | - | 4,734 | 4,734 | |
|
|
|
|
| ||
Transactions with owners |
|
|
|
|
| |
Share-based payments | 18 | - | - | - | 2,177 | 2,177 |
Purchase of own shares by Employee Benefit Trust | - | - | - | (1,200) | (1,200) | |
Shares repurchased in share buyback programme | 17 | (1) | - | 1 | (3,030) | (3,030) |
Tax on share options | - | - | - | (17) | (17) | |
Dividends paid | 7 | - | - | - | (7,904) | (7,904) |
Total transactions with owners | (1) | - | 1 | (9,974) | (9,974) | |
Balance at 31 December 2025 | 159 | 83,987 | 198 | 64,865 | 149,209 |
1 Restated to reclassify the share-based payment reserve from other reserves to retained earnings (refer to note 2(b)).
The above condensed consolidated statement of changes in equity should be read in conjunction with the accompanying notes.
Condensed consolidated statement of cash flows for the six months ended 31 December 2025
Note | Six months ended 31 Dec 2025 (unaudited) | Restated Six months ended 31 Dec 2024 (unaudited)1 | Year ended 30 Jun 2025 (audited) | |
£'000 | £'000 | £'000 | ||
Cash flow from operating activities | ||||
Cash (used in)/generated from operations | 16 | (2,665) | 11,764 | 28,727 |
Corporation tax paid | (2,557) | (3,185) | (7,064) | |
Other non-operating income | 4,661 | 2,741 | 3,073 | |
Net cash (used in)/generated from operating activities | (561) | 11,320 | 24,736 | |
Cash flows from investing activities | ||||
Purchase of computer software | (4,291) | (3,359) | (7,491) | |
Purchase of property, plant and equipment | (5,021) | (119) | (1,852) | |
Consideration paid for acquisitions net of cash acquired | (5,217) | (6,204) | (34,150) | |
Proceeds from disposal of discontinued operations | - | 523 | 27,670 | |
Disposal of financial assets at amortised cost | 5,000 | - | 9,984 | |
Investment in financial assets at fair value through profit or loss | (30) | (16) | (146) | |
Disposal of financial assets at fair value through other comprehensive income | - | 500 | 500 | |
Interest received | 730 | 586 | 1,232 | |
Net cash used in investing activities | (8,829) | (8,089) | (4,253) | |
Cash flows from financing activities | ||||
Proceeds of issue of shares | 17 | - | 74 | 146 |
Purchase of shares in the share buyback programme | (2,237) | - | (6,971) | |
Payment of lease liabilities - principal | (1,073) | (1,021) | (2,678) | |
Payment of lease liabilities - interest | (38) | (58) | (287) | |
Purchase of own shares by Employee Benefit Trust | (1,200) | (750) | (2,566) | |
Dividends paid to shareholders | 7 | (7,904) | (7,872) | (12,695) |
Net cash used in financing activities | (12,452) | (9,627) | (25,051) | |
Net decrease in cash and cash equivalents from continuing operations | (21,842) | (6,396) | (4,568) | |
Cash and cash equivalents at beginning of period | 33,915 | 35,871 | 44,732 | |
Cash flow from discontinued operations | - | - | (6,249) | |
Cash and cash equivalents at end of period | 12,073 | 29,475 | 33,915 |
1 The prior period has been restated to show the results of continuing operations only, consistent with the presentation in the current financial period.
The above condensed consolidated statement of cash flows should be read in conjunction with the accompanying notes.
Notes to the condensed consolidated financial statements for the six months ended 31 December 2025
1. General information
Brooks Macdonald Group plc ("the Company"), a public limited company incorporated and registered in England and Wales and domiciled in the United Kingdom ("UK") under the Companies Act 2006, is the Parent Company of a group of companies (collectively "the Group") and offers wealth management and financial planning services in the UK. The Company is listed on the London Stock Exchange ("LSE").
The Company's registration number is 04402058. The address of the registered office is 40 Leadenhall Street, London, EC3A 2BJ, England.
2. Accounting policies
a) Basis of preparation
The Group's condensed consolidated financial statements have been prepared in accordance with UK-adopted International Accounting Standards ("IAS") 34, 'Interim Financial Reporting' and the Disclosure Guidance and Transparency Rules sourcebook of the United Kingdom's Financial Conduct Authority ("FCA"). The condensed consolidated financial statements have been prepared on the historical cost basis, except for the revaluation of financial assets and financial liabilities at fair value through profit or loss such that they are measured at their fair value.
At the time of approving the condensed consolidated financial statements, the Directors have a reasonable expectation that the Company and the Group have adequate resources to continue in operational existence for the foreseeable future. Accordingly, they continue to adopt the going concern basis in preparing the condensed consolidated financial statements.
The information in this Interim Report and Accounts does not comprise statutory financial statements within the meaning of section 434 of the Companies Act 2006. The Group's financial statements for the year ended 30 June 2025 have been reported on by its auditors and delivered to the Registrar of Companies. The condensed consolidated financial statements should be read in conjunction with the Group's audited financial statements for the year ended 30 June 2025, which are prepared in accordance with UK-adopted International Accounting Standards.
Developments in reporting standards and interpretations
Standards and interpretations adopted during the current reporting period
In the six months ended 31 December 2025, the Group did not adopt any new standards or amendments issued by the International Accounting Standards Board ("IASB") or interpretations by the IFRS Interpretations Committee ("IFRS IC") that have had a material impact on the condensed consolidated financial statements.
Future new standards and interpretations
New standards, amendments and interpretations listed below were newly adopted by the Group but have not had a material impact on the amounts reported in these financial statements. They may, however, impact the accounting for future transactions and arrangements.
• Amendments to IAS 21 - Lack of exchangeability (effective 1 January 2025)
IFRS 18 Presentation and Disclosure in Financial Statements was issued in April 2024 and replaces IAS 1. The new standard introduces revised presentation requirements for the primary financial statements, including new defined categories in the statement of comprehensive income, mandatory subtotals and enhanced aggregation and disaggregation requirements. IFRS 18 is effective for annual reporting periods beginning on or after 1 January 2027 and the Group is currently evaluating the impact of these changes. Although IFRS 18 is not expected to have a material impact on the Group's net assets or reported profit, it will result in changes to presentation and disclosure throughout the primary statements when adopted.
A number of new amendments are effective for annual periods beginning after 1 January 2026 and earlier application is permitted; however, the Group has not early adopted the new amendments in preparing these condensed consolidated financial statements. None of the standards and amendments not yet effective are expected to have a material impact on the Group's Financial statements.
b) Changes in accounting policies
The accounting policies applied in these condensed consolidated financial statements are the same as those applied in the Group's consolidated financial statements as at and for the year ended 30 June 2025.
During the year ended 30 June 2025, the Group revised its accounting policy for the presentation of equity entries arising from share-based payment transactions. Previously, the credit entry for share-based payment charges was recognised in the share-based payment reserve. Under the revised policy, this credit is now recognised directly in retained earnings. The change was made to better reflect the nature of the expense as part of the Group's accumulated profits and losses and to align with common industry practice. The change in policy has been applied retrospectively in accordance with IAS 8 Accounting Policies, Changes in Accounting Estimates and Errors. Accordingly, comparative figures for the six-month period ended 31 December 2024 have been restated in these condensed consolidated financial statements.
c) Critical estimates and significant judgements
The Group has reviewed the judgements and estimates that affect its accounting policies and amounts reported in its condensed consolidated financial statements. With the exception of the changes to cash generating units for goodwill impairment testing discussed in note 8, these judgements and estimates remain unchanged from those reported in the Group's financial statements for the year ended 30 June 2025.
3. Segmental information
During the previous financial year, the Group sold its International business ("BMI") which was removed as a reportable operating segment and instead reported within discontinued operations.
The Group has determined that it has a single reportable operating segment in accordance with IFRS 8 Operating Segments. This conclusion reflects the way in which financial information is reported internally to, and reviewed by, the Board of Directors in its capacity as the Group's chief operating decision maker ("CODM") for the purposes of allocating resources and assessing performance. As the Group operates as one reportable segment and the CODM is provided with financial information at this consolidated level, no additional segmental disclosures are required under IFRS 8.
The required disclosures per IFRS 8 regarding revenues from external customers for each product and service and geographical location are disclosed in note 4.
4. Revenue
Six months ended 31 Dec 2025 (unaudited) | Six months ended 31 Dec 2024 (unaudited) | Year ended 30 Jun 2025 (audited) | |
£'000 | £'000 | £'000 | |
Investment management fees | 35,024 | 33,677 | 66,237 |
Fund management fees | 2,728 | 3,359 | 6,598 |
Financial planning income | 13,589 | 5,131 | 17,102 |
Transactional income | 3,906 | 5,867 | 14,022 |
Interest income | 2,979 | 3,830 | 7,601 |
Total revenue | 58,226 | 51,864 | 111,560 |
a) Geographic analysis
The Group's continuing operations are located in the United Kingdom and therefore all Group revenue is recognised in this jurisdiction. The Group's discontinued operations in the prior period in relation to BMI were located in Jersey and Guernsey.
b) Major clients
The Group is not reliant on any one client or group of connected clients for the generation of revenues.
5. Taxation
The current tax expense for the six months ended 31 December 2025 was calculated based on the corporation tax rate of 25.0%, applied to the taxable profit for the six months ended 31 December 2025 (six months ended 31 December 2024: 25.0%; year ended 30 June 2025: 25.0%). Deferred tax assets and liabilities are calculated at the rate that is expected to be in force when the temporary differences unwind.
Six months ended 31 Dec 2025 (unaudited) | Six months ended 31 Dec 2024 (unaudited) | Year ended 30 Jun 2025 (audited) | |
£'000 | £'000 | £'000 | |
UK Corporation Tax | 2,291 | 3,771 | 6,670 |
Under provision in prior years | 2 | - | 576 |
Total current taxation | 2,293 | 3,771 | 7,246 |
Deferred tax credits | (749) | (366) | (1,357) |
Over provision of deferred tax in prior years | (74) | - | - |
Total income tax expense | 1,470 | 3,405 | 5,889 |
The tax on the Group's profit before tax differs from the theoretical amount that would arise using the time apportioned tax rate applicable to profits of the consolidated entities in the UK as follows, split out between underlying and statutory profits:
|
|
| |
Six months ended 31 Dec 2025 (unaudited) | Underlying profit £'000 | Underlying profit adjustments £'000 | Statutory profit £'000 |
Profit before taxation from continuing operations | 13,634 | (7,430) | 6,204 |
|
|
| |
Profit before tax multiplied by the standard rate of tax in the UK of 25.0% | 3,409 | (1,858) | 1,551 |
Tax effect of amounts that are not deductible/(taxable) in calculating taxable income: |
|
|
|
- Depreciation and amortisation | (33) | - | (33) |
- Disallowable expenses | 60 | 109 | 169 |
- Share-based payments | (5) | - | (5) |
- Over provision in prior periods | - | (72) | (72) |
- Non-taxable income | (140) | - | (140) |
Income tax expense | 3,291 | (1,821) | 1,470 |
|
|
| |
Effective tax rate | 24.1% | n/a | 23.7% |
Six months ended 31 Dec 2024 (unaudited) | Underlying profit £'000 | Underlying profit adjustments £'000 | Statutory profit £'000 |
Profit before taxation from continuing operations | 15,517 | (2,893) | 12,624 |
Profit multiplied by the standard rate of tax in the UK of 25.0% | 3,879 | (723) | 3,156 |
Tax effect of amounts that are not (taxable)/deductible in calculating taxable income: | |||
- Depreciation and amortisation | 464 | (30) | 434 |
- Disallowable expenses | 133 | - | 133 |
- Share-based payments | (212) | 48 | (164) |
- Non-taxable income | (23) | (131) | (154) |
Income tax expense | 4,241 | (836) | 3,405 |
Effective tax rate | 27.3% | n/a | 27.0% |
Year ended 30 Jun 2025 (audited) | Underlying profit £'000 | Underlying profit adjustments £'000 | Statutory profit £'000 |
Profit before taxation from continuing operations | 28,905 | (11,386) | 17,519 |
Profit before taxation multiplied by the standard rate of tax in the UK of 25.0% | 7,226 | (2,847) | 4,379 |
Tax effect of amounts that are not deductible/(taxable) in calculating taxable income: | |||
- Depreciation and amortisation | (54) | 79 | 25 |
- Disallowable expenses | 381 | 983 | 1,364 |
- Share-based payments | (470) | 15 | (455) |
- Under provision in prior periods | 576 | - | 576 |
Income tax expense | 7,659 | (1,770) | 5,889 |
Effective tax rate | 26.5% | n/a | 33.6% |
There were no material changes to deferred tax assets or liabilities during the period and no changes in tax legislation affecting the Group.
6. Earnings per share
The Board of Directors considers that underlying earnings per share provides an appropriate reflection of the Group's performance in the financial year. Underlying earnings per share are calculated based on 'underlying earnings', which is defined as earnings after underlying adjustments listed below. The tax effect of these adjustments has also been considered. Underlying earnings is an alternative performance measure ("APM") used by the Group.
Earnings for the period used to calculate earnings per share as reported in these condensed consolidated financial statements were as follows:
Six months ended 31 Dec 2025 (unaudited) | Six months ended 31 Dec 2024 (unaudited)1 | Year ended 30 Jun 2025 (audited) | |
£'000 | £'000 | £'000 | |
Earnings from continuing operations | 4,734 | 9,219 | 11,630 |
Earnings from discontinued operations | - | 378 | 9,354 |
Earnings after tax attributable to ordinary shareholders | 4,734 | 9,597 | 20,984 |
Acquisition and integration-related costs | 1,200 | 2,537 | 4,390 |
Strategic transformation and restructuring costs | 6,833 | 1,050 | 2,084 |
Amortisation of acquired client relationships | 2,389 | 1,696 | 3,997 |
Move to LSE's Main Market costs | - | 524 | 1,926 |
Head office relocation | 1,202 | - | 1,278 |
Other non-operating items | (4,194) | (2,913) | (2,289) |
Tax impact of underlying profit adjustments | (1,821) | (835) | (1,770) |
Less earnings from discontinued operations | - | (378) | (9,354) |
Underlying earnings attributable to ordinary shareholders from continuing operations | 10,343 | 11,278 | 21,246 |
1 Certain line items have been reclassified to align with the current period's presentation.
Other non-operating items for the six-month period ended 31 December 2025 comprise insurance proceeds received of £4.65 million, partially offset by non-operating costs of £0.46 million primarily relating to legacy legal matters. For comparison, other non-operating items in the six-month period ended 31 December 2024 and the year ended 30 June 2025 included an HMRC VAT refund of £3.10 million in respect of the Group's AIM Portfolio Services, following confirmation of VAT exemption for the period from 1 October 2019 to 30 September 2024. These prior period amounts were partially offset by £0.22 million (H1 2025) and £0.81 million (FY 2025) of legacy legal costs and strategy-related review costs.
Strategic transformation and restructuring costs of £6.83 million have been excluded from operating profit as they relate to significant one-off initiatives and organisational changes intended to reshape the business and enhance future operational efficiency. Of this amount, £2.80 million relates to organisational restructuring, primarily redundancy costs incurred to streamline operations and eliminate duplication across core processes. The remainder relates to reviewing our products and propositions to meet client needs and investing in digital capabilities including AI. These items are non-recurring and do not represent the ongoing cost base required to support revenue generation in the current reporting period.
Basic earnings per share is calculated by dividing earnings attributable to ordinary shareholders by the weighted average number of shares in issue throughout the period. Included in the weighted average number of shares for basic earnings per share purposes are employee share options at the point all necessary conditions have been satisfied and the options have vested, even if they have not yet been exercised.
Diluted earnings per share represents the basic earnings per share adjusted for the effect of dilutive potential shares issuable on exercise of employee share options under the Group's share-based payment schemes, weighted for the relevant period. The diluted weighted average number of shares in issue and diluted earnings per share considers the effect of all dilutive potential shares issuable on exercise of employee share options. The potential shares issuable includes the contingently issuable shares that have not yet vested and the vested unissued share options that are either nil cost options or have little or no consideration.
The weighted average number of shares in issue during the six months ended 31 December 2025 were as follows:
Six months ended 31 Dec 2025 (unaudited) | Six months ended 31 Dec 2024 (unaudited) | Year ended 30 Jun 2025 (audited) | |
Number of shares | Number of shares | Number of shares | |
Weighted average number of shares in issue | 15,637,396 | 16,210,734 | 16,160,786 |
Effect of dilutive potential shares issuable on exercise of employee share options | 480,643 | 186,225 | 135,256 |
Diluted weighted average number of shares in issue | 16,118,039 | 16,396,959 | 16,296,042 |
Six months ended 31 Dec 2025 (unaudited) p | Six months ended 31 Dec 2024 (unaudited) p | Year ended 30 Jun 2025 (audited) p | |
Based on reported earnings: | |||
Basic earnings per share from continuing operations | 30.3 | 56.9 | 72.0 |
Basic earnings per share from discontinuing operations | - | 2.3 | 57.9 |
Total statutory basic earnings per share | 30.3 | 59.2 | 129.9 |
Diluted earnings per share from continuing operations | 29.4 | 56.2 | 71.4 |
Diluted earnings per share from discontinuing operations | - | 2.3 | 57.4 |
Total statutory diluted earnings per share | 29.4 | 58.5 | 128.8 |
Based on underlying earnings from continuing operations: |
| ||
Basic underlying earnings per share | 66.1 | 69.6 | 131.5 |
Diluted underlying earnings per share | 64.2 | 68.8 | 130.4 |
7. Dividends paid
Six months ended 31 Dec 2025 (unaudited) | Six months ended 31 Dec 2024 (unaudited) | Year ended 30 Jun 2025 (audited) | |
£'000 | £'000 | £'000 | |
Final dividend paid on ordinary shares | 7,904 | 7,872 | 7,872 |
Interim dividend paid on ordinary shares | - | - | 4,823 |
Total dividends | 7,904 | 7,872 | 12,695 |
An interim dividend of 31.0p (six months ended 31 December 2024: 30.0p) per share was declared by the Board of Directors on 23 February 2026. It will be paid on 10 April 2026 to shareholders who are on the register at the close of business on 13 March 2026.
In accordance with IAS 10, this dividend has not been included as a liability in the condensed consolidated financial statements at 31 December 2025.
A final dividend for the year ended 30 June 2025 of 51.0p (year ended 30 June 2024: 49.0p) per share was paid to shareholders on 4 November 2025.8. Intangible assets
Goodwill £'000 | Computer software £'000 | Acquired client relationship contracts £'000 | Total £'000 | |
Cost | ||||
At 1 July 2024 | 64,373 | 10,564 | 76,098 | 151,035 |
Additions | 5,539 | 3,359 | 7,281 | 16,179 |
Disposal of goodwill | (245) | - | - | (245) |
Transfer of intangible asset to held for sale | (21,243) | - | (29,930) | (51,173) |
At 31 December 2024 | 48,424 | 13,923 | 53,449 | 115,796 |
Additions | 26,128 | 4,132 | 15,696 | 45,956 |
Disposal of subsidiary | (4) | - | - | (4) |
At 30 June 2025 | 74,548 | 18,055 | 69,145 | 161,748 |
Additions | - | 4,291 | - | 4,291 |
Measurement period adjustment | 224 | - | - | 224 |
At 31 December 2025 | 74,772 | 22,346 | 69,145 | 166,263 |
Accumulated amortisation | ||||
At 30 June 2024 | 22,854 | 1,962 | 42,995 | 67,811 |
Amortisation charge | - | 1,004 | 2,928 | 3,932 |
Transfer of intangible asset to held for sale | (11,641) | - | (21,554) | (33,195) |
At 31 December 2024 | 11,213 | 2,966 | 24,369 | 38,548 |
Amortisation charge | - | 1,476 | 2,935 | 4,411 |
Disposal of subsidiary | - | - | (676) | (676) |
At 30 June 2025 | 11,213 | 4,442 | 26,628 | 42,283 |
Amortisation charge | - | 2,017 | 2,389 | 4,406 |
At 31 December 2025 | 11,213 | 6,459 | 29,017 | 46,689 |
Net book value | ||||
At 30 June 2024 | 41,519 | 8,602 | 33,103 | 83,224 |
At 31 December 2024 | 37,211 | 10,957 | 29,080 | 77,248 |
At 30 June 2025 | 63,335 | 13,613 | 42,517 | 119,465 |
At 31 December 2025 | 63,559 | 15,887 | 40,128 | 119,574 |
a. Goodwill
Goodwill arising on business combinations is allocated at acquisition to the cash-generating units ("CGU"s) expected to benefit from those combinations.
During the period, following changes to how the Group manages operations internally, the Group reviewed its CGU structure for goodwill impairment testing and reorganised its acquired businesses into three separate CGUs. Under the revised structure the following CGUs have been identified:
• Financial Planning
• Funds
• Investment Management
The change has been applied prospectively as a change in estimate under IAS 36. Comparative information has not been restated, and impairment testing for prior periods was performed under the previous CGU structure.
Goodwill has been reallocated to the current CGUs on a reasonable and consistent basis to reflect expected synergies.
The carrying amount of goodwill as at the period-end in respect of these CGUs comprises:
31 Dec 2025 (unaudited) £'000 | |
Financial Planning | 40,427 |
Investment Management | 11,122 |
Funds | 12,010 |
Total goodwill | 63,559 |
The carrying amount of goodwill allocated to CGUs in prior periods for the purpose of impairment testing is set out in the table below:
CGU | As at 31 Dec 2024 (unaudited) £'000 | As at 30 Jun 2025 (audited) £'000 |
LIFT | - | 26,124 |
Cornelian | 16,111 | 15,863 |
Adroit | 8,541 | 8,541 |
Integrity | 3,945 | 3,945 |
Lucas Fettes | 3,860 | 3,859 |
Funds | 3,075 | 3,320 |
CST | 1,679 | 1,683 |
Total goodwill | 37,211 | 63,335 |
Following the change in CGU structure, the Group performed impairment testing at the period-end on the revised CGUs. Recoverable amounts were determined using value-in-use calculations based on five-year cash flow projections derived from the latest Board-approved budgets and forecasts. Cash flows beyond this period were extrapolated using a long-term growth rate of 2%, consistent with historical performance, management strategies, and prevailing economic conditions. Key judgements and estimates applied in the impairment calculations include pre-tax discount rates and annual revenue growth assumptions, which are presented in the table below and reflect market conditions and CGU-specific risks.
CGU | 31 Dec 2025 Pre-tax discount rate | 31 Dec 2025 Annual revenue growth |
Financial Planning | 12.4% | 10% - 12% |
Funds | 12.4% | 0% - 8% |
Investment management | 12.4% | 4% - 5% |
All CGUs with goodwill showed surplus recoverable amounts over carrying amounts in an impairment assessment as at 31 December 2025. No significant changes to assumptions of CGU-specific risks necessitate further disclosure.
b. Computer software
Costs incurred on internally developed computer software and system development are initially recognised at cost and, when the software or system is available for use, the costs are amortised on a straight-line basis over an estimated useful life of four years, with some specific projects amortised over longer useful economic lives ("UELs") based on their size and usability.
c. Acquired client relationship contracts
Acquired client relationship contracts are initially measured at fair value and amortised over estimated useful lives ranging from 6 to 20 years. There were no indicators of impairment as at 31 December 2025.
9. Property, plant and equipment
Leasehold improvements £'000 | Fixtures, fittings and office equipment £'000 | IT equipment £'000 | Total £'000 | ||
Cost | |||||
At 1 July 2024 | 3,148 | 686 | 986 | 4,820 | |
Additions | 119 | - | - | 119 | |
Property, plant and equipment acquired from business combinations | - | 161 | 142 | 303 | |
Disposal of subsidiary | (730) | (151) | (146) | (1,027) | |
At 31 December 2024 | 2,537 | 696 | 982 | 4,215 | |
Additions | 2,498 | 22 | 335 | 2,855 | |
Disposals | - | (7) | - | (7) | |
At 30 June 2025 | 5,035 | 711 | 1,317 | 7,063 | |
Additions | 3,428 | 158 | 10 | 3,596 | |
At 31 December 2025 | 8,463 | 869 | 1,327 | 10,659 | |
Accumulated depreciation | |||||
At 1 July 2024 | 2,207 | 534 | 729 | 3,470 | |
Depreciation charge | 195 | 48 | 81 | 324 | |
Property, plant and equipment acquired from business combinations | - | 146 | 129 | 275 | |
Disposal of subsidiary | (557) | (102) | (132) | (791) | |
At 31 December 2024 | 1,845 | 626 | 807 | 3,278 | |
Additions | 51 | (2) | 9 | 58 | |
Depreciation charge | 189 | 36 | 97 | 322 | |
Disposal of subsidiary | (9) | (3) | (1) | (13) | |
At 30 June 2025 | 2,076 | 657 | 912 | 3,645 | |
Depreciation charge | 218 | 17 | 68 | 303 | |
At 31 December 2025 | 2,294 | 674 | 980 | 3,948 | |
Net book value | |||||
At 30 June 2024 | 941 | 152 | 257 | 1,350 | |
At 31 December 2024 | 692 | 70 | 175 | 937 | |
At 30 June 2025 | 2,959 | 54 | 405 | 3,418 | |
At 31 December 2025 | 6,169 | 195 | 347 | 6,711 | |
10. Right-of-use assets
31 Dec 2025 (unaudited) £'000 | 31 Dec 2024 (unaudited) £'000 | 30 Jun 2025 (audited) £'000 | |
Property | 11,345 | 2,281 | 12,555 |
Cars | 209 | 340 | 235 |
Total right-of-use assets | 11,554 | 2,621 | 12,790 |
During the year ended 30 June 2025, the Company recognised a right-of-use asset totalling £11,509,000 in respect of a lease agreement for the Group's head office relocation, with a 10-year term and no break options, a rent review scheduled five years from lease commencement, a 25-month rent-free period at the start of the lease and no rent deposit required.
11. Lease liabilities
Cars £'000 | Property £'000 | Total £'000 | |
At 1 July 2024 | 439 | 3,375 | 3,814 |
Additions | 28 | - | 28 |
Adjustment on change of lease terms | (16) | 655 | 639 |
Payments made | (106) | (1,181) | (1,287) |
Finance cost of lease liabilities | 8 | 61 | 69 |
Disposal of subsidiary | - | (233) | (233) |
At 31 December 2024 | 353 | 2,677 | 3,030 |
Additions | 24 | 14,204 | 14,228 |
Adjustment on change of lease terms | (41) | (652) | (693) |
Payments made | (97) | (1,835) | (1,932) |
Finance cost of lease liabilities | 7 | 219 | 226 |
Disposal of subsidiary | - | 59 | 59 |
At 30 June 2025 | 246 | 14,672 | 14,918 |
Additions | 75 | 24 | 99 |
Payments made | (88) | (1,023) | (1,111) |
Adjustment on change of lease terms | (19) | - | (19) |
Finance cost of lease liabilities | 6 | 386 | 392 |
At 31 December 2025 | 220 | 14,059 | 14,279 |
Cars £'000 | Property £'000 | Total £'000 | |
Analysed as: | |||
Amounts falling due within one year | 140 | 608 | 748 |
Amounts falling due after more than one year | 80 | 13,451 | 13,531 |
Total lease liabilities | 220 | 14,059 | 14,279 |
12. Provisions
Client compensation £'000 | Regulatory levies £'000 | Leasehold dilapidations £'000 | Other provisions £'000 | Total £'000 | |
At 1 July 2024 | 595 | 691 | 440 | 280 | 2,006 |
Additions | - | - | - | 2 | 2 |
Charged to the condensed consolidated statement of comprehensive income | 134 | - | 33 | - | 167 |
Utilised during the period | (120) | (691) | - | - | (811) |
Provisions reclassified to held for sale | - | - | (8) | - | (8) |
At 31 December 2024 | 609 | - | 465 | 282 | 1,356 |
Charged to the condensed consolidated statement of comprehensive income | (119) | 817 | 433 | 236 | 1,367 |
Utilised during the period | (155) | - | - | (280) | (435) |
Additions | - | - | - | 373 | 373 |
Disposals | - | - | 2 | - | 2 |
At 30 June 2025 | 335 | 817 | 900 | 611 | 2,663 |
Charged to the condensed consolidated statement of comprehensive income |
- |
- | 51 | - | 51 |
Utilised during the period | (100) | (817) | (390) | (154) | (1,461) |
At 31 December 2025 | 235 | - | 561 | 457 | 1,253 |
Analysed as: | |||||
Amounts falling due within one year | 235 |
- | 380 | 457 | 1,072 |
Amounts falling due after more than one year | - |
- | 181 | - | 181 |
Total provisions | 235 | - | 561 | 457 | 1,253 |
a) Client compensation
Client compensation provisions relate to the probable liability arising from client complaints against the Group. Complaints are assessed on a case by case basis and provisions for compensation are made where judged necessary. The amount recognised within provisions for client compensation represents management's best estimate of the probable liability. The timing of the corresponding outflows is uncertain as these are made as and when claims arise.
b) Regulatory levies
At 31 December 2025 no provision has been made in respect of expected levies by the Financial Services Compensation Scheme ("FSCS") (31 December 2024: £nil; 30 June 2025: £817,000).
c) Leasehold dilapidations
Leasehold dilapidations relate to dilapidation provisions expected to arise on leasehold premises held by the Group, and monies due under the contract with the assignee of leases on the Group's leased properties. The non-current leasehold dilapidations provision relates to expected economic outflow at the end of lease terms, with the longest lease term ending in 10 years from the condensed consolidated statement of financial position date.
d) Other provisions
Other provisions include provisions made for tax matters and on-going advice reviews.
13. Financial instruments
The analysis of financial assets and liabilities into their categories as defined in IFRS 9 Financial Instruments is set out in the below table.
|
|
| |
31 Dec 2025 (unaudited) £'000 | 31 Dec 2024 (unaudited) £'000 | 30 Jun 2025 (audited) £'000 | |
Financial assets | |||
Financial assets at fair value through profit or loss: | |||
Deferred contingent consideration receivable | 14,579 | 661 | 14,188 |
Investment in regulated OEICs | 1,216 | 938 | 1,095 |
Financial assets at amortised cost: |
| ||
Investment in UK Government Investment Loan and Treasury Stock | 14,963 | 30,019 | 19,925 |
Trade and other receivables | 25,851 | 25,625 | 25,881 |
Cash and cash equivalents | 12,073 | 29,475 | 33,915 |
Total financial assets | 68,682 | 86,718 | 95,004 |
Financial liabilities | |||
Financial liabilities at fair value through profit or loss: | |||
Deferred contingent consideration payable | 11,328 | 6,186 | 16,105 |
Financial liabilities at amortised cost: |
| ||
Trade and other payables | 6,017 | 4,003 | 7,959 |
Total financial liabilities | 17,345 | 10,189 | 24,064 |
During the six months ended 31 December 2025, the Group reassessed its business model for managing its gilt holdings. While the previous objective was to hold these investments to maturity, a partial disposal was made during the period following a review of the Group's strategy for managing liquidity. Following this reassessment, the Group concluded that the business model no longer meets the criteria for classification at amortised cost under IFRS 9. Accordingly, with effect from 1 January 2026, gilt holdings will be reclassified from 'financial assets at amortised cost' to 'financial assets at fair value through other comprehensive income' ("FVOCI") to reflect the revised business model.
The following table provides an analysis of the financial assets and liabilities that, subsequent to initial recognition, are measured at fair value. These are grouped into the following levels within the fair value hierarchy, based on the degree to which the inputs used to determine the fair value are observable:
• Level 1 - derived from quoted prices in active markets for identical assets or liabilities at the measurement date;
• Level 2 - derived from inputs other than quoted prices included within level 1 that are observable, either directly or indirectly; and
• Level 3 - derived from inputs that are not based on observable market data.
Level 1 £'000 | Level 2 £'000 | Level 3 £'000 | Total £'000 | |
Financial assets | ||||
At 1 July 2024 | 905 | - | 500 | 1,405 |
Additions | 674 | - | - | 674 |
Net changes in fair value | 17 | - | - | 17 |
Finance income of deferred contingent consideration receivable | 3 | - | - | 3 |
Disposals | - | - | (500) | (500) |
At 31 December 2024 | 1,599 | - | - | 1,599 |
Reclassification | (661) | - | 661 | - |
Additions | 130 | - | 13,649 | 13,779 |
Net changes in fair value | 27 | - | (392) | (365) |
Finance income of deferred contingent consideration receivable | - | - | 270 | 270 |
At 30 June 2025 | 1,095 | - | 14,188 | 15,283 |
Additions | 30 | - | - | 30 |
Net changes in fair value | 91 | - | - | 91 |
Finance income of deferred contingent consideration receivable | - | - | 391 | 391 |
At 31 December 2025 | 1,216 | - | 14,579 | 15,795 |
Comprising: | ||||
Deferred contingent consideration receivable | - | - | 14,579 | 14,579 |
Investments in OEICs | 1,216 | - | - | 1,216 |
Total financial assets | 1,216 | - | 14,579 | 15,795 |
The Group holds investments in open ended investment companies ("OEICs") for which it acts as the investment manager. During the six months ended 31 December 2025, the Group recognised a gain on these investments of £91,000 and invested a further £30,000, resulting in a value at 31 December 2025 of £1,216,000 (31 December 2024: £938,000, 30 June 2025: £1,095,000).
During the six months ended 31 December 2025, the Group recognised net changes in fair value of nil and finance income of £391,000 on deferred contingent consideration receivable (Note 13).
Level 1 £'000 | Level 2 £'000 | Level 3 £'000 | Total £'000 | |
Financial liabilities | ||||
At 1 July 2024 | - | - | - | - |
Additions | - | - | 6,149 | 6,149 |
Finance cost of deferred contingent consideration | - | - | 37 | 37 |
At 31 December 2024 | - | - | 6,186 | 6,186 |
Additions | - | - | 9,189 | 9,189 |
Finance cost of deferred contingent consideration | - | - | 389 | 389 |
Net changes in fair value | - | - | 341 | 341 |
At 30 June 2025 | - | - | 16,105 | 16,105 |
Additions | - | - | - | - |
Finance cost of deferred contingent consideration | - | - | 440 | 440 |
Payments made | - | - | (5,217) | (5,217) |
At 31 December 2025 | - | - | 11,328 | 11,328 |
Comprising: | ||||
Deferred contingent consideration payable | - | - | 11,328 | 11,328 |
Total financial liabilities | - | - | 11,328 | 11,328 |
Level 3 financial liabilities relate to deferred contingent consideration payable, valued using the net present value of the expected future amounts payable. The key inputs are management-approved forecasts and expectations against the criteria of the deferred contingent consideration to set expectations of future amounts payable. The deferred contingent consideration is reviewed and revalued at regular intervals over the deferred contingent consideration period. The fair value is sensitive to the change in management-approved forecasts, which relate to revenue and AUM projections for future periods, however, at each reporting date, the relevant management approved forecasts are deemed to be the most accurate and relevant input to the fair value measurement.
14. Deferred contingent consideration receivable
Deferred contingent consideration receivable reflects the Directors' best estimate of amounts receivable in the future in respect of the sale of certain subsidiary undertakings and businesses. Deferred contingent consideration receivable is measured at its fair value based on discounted expected future cash flows. The movements in the total deferred contingent consideration receivable balance during the financial year were as follows:
Six months ended 31 Dec 2025 (unaudited) | Six months ended 31 Dec 2024 (unaudited) | Year ended 30 Jun 2025 (audited) | |
£'000 | £'000 | £'000 | |
At beginning of period | 14,188 | - | - |
Additions | - | 658 | 14,307 |
Finance cost of deferred contingent consideration | 391 | 3 | 273 |
Fair value adjustments | - | - | (392) |
At end of period | 14,579 | 661 | 14,188 |
| |||
Analysed as: |
| ||
Amounts falling due within one year | 80 | - | 289 |
Amounts falling due after more than one year | 14,499 | 661 | 13,899 |
At end of period | 14,579 | 661 | 14,188 |
During the six months ended 31 December 2025, the Group did not receive any payments in respect of deferred contingent consideration arrangements. Finance income of £391,000 has been recognised on deferred contingent consideration during the period. As at 31 December 2025, the Group estimates the fair value of remaining amounts receivable to be £14,579,000.
Deferred contingent consideration receivable is classified as Level 3 within the fair value hierarchy, as defined in note 13.
15. Deferred contingent consideration payable
Deferred contingent consideration payable reflects the Directors' best estimate of amounts payable in the future in respect of certain client relationships and subsidiary undertakings acquired by the Group. These amounts are based on client attrition levels and business profitability over the deferral period and are measured at fair value using discounted expected future cash flows. Deferred contingent consideration is split between current and non-current liabilities depending on whether payment is due within one year of the reporting date.
The movements in the total deferred contingent consideration payable balance during the financial period were as follows:
Six months ended 31 Dec 2025 (unaudited) | Six months ended 31 Dec 2024 (unaudited) | Year ended 30 Jun 2025 (audited) | |
£'000 | £'000 | £'000 | |
At beginning of period | 16,105 | - | - |
Additions | - | 6,149 | 15,338 |
Finance cost of deferred contingent consideration | 440 | 37 | 426 |
Fair value adjustments | - | - | 341 |
Cash consideration paid | (5,217) | - | - |
At end of period | 11,328 | 6,186 | 16,105 |
Analysed as: | |||
Amounts falling due within one year | 11,328 | 4,472 | 14,176 |
Amounts falling due after more than one year | - | 1,714 | 1,929 |
At end of period | 11,328 | 6,186 | 16,105 |
During the six months ended 31 December 2025, the Group made payments in respect of deferred contingent consideration arrangements of £5,217,000. A finance cost of £440,000 has been recognised on this deferred contingent consideration during the period. As at 31 December 2025, the Group estimates the fair value of remaining amounts payable to be £11,328,000.
Deferred contingent consideration payable is classified as Level 3 within the fair value hierarchy, as defined in Note 13.
16. Reconciliation of operating profit to net cash inflow from operating activities
Six months ended 31 Dec 2025 (unaudited) | Six months ended 31 Dec 20241 (unaudited) | Year ended 30 Jun 2025 (audited) | |
£'000 | £'000 | £'000 | |
Operating profit before tax | 1,308 | 8,496 | 12,006 |
| |||
Adjustments for: |
| ||
Amortisation of intangible assets | 4,406 | 3,562 | 7,850 |
Depreciation of property, plant and equipment | 303 | 302 | 520 |
Depreciation of right-of-use assets | 1,298 | 882 | 2,044 |
Impairment of right-of-use assets | - | - | 411 |
Other losses/(gains) | (129) | (17) | 247 |
(Increase)/decrease in receivables | (763) | 366 | 537 |
(Decrease)/increase in payables | (9,693) | (3,034) | 3,125 |
(Decrease)/increase in provisions | (1,410) | (376) | 151 |
Increase/(decrease) in other non-current liabilities | (162) | (359) | 457 |
Share-based payments charge | 2,177 | 1,942 | 1,379 |
Net cash (used in)/generated from operating activities | (2,665) | 11,764 | 28,727 |
1 The prior financial period operating profit has been restated to separate the results of discontinued operations, consistent with the presentation in the current financial year.
17. Share capital and share premium
The movements in share capital and share premium during the six months ended 31 December 2025 were as follows:
Number of shares | Exercise price £ | Share capital £'000 | Share premium £'000 | Total £'000 | |
At 30 June 2024 | 16,472,453 | 165 | 83,135 | 83,300 | |
Shares issued: | |||||
- on exercise of options | 699 | 17.70 | - | - | - |
- to Sharesave Scheme | 4,714 | 14.24 - 19.88 | - | 74 | 74 |
- for deferred contingent consideration | 42,673 | - | - | 706 | 706 |
At 31 December 2024 | 16,520,539 | 165 | 83,915 | 84,080 | |
Shares issued: | |||||
- on exercise of options | n/a | 16.30 - 22.60 | - | 16 | 16 |
- to Sharesave Scheme | n/a | 14.00 - 23.00 | 56 | 56 | |
Shares cancelled on buybacks | (464,000) | (5) | - | (5) | |
At 30 June 2025 | 16,056,539 |
| 160 | 83,987 | 84,147 |
Shares cancelled on buybacks | (179,330) | - | (1) | - | (1) |
At 31 December 2025 | 15,877,209 |
| 159 | 83,987 | 84,146 |
|
|
|
|
The total number of ordinary shares issued and fully paid at 31 December 2025 was 15,877,209 (at 31 December 2024: 16,520,539; at 30 June 2025: 16,056,539).
Employee Benefit Trust
The Group established an Employee Benefit Trust ("EBT") on 3 December 2010 to acquire ordinary shares in the Company to satisfy awards under the Group's Long-Term Incentive Scheme ("LTIS") and Long-Term Incentive Plan ("LTIP"). At 31 December 2025, the EBT held 428,868 (at 31 December 2024: 407,401; at 30 June 2025: 437,374) 1p ordinary shares in the Company with a market value of £6,915,000 (at 31 December 2024: £6,753,000; at 30 June 2025: £7,457,000). They are classified as treasury shares in the condensed consolidated statement of financial position, their cost being deducted from retained earnings within shareholders' equity. During the six months ended 31 December 2025, 84,100 shares were purchased by the EBT and 92,606 shares were transferred to option/restricted shareholders on exercise of options or to holders of restricted shares when the restrictions lapsed.
18. Equity-settled share-based payments
Share options granted during the six months ended 31 December 2025 under the Group's equity-settled share-based payment schemes were as follows:
Exercise price £ | Fair value £ | Number of options | |
Long Term Incentive Plan | - | 14.18 - 17.09 | 337,091 |
No options were granted in respect of the Company's other equity-settled share-based payment schemes during the six months ended 31 December 2025. The charge to the condensed consolidated statement of comprehensive income for the six months ended 31 December 2025 in respect of all equity settled share-based payment schemes was £2,177,000 (six months ended 31 December 2024: £2,088,000; year ended 30 June 2025: £2,856,000).
19. Related party transactions
Transactions between the Company and its subsidiaries, which are related parties, are eliminated on consolidation. Certain of the Group's key management personnel make use of the services provided by companies within the Group. Charges for such services are made at various staff rates. All transactions were made on normal business terms.
There were no material changes to the nature or terms of related party transactions since 30 June 2025. Key management personnel compensation in the period was broadly consistent with that disclosed in the 30 June 2025 Annual Report.
Funds managed by the Group are related parties by virtue of their management contracts. During the six months ended 31 December 2025, the Group earned £2,798,000 in fund investment management fees (six months ended 31 December 2024: £3,359,000; year ended 30 June 2025: £6,598,000).The Group also invests in certain of the funds it manages and transactions during the period are presented in note 13.
20. Guarantees, contingent liabilities and contingent assets
In the normal course of business, the Group is exposed to legal and regulatory issues, which, in the event of a dispute, could develop into litigious proceedings and, in some cases, may result in contingent liabilities. Similarly, a contingent liability may arise in the event of a finding in respect of the Group's tax affairs, including the accounting for VAT, which could result in a financial outflow and/or inflow from the relevant tax authorities. The Board assesses any such matters on an ongoing basis.
Brooks Macdonald Asset Management Limited, a subsidiary company of the Group, has an agreement with the Royal Bank of Scotland plc to guarantee settlement for trading with CREST stock on behalf of clients. The Group holds client assets to fund such trading activity.
21. Principal risks and uncertainties
The principal risks and uncertainties facing the Group are in line with those disclosed and included within the Group's Annual Report and Accounts for the year ended 30 June 2025.
22. Events since the end of the period
An interim dividend was declared on 23 February 2026, refer to note 7 for further details.
No other material events have occurred between the reporting date and the date of signing the condensed consolidated financial statements.
Non-IFRS financial information
Non-IFRS financial information or alternative performance measures ("APMs") are used as supplemental measures in monitoring the performance of the Group. The adjustments applied to IFRS measures to compute the Group's APMs exclude income and expense categories, which are deemed to be outside the normal course of business operations. The Board considers the disclosed APMs to be an appropriate reflection of the Group's underlying performance.
The Group follows a rigorous process in determining whether an adjustment should be made to present an alternative performance measure compared to IFRS measures.
For an adjustment to be removed from IFRS statutory profit before tax to derive underlying profit, it must be a significant item and meet the following criteria:
• It is non-recurring and outside the normal course of business operations; or
• It has been incurred as a result of an acquisition, disposal or company restructure process.
The Group uses the below APMs:
APM | Equivalent IFRS measure | Definition and purpose |
Underlying profit before tax from continuing operations | Statutory profit before tax from continuing operations | Calculated as profit before tax from continuing operations, excluding income and expense categories which are deemed of a non-recurring nature or a non-cash operating item. It is considered by the Board to be an appropriate reflection of the Group's performance and considered appropriate for external analyst coverage and peer group benchmarking. See note 6 for a reconciliation of underlying profit before tax from continuing operations and statutory profit before tax from continuing operations and an explanation for each item excluded in underlying profit before tax. |
Underlying tax charge from continuing operations | Statutory tax charge from continuing operations | Calculated as the statutory tax charge from continuing operations, excluding the tax impact of the adjustments excluded from underlying profit from continuing operations. See note 5 Taxation |
Underlying profit after tax from continuing operations | Total comprehensive income from continuing operations | Calculated as underlying profit before tax from continuing operations less the underlying tax charge from continuing operations. See note 6 for a reconciliation of underlying profit after tax from continuing operations and total comprehensive income. |
Underlying profit margin before tax from continuing operations | Statutory profit margin before tax from continuing operations | Calculated as underlying profit before tax from continuing operations over revenue for the period. This is another key metric assessed by the Board and appropriate for external analyst coverage and peer group benchmarking. |
Underlying basic earnings per share from continuing operations | Statutory basic earnings per share from continuing operations | Calculated as underlying profit after tax from continuing operations, divided by the weighted average number of shares in issue during the period. This is a key management incentive metric and is a measure used within the Group's remuneration schemes. See note 6 Earnings per share. |
Underlying diluted earnings per share from continuing operations | Statutory diluted earnings per share from continuing operations | Calculated as underlying profit after tax from continuing operations, divided by the weighted average number of shares in issue during the period, including the dilutive impact of future share awards. This is a key management incentive metric and is a measure used within the Group's remuneration schemes. See note 6 Earnings per share. |
Underlying costs from continuing operations | Statutory costs from continuing operations | Calculated as the aggregate of total administrative expenses, other net gains/(losses), finance income and finance costs from continuing operations, and excluding income and expense categories which are deemed of a non-recurring nature or a non-cash operating item. This is a key measure used in calculating underlying profit before tax. See note 6 for details on underlying costs from continuing operations. |
Statement of Directors' responsibilities
The Directors confirm that the Interim Report and Accounts have been prepared in accordance with International Accounting Standard 34, 'Interim Financial Reporting', as adopted by the European Union and that the Interim management report includes a fair review of the information required by DTR 4.2.7 and DTR 4.2.8, namely:
• an indication of important events that have occurred during the first six months and their impact on the condensed consolidated financial statements, and a description of the principal risks and uncertainties for the remaining six months of the financial year; and
• material related party transactions in the first six months and any material changes in the related party transactions described in the last Annual Report and Accounts.
By order of the Board of Directors
Katherine Jones
CFO
23 February 2026
Independent review report to Brooks Macdonald Group plc
Report on the Condensed consolidated interim financial statements
Our conclusion
We have reviewed Brooks Macdonald Group plc's Condensed consolidated interim financial statements (the "interim financial statements") in the Interim report and accounts of Brooks Macdonald Group plc for the 6-month period ended 31 December 2025 (the "period").
Based on our review, nothing has come to our attention that causes us to believe that the interim financial statements are not prepared, in all material respects, in accordance with UK adopted International Accounting Standard 34, 'Interim Financial Reporting' and the Disclosure Guidance and Transparency Rules sourcebook of the United Kingdom's Financial Conduct Authority.
The interim financial statements comprise:
• the Condensed consolidated statement of financial position as at 31 December 2025;
• the Condensed consolidated statement of comprehensive income for the period then ended;
• the Condensed consolidated statement of cash flows for the period then ended;
• the Condensed consolidated statement of changes in equity for the period then ended; and
• the explanatory notes to the interim financial statements.
The interim financial statements included in the Interim report and accounts of Brooks Macdonald Group plc have been prepared in accordance with UK adopted International Accounting Standard 34, 'Interim Financial Reporting' and the Disclosure Guidance and Transparency Rules sourcebook of the United Kingdom's Financial Conduct Authority.
Basis for conclusion
We conducted our review in accordance with International Standard on Review Engagements (UK) 2410, 'Review of Interim Financial Information Performed by the Independent Auditor of the Entity' issued by the Financial Reporting Council for use in the United Kingdom ("ISRE (UK) 2410"). A review of interim financial information consists of making enquiries, primarily of persons responsible for financial and accounting matters, and applying analytical and other review procedures.
A review is substantially less in scope than an audit conducted in accordance with International Standards on Auditing (UK) and, consequently, does not enable us to obtain assurance that we would become aware of all significant matters that might be identified in an audit. Accordingly, we do not express an audit opinion.
We have read the other information contained in the Interim report and accounts and considered whether it contains any apparent misstatements or material inconsistencies with the information in the interim financial statements.
Conclusions relating to going concern
Based on our review procedures, which are less extensive than those performed in an audit as described in the Basis for conclusion section of this report, nothing has come to our attention to suggest that the directors have inappropriately adopted the going concern basis of accounting or that the directors have identified material uncertainties relating to going concern that are not appropriately disclosed. This conclusion is based on the review procedures performed in accordance with ISRE (UK) 2410. However, future events or conditions may cause the group to cease to continue as a going concern.
Responsibilities for the interim financial statements and the review
Our responsibilities and those of the directors
The Interim report and accounts, including the interim financial statements, is the responsibility of, and has been approved by the directors. The directors are responsible for preparing the Interim report and accounts in accordance with the Disclosure Guidance and Transparency Rules sourcebook of the United Kingdom's Financial Conduct Authority. In preparing the Interim report and accounts, including the interim financial statements, the directors are responsible for assessing the group's ability to continue as a going concern, disclosing, as applicable, matters related to going concern and using the going concern basis of accounting unless the directors either intend to liquidate the group or to cease operations, or have no realistic alternative but to do so.
Our responsibility is to express a conclusion on the interim financial statements in the Interim report and accounts based on our review. Our conclusion, including our Conclusions relating to going concern, is based on procedures that are less extensive than audit procedures, as described in the Basis for conclusion paragraph of this report.
Use of this report
This report, including the conclusion, has been prepared for and only for the company for the purpose of complying with the Disclosure Guidance and Transparency Rules sourcebook of the United Kingdom's Financial Conduct Authority and for no other purpose. We do not, in giving this conclusion, accept or assume responsibility for any other purpose or to any other person to whom this report is shown or into whose hands it may come save where expressly agreed by our prior consent in writing.
PricewaterhouseCoopers LLP
Chartered Accountants London
23 February 2026
Related Shares:
Brooks Macdonald