11th Feb 2026 07:00
Renishaw plc
11 February 2026
HALF YEAR RESULTS FY2026
Renishaw, a world leader in measuring and manufacturing systems, today announces its interim results for the six months ended 31 December 2025 (H1 FY2026).
Strong H1 performance and a growing order book
Will Lee, Chief Executive Officer, commented:
"We have made strong progress in the first half, with a notable pick-up in revenue and order intake in Q2 and improving profitability. It is pleasing to see revenue growth in all three business segments, with significant progress in our emerging product lines. Our markets present significant structural growth opportunities, and we are excited about the prospects for the innovative products that we have recently launched. We enter H2 with momentum and we expect to achieve strong revenue and profit growth in the remainder of the year."
Performance highlights
Adjusted* (see note 12) | Statutory |
| |||||||||||
H1 FY2026 | H1 FY2025 | Growth | Constant FX growth | H1 FY2026 | H1 FY2025 | Growth |
| ||||||
| |||||||||||||
Revenue (£m) | 365.6 | 341.4 | 7.1% | 11.5% | 365.6 | 341.4 | 7.1% |
| |||||
| |||||||||||||
Operating profit (£m) | 57.5 | 51.6 | 11.4% | 49.6% | 40.1 | 51.6 | (22.3%) |
| |||||
Operating profit margin (%) | 15.7% | 15.1% | 0.6%pt | 11.0% | 15.1% | (4.1%pt) |
| ||||||
| |||||||||||||
Profit before tax (£m) | 64.1 | 57.5 | 11.5% | 46.0 | 57.5 | (20.0%) |
| ||||||
| |||||||||||||
Earnings per share (pence) | 68.8 | 63.2 | 8.9% | 49.9 | 63.2 | (21.0%) |
| ||||||
Dividend per share (pence) | 16.8 | 16.8 | - | ||||||||||
Return on invested capital (%) | 13.2% | 12.6% | 0.6%pt | ||||||||||
Adjusted cash flow conversion from operating activities (%) | 68% | 100% | (32%pt) | Note: %pt = percentage points | |||||||||
· Strong revenue growth: 7.1% at actual exchange rates, 11.5% at constant currency*.
· Record Q2 revenue, 14.1% higher than Q1, with further strengthening of the order book.
· Revenue growth in all segments, with strong growth in the Americas and APAC regions.
· Strong growth in defence and semiconductor sectors.
· Emerging product lines continue to gain traction, notably co-ordinate measuring machine and gauging systems, additive manufacturing (AM) systems, and enclosed optical encoders.
· 1.4% of H1 growth is attributable to higher pricing to wholly offset tariff duties in the USA.
· Average through-cycle revenue growth rising to 7.8% (5-year CAGR since H1 FY2021).
· Adjusted operating profit margin* rose 0.6%pt to 15.7%.
· 4.4%pt of organic margin improvement from fixed cost reduction, productivity initiatives and operational leverage, offset by (3.8%pt) of headwinds from currency and tariffs.
· Adjusted profit before tax* growth: 11.5%.
· Statutory profit before tax was 20.0% lower, including £18.0m of redundancy and impairment costs relating to previously announced restructuring activities, and other one-off costs.
· Adjusted cash flow conversion from operating activities*: 68% (H1 FY2025: 100%), with lower capital expenditure offset by higher working capital to support record Q2 sales and a growing order book.
· Strong balance sheet with cash and deposit balances of £240.9m (FY2025: £273.6m), reflecting full-year dividend, working capital investment and restructuring outflows.
· Return on invested capital* increased by 0.6%pt to 13.2%.
· Interim dividend maintained at 16.8 pence per share
* Refer to note 12, which defines how alternative performance measures are calculated.
Outlook for FY2026
We expect the market backdrop in the remainder of FY2026 to continue to be mixed, with ongoing strong demand across specific sectors and product lines offsetting more subdued conditions in general industrial markets. We built strong momentum through the first half of FY2026, with positive contributions from our emerging products, delivering growth in each segment and a significant further growth of our order book. Whilst we are mindful of ongoing economic and geopolitical uncertainties, our positive momentum has continued in the early part of Q3, and we are confident of achieving strong growth for the year as a whole.
Our second half is normally stronger than H1 and that pattern is likely to continue this year. We currently expect to deliver FY2026 full-year performance in the following ranges:
· Revenue: £740m to £780m
· Adjusted profit before tax*: £132m to £157m
About Renishaw
We are a world leading supplier of measuring and manufacturing systems. Our products give high accuracy and precision, gathering data to provide customers and end users with traceability and confidence in what they're making. This technology also helps our customers to innovate their products and processes. We are a global business, with customer-facing locations across our three sales regions; the Americas, EMEA, and APAC. Most of our R&D work takes place in the UK, with our largest manufacturing sites located in the UK, Ireland and India. Further information can be found at www.renishaw.com.
Results webcast
Will Lee, Chief Executive Officer, and Marc Saunders, Director of Group Strategic Development, will host a results presentation and Q&A session at 08:30 GMT today, which will be broadcast live via a webcast. Details of how to register for this webcast are available at: https://stream.brrmedia.co.uk/broadcast/6968c43021449c0013b7966c
A recording of the presentation and Q&A session will be made available by 12 February 2026 at: www.renishaw.com/investors.
Enquiries: [email protected]
Group operating performance review
Strong first half performance, carrying momentum into H2
We delivered strong revenue and profit growth combined with a substantially higher order intake in the first half of the 2026 financial year. Following steady sales in Q1, demand picked up notably in Q2, resulting in record quarterly revenue and a further significant strengthening of our order book. Against a backdrop of mixed market conditions and continuing uncertainty in the economic and geopolitical environment, we have achieved record revenue for a H1 period, and we enter H2 with momentum.
This performance has been underpinned by strong execution of our growth strategy, which targets high single-digit average through-cycle organic revenue growth. We pursue leading positions in a broad and expanding range of high-growth markets for our portfolio of sensor and software-enabled systems products. Our attractive markets are supported by four structural growth drivers: increasing precision of manufacturing processes, rising industrial automation to tackle skills shortages, electrification and digitalisation of industries, and decarbonisation of manufacturing. We aim to out-perform these markets by growing our established businesses, increasing the value of the technology we sell, and diversifying into close-adjacent markets. Our innovative technologies, global sales organisation and customer focus enables us to access diverse growth opportunities, benefitting from strong demand uplift in the semiconductor, defence and electrification sectors.
We have seen building momentum in demand for our established position encoder products in the first half of FY2026, as we see rising demand from existing accounts and as we continue to win new customers. A substantial proportion of our growth in this period has come from our emerging metrology and additive manufacturing systems and software, where we are gaining market share with innovative solutions. We are also seeing pleasing growth in some of our emerging sensor product lines, such as our enclosed optical and inductive position encoders, that allow us to address new markets.
Record H1 revenue
Segmental revenue (£m) | Q1 FY2026 | Q2 FY2026 | H1 FY2026 | H1 FY2025 | Growth | Constant FX growth |
Industrial Metrology | 102.0 | 110.1 | 212.1 | 203.3 | 4.3% | 8.8% |
Position Measurement | 52.1 | 58.4 | 110.5 | 102.9 | 7.4% | 11.9% |
Specialised Technologies | 16.7 | 26.3 | 43.0 | 35.2 | 22.2% | 25.9% |
Group | 170.8 | 194.8 | 365.6 | 341.4 | 7.1% | 11.5% |
Revenue increased by 7.1% to £365.6m (H1 FY2025: £341.4m) and was a record for the H1 period. Sales in Q2 were also a record for any quarter at £194.8m, 14.1% stronger than Q1. Growth was broadly based, with all three reporting segments delivering growth, and Specialised Technologies performing particularly strongly.
Regional revenue (£m) | Q1 FY2026 | Q2 FY2026 | H1 FY2026 | H1 FY2025 | Growth | Constant FX growth |
APAC | 84.4 | 93.6 | 178.0 | 161.4 | 10.3% | 16.9% |
EMEA | 42.6 | 54.4 | 97.0 | 102.3 | (5.2%) | (5.5%) |
Americas | 43.8 | 46.8 | 90.6 | 77.7 | 16.6% | 22.9% |
Group | 170.8 | 194.8 | 365.6 | 341.4 | 7.1% | 11.5% |
Regionally, the picture was more mixed, with strong growth in the Americas and APAC regions, whilst revenue in EMEA was below the prior year. Growth in the Americas was driven by strong demand for high-value capital equipment sales, including 5-axis co-ordinate measuring machines (CMMs) and additive manufacturing machines, whilst also benefitting from c. £5m (6%) in surcharges and price rises to offset new tariff duties. In APAC, we have seen rising demand for position encoders from semiconductor and electronics manufacturing equipment builders, as well as strong demand for Equator™ shop floor gauging systems from consumer electronics subcontract manufacturers. Market demand in EMEA has been softer than the other regions, but the order intake improved notably in Q2. H1 revenues in EMEA were impacted adversely by the transition to a new sales ERP system in some territories in September 2025, and whilst this resulted in some disruption to customer deliveries, activity levels increased substantially in Q2.
H1 revenue growth at constant currency for the Group was 11.5%, 4.4%pt higher than growth at actual exchange rates. This difference is partly a result of a stronger GBP against the USD, but mostly due to an £8.0m reduction in forward currency contract income compared to H1 FY2025. The prior period included significant gains from contracts that were struck at favourable rates following volatility in currency markets arising from the September 2022 UK 'mini Budget'.
Operating profit and costs
Adjusted operating profit for the period was £57.5m, 11.4% above the prior year. This amounts to 15.7% of revenue, a 0.6%pt improvement from 15.1% last year, and against our target of 20.0%. Adjusted operating profit at constant exchange rates* was 49.6% higher than the previous year.
Adjusted operating profit margin bridge
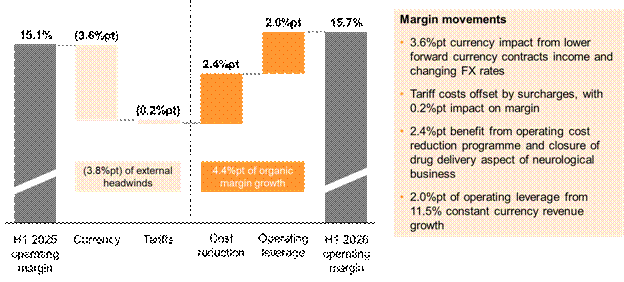
We have faced a total of 3.8%pt of margin headwinds from external factors. An £8.0m deficit in forward currency contract income combined with a £5.2m profit impact from adverse exchange rate movements to create a substantial 3.6%pt currency headwind. New US tariff costs of c. £5m were wholly offset by surcharges and pricing, with no impact on operating profit, but a small reduction in profit margin.
We achieved 4.4%pt of organic margin growth from a combination of fixed cost reduction, productivity initiatives and operating leverage.
Our operating cost reduction programme and restructuring of our neurological business have yielded a combined 2.4%pt of margin improvement in H1. Group headcount has reduced from 5,347 on 30 June to 4,975 on 31 December, resulting in c. £9m of cost savings during H1 FY2026, with ongoing annualised savings expected to be c. £23m p.a. as planned. This will be partially offset by the impact of our January 2026 pay review, which will result in c. £5m of higher pay in H2.
We have also benefited from 2.0%pt of operating leverage arising from our strong constant currency revenue growth in the period. This has generated higher gross profit, more than offsetting inflationary pressures affecting our operating costs such as higher pay, health insurance costs and employment taxes.
Gross margins excluding engineering costs were 58.8% compared to 61.5% in the prior year. This primarily reflects the impact of currency on our revenues, the impact of tariffs on both our revenues and our costs, as well as differing growth rates within our product portfolio and between regions.
We remain committed to our long-term strategy of developing innovative and patented products to create strong market positions. We have made numerous improvements to our R&D project prioritisation and delivery in recent years, supporting an increased rate of new product introduction. During the first six months of this financial year, our gross engineering spend, excluding adjusting items, was 8.5% lower at £50.8m (H1 FY2025: £55.5m). Total engineering costs included in the consolidated income statement were 12.1% of revenues.
Distribution expenses, excluding adjusting items, have increased by 6.6% to £72.8m (H1 FY2025: £68.3m), mostly because of higher pay and benefits. Administrative expenses, excluding adjusting items, were 2.3% higher at £40.4m (H1 FY2025: £39.5m). These include continuing third-party support and maintenance costs in relation to our ongoing IT transformation, which will lead to productivity benefits in future years.
Segmental operating performance review
Segment performance summary
H1 FY2026 | H1 FY2025 | Change | |||||||||
All figures in £m at actual exchange rates | Revenue | Adjusted operating profit | Adjusted operating profit margin | Revenue | Adjusted operating profit | Adjusted operating profit margin | Revenue | Adjusted operating profit | Adjusted operating profit margin | ||
Industrial Metrology | 212.1 | 32.2 | 15.2% | 203.3 | 31.0 | 15.3% | 4.3% | 3.9% | (0.1%pt) | ||
Position Measurement | 110.5 | 25.9 | 23.4% | 102.9 | 28.5 | 27.7% | 7.4% | (9.1%) | (4.3%pt) | ||
Specialised Technologies | 43.0 | (0.6) | (1.4%) | 35.2 | (7.9) | (22.4%) | 22.2% | N/A | 21.0%pt | ||
Group | 365.6 | 57.5 | 15.7% | 341.4 | 51.6 | 15.1% | 7.1% | 11.4% | 0.6%pt | ||
All three reporting segments delivered revenue growth in H1, with a particularly strong improvement in performance for Specialised Technologies which has posted substantially reduced losses. Currency headwinds and changing product and customer mix were key factors in lower operating profit in the Industrial Metrology and Position Measurement segments. Refer to note 2 for more details of segmental performance.
Industrial Metrology
Revenue for Industrial Metrology (IM) products increased by 4.3% to £212.1m at actual exchange rates (H1 FY2025: £203.3m) and was 8.8% higher at constant exchange rates.
Our emerging metrology systems and software product lines have delivered strong year-on-year revenue growth in the first half as well as a growing order book. We continue to see improving demand for 5-axis AGILITY® CMMs in the Americas, whilst sales of shop floor gauging systems into the consumer electronics sector in APAC have also increased significantly. Our new Equator-X™ dual-method gauge and our easy-to-use MODUS™ IM Equator software were positively received at their recent launch, and we are scaling up our production capacity to meet initial demand.
Meanwhile, the established machine calibration product line also delivered strong year-on-year growth in H1 against a weaker period in the previous year, boosted by improving demand from semiconductor manufacturing equipment builders. We introduced our new XK20 alignment laser system and accompanying CARTO XK20 app in H1, targeted at builders of large and complex machine tools.
By contrast, sales of CMM and machine tool sensors were flat. We saw improving demand from consumer electronics subcontract manufacturers in APAC, but this was offset by continued weakness in EMEA, where demand from machine tool and CMM builders supplying the automotive sector remains subdued. We continue to innovate here, with our third-generation NC4+ Blue laser tool setter enabling detection of minute defects in cutting tools, ensuring good surface finish and enhancing overall part quality, with lower running costs.
Adjusted operating profit for the Industrial Metrology segment was 3.9% higher at £32.2m in H1, resulting in an adjusted operating margin that was 0.1%pt lower at 15.2%. Currency headwinds were largely offset by a combination of cost reductions and positive operating leverage.
Position Measurement
Revenue for Position Measurement (PM) products increased by 7.4% to £110.5m at actual exchange rates (H1 FY2025: £102.9m) and was up 11.9% at constant exchange rates.
We delivered strong sales growth from our established open optical and magnetic position encoder product lines, as well as a significant increase in their order books. We are seeing building momentum, particularly from the semiconductor and electronics manufacturing equipment sector, and we expect to achieve strong revenue growth in these product lines in the remainder of the year.
Meanwhile, sales of laser encoders, which are primarily used in semiconductor wafer inspection applications, were lower than an abnormally strong comparative period last year. However, the order book strengthened, and we remain confident about the growth prospects for this product line following the introduction of new high-performance variants at the end of FY2025.
We are also seeing high rates of growth for our emerging FORTiS™ enclosed optical encoders as we continue to win new customers. Whilst enclosed encoders are primarily sold to machine tool builders and demand for machine tools remains subdued, we are finding new applications in other types of manufacturing equipment. Following the recent launch of our ASTRiA™ inductive encoder product line, we are working closely with key prospects, including various defence sector applications.
Adjusted operating profit for the Position Measurement segment in H1 was 9.1% lower at £25.9m, resulting in an adjusted operating margin that was 4.3%pt lower at 23.4%. Like the IM segment, PM faced significant currency headwinds, which were partially offset by cost reduction activities. However, a change in product mix versus the comparable period last year, with lower sales of laser encoders and higher demand for magnetic encoders, drove operating margins lower. It should be noted that the margin achieved in H1 FY2026 is higher than the 22.5% margin achieved in FY2025 as a whole.
Specialised Technologies
Revenue for Specialised Technologies (ST) products increased by 22.2% to £43.0m at actual exchange rates (H1 FY2025: £35.2m) and grew by 25.9% at constant exchange rates.
Additive manufacturing (AM) products were the key driver of this performance improvement. Sales of metal AM systems in H1 were significantly higher than the prior year, whilst orders were stronger still, resulting in a growing order book. Demand was particularly strong from the defence sector in both the EMEA and the Americas regions. During H1, we introduced further productivity enhancements to our market-leading RenAM 500 series machines, including new software that enables printing of complex geometries with minimal supports, as well as a long-life filter to maximise machine uptime.
Demand for spectroscopy systems was weaker in H1, with gains in the Americas being more than offset by lower sales in APAC and EMEA. A key development in the period was the introduction of our new Strada® intelligent Raman microscope, which will start shipping to early-adopter customers in H2, and which will form the mainstay of our spectroscopy product line in the years ahead. The Strada microscope combines the sensitivity of research-grade Raman microscopes with our new intuitive, user-friendly Raman Workspace software, making advanced chemical analysis accessible to both industrial and multi-user laboratories.
Closure of the loss-making drug delivery aspect of our neurological business was concluded in H1, and we are now investigating opportunities to exit the remaining neurosurgery business.
Adjusted operating profit for the Specialised Technologies segment in H1 grew by £7.3m, resulting in a loss of £0.6m (H1 FY2025: £7.9m loss), with adjusted operating profit margin improving by 21.0%pt to -1.4%. ST experienced a proportionately lower currency impact than the other segments due to its different regional sales footprint, whilst also benefitting from neurological restructuring in addition to the companywide cost reduction programme. However, the primary driver of the substantial improvement in operating margin was operating leverage, especially in the AM product line.
Group performance overview
Profit and tax
Financial income less expenses for the period, excluding adjusting items, was £5.0m compared with £4.1m last year. Whilst interest on bank deposits reduced by £1.0m, we have experienced £0.4m of currency gains (H1 FY2025: £1.7m loss) on intragroup financing balances and mitigating forward currency swap contracts. The share of profits of joint ventures was £1.5m this year, compared to £1.8m in the prior year.
The resulting adjusted profit before tax for the period was £64.1m (17.5% of revenue) compared with £57.5m (16.8% of revenue) last financial year.
Statutory profit before tax was 20.0% lower at £46.0m (H1 FY2025: £57.5m), including total costs of £18.0m relating to cost reduction, closure of drug delivery business, loss of office payment, and interest payable on historical and non-recurring tax matters, which have been excluded from adjusted profit.
The income tax expense in the consolidated income statement has been estimated at a rate of 21.1% (H1 FY2025: 20.1%) and is based on management's best estimate of the full year effective tax rates by geographical unit applied to half-year profits. The effective tax rate on adjusted profit before tax in H1 was 21.8%.
Adjusted earnings per share* were 68.8p, compared with 63.2p last year.
Return on invested capital
We measure return on invested capital (ROIC) to assess our efficiency in allocating capital to profitable investments. In H1 FY2026, ROIC increased by 0.6%pt to 13.2% (H1 FY2025: 12.6%), compared to our target of 15%. Adjusted profit after tax before interest received over the last twelve-month period increased to £96.4m (H1 FY2025: £89.9m), whilst average invested capital was 2.4% higher at £732.2m. See Note 12 for more details.
Cash flow
Our adjusted cash flow conversion from operating activities, which excludes cash outflows in H1 for restructuring activities that are also excluded from adjusted operating profit, was 68% in this period (H1 FY2025: 100%), slightly below our target of 70%.
Net movements in working capital were adverse in H1. Our trade receivables have fallen slightly to £126.1m, compared to £128.5m on 30 June 2025. In response to rising order intake, we have stepped up our manufacturing output to support planned revenue growth in H2, resulting in a £5.4m increase in inventories to £164.9m, whilst trade and other payables have decreased by £4.0m.
In H1, additions of property, plant and equipment (PP&E) amounted to £17.3m (H1 FY2025: £23.4m), with the focus primarily on plant and equipment to boost capacity and productivity, and we expect to spend a total of around £40m on PP&E additions during FY2026 as a whole.
Cash and cash equivalents and bank deposit balances on 31 December 2025 were £240.9m, compared with £273.6m on 30 June 2025. This reflects cash flows from operating activities of £31.0m including £14.6m for the cash effect of restructuring expenses and £15.2m taxes paid, less net investment in property, plant and equipment and intangibles of £21.5m and the final dividend payment of £44.6m in respect of FY2025.
Dividend
The Board has approved an interim dividend of 16.8p net per share (H1 FY2025: 16.8p), which will be paid on 7 April 2026 to shareholders on the register on 6 March 2026.
Principal risks and uncertainties
Whilst geopolitical uncertainty remains at heightened levels as demonstrated by changes to trade tariffs,
the Board considers that the principal risks and uncertainties as set out on pages 19 to 23 of the
2025 Annual Report remain valid for the second half of financial year 2026. This determination takes
into account the mitigations undertaken by the Group in respect of the principal risks. The principal
risks are geopolitical uncertainty, low price competition, product innovation, industry fluctuations,
non-compliance with laws and regulations, capital products growth, cyber, exchange rates, IT
transformation, and people.
Sustainability
We continue to make good progress towards our target of Net Zero for Scopes 1 and 2 emissions by 2028. During the period, we have started work on converting end-of-life heating systems at our manufacturing facility in Miskin, UK, from oil to a lower-carbon alternative. We are also focused on reducing our Scope 3 emissions. This includes working with key suppliers to reduce the carbon impact of the materials that we use to make our products, by optimising recycling and / or renewable energy use in their production. We are also making improvements to the energy efficiency of our products, including reduced consumption of compressed air in our new NC4+ Blue laser tool setter.
We also continue to see significant commercial opportunities arising from the drive towards sustainable business practices. Our products help our customers to meet their sustainability targets by increasing their manufacturing efficiencies through lower energy consumption and waste, and by improving the performance of the products they supply to their own customers.
Directors and employees
The Directors would like to thank our employees for continuing to drive us forward towards our vision to innovate and transform the capabilities of our customers.
Camille Deer, granddaughter of our co-founder John Deer, joined the Board as a Non-executive Director in September 2025.
The Renishaw Board is working to appoint a Chief Financial Officer following Allen Roberts' retirement in December 2025. Rob Macdonald, an experienced member of the Renishaw finance team, has been appointed as Interim Group Finance Director whilst this process proceeds.
The Renishaw Board is also working to appoint an independent Non-executive Chair, as well as recruitment of an additional independent Non-executive Director with experience in our markets.
Founder family shareholdings
On 25 November 2025 the families of our founders, the late Sir David McMurtry and current Non-executive Director, John Deer, established a joint family holding company, Deltam Holdings Limited ('Deltam'), which holds 50.25% of the issued share capital of Renishaw. Establishing Deltam facilitates a generational transfer of the business within the families, reaffirming their commitment to Renishaw and their intention to be long term shareholders in the Company.
Outlook
The Board remains confident in our growth model, built on solving customer problems with innovative products, global service and world-class in-house manufacturing. Whilst we operate in cyclical markets, we aim for high single-digit average organic growth rates through the cycle, to improve our operating profit margins to above 20%, to achieve strong returns on invested capital, and to generate strong free cash flow.
We expect the market backdrop in the remainder of FY2026 to continue to be mixed, with ongoing strong demand across specific sectors and product lines offsetting more subdued conditions in general industrial markets. We built strong momentum through the first half of FY2026, with positive contributions from our emerging products, delivering growth in each segment and a significant further growth of our order book. Whilst we are mindful of ongoing economic and geopolitical uncertainties, our positive momentum has continued in the early part of Q3, and we are confident of achieving strong growth for the year as a whole.
Our second half is normally stronger than H1 and that pattern is likely to continue this year. We currently expect to deliver FY2026 full-year performance in the following ranges:
· Revenue: £740m to £780m
· Adjusted profit before tax*: £132m to £157m
Will Lee |
|
Chief Executive Officer 10th February 2026 |
Consolidated income statement
6 months to 31 December 2025 (Unaudited) | 6 months to 31 December 2024 (Unaudited) | Year ended 30 June 2025 (Audited) | ||||||||
from continuing operations |
Notes
|
Adjusted total £'000 |
Adjusting items £'000 |
Statutory total £'000 | Adjusted total (restated) £'000 | Adjusting items (restated) £'000 | Statutory total (restated) £'000 |
Adjusted total £'000 |
Adjusting items £'000 |
Statutory total £'000 |
Revenue | 2 | 365,616 | - | 365,616 | 341,402 | - | 341,402 | 713,044 | - | 713,044 |
Cost of sales | 3 | (194,887) | (9,668) | (204,555) | (182,060) | - | (182,060) | (379,650) | (4,379) | (384,029) |
Gross profit | 170,729 | (9,668) | 161,061 | 159,342 | - | 159,342 | 333,394 | (4,379) | 329,015 | |
Distribution costs | (72,795) | (2,981) | (75,776) | (68,276) | - | (68,276) | (144,031) | - | (144,031) | |
Administrative expenses | (40,398) | (4,825) | (45,223) | (39,506) | - | (39,506) | (77,099) | - | (77,099) | |
Operating profit | 57,536 | (17,474) | 40,062 | 51,560 | - | 51,560 | 112,264 | (4,379) | 107,885 | |
Financial income | 4 | 6,373 | - | 6,373 | 6,339 | - | 6,339 | 16,517 | - | 16,517 |
Financial expenses | 4 | (1,354) | (575) | (1,929) | (2,221) | - | (2,221) | (5,088) | (4,852) | (9,940) |
Share of profits from joint ventures | 1,526 | - | 1,526 | 1,806 | - | 1,806 | 3,538 | - | 3,538 | |
Profit before tax | 64,081 | (18,049) | 46,032 | 57,484 | - | 57,484 | 127,231 | (9,231) | 118,000 | |
Income tax expense | 5 | (13,970) | 4,257 | (9,713) | (11,555) | - | (11,555) | (27,010) | (7,233) | (34,243) |
Profit for the period | 50,111 | (13,792) | 36,319 | 45,929 | - | 45,929 | 100,221 | (16,464) | 83,757 | |
Profit attributable to: | ||||||||||
Equity shareholders of the parent company | 36,319 | 45,929 | 83,757 | |||||||
Non-controlling interest | - | - | - | |||||||
Profit for the period | 36,319 | 45,929 | 83,757 | |||||||
Pence | Pence | Pence | Pence | Pence | Pence | Pence | Pence | Pence | ||
Dividend per share arising in respect of the period | 7 | 16.8 | 16.8 | 78.1 | ||||||
Earnings per share (basic and diluted) | 6 | 68.8 | (18.9) | 49.9 | 63.2 | - | 63.2 | 137.8 | (22.6) | 115.2 |
Consolidated statement of comprehensive income and expense
| ||||||||||
6 months to 31 December 2025 (Unaudited) | 6 months to 31 December 2024 (Unaudited) | Year ended 30 June 2025 (Audited) |
| |||||||
|
Adjusted total £'000
|
Adjusting items £'000
|
Statutory total £'000
| Adjusted total (restated) £'000
| Adjusting items (restated) £'000
| Statutory total (restated) £'000
|
Adjusted total £'000
|
Adjusting items £'000
|
Statutory total £'000
|
|
Profit for the period | 50,111 | (13,792) | 36,319 | 45,929 | - | 45,929 | 100,221 | (16,464) | 83,757 |
|
|
|
|
| |||||||
Other items recognised directly in equity: |
|
|
|
| ||||||
|
|
|
|
| ||||||
Items that will not be reclassified to the Consolidated income statement: |
|
|
|
| ||||||
Remeasurement of defined benefit pension scheme assets / liabilities / reimbursement right | 1,398 | - | 1,398 | (299) | - | (299) | 2,777 | - | 2,777 |
|
Deferred tax on remeasurement of defined benefit pension scheme assets / liabilities / reimbursement right | (263) | - | (263) | 318 | - | 318 | (374) | - | (374) |
|
|
|
|
| |||||||
Total for items that will not be reclassified | 1,135 | - | 1,135 | 19 | - | 19 | 2,403 | - | 2,403 |
|
|
|
|
|
| ||||||
Items that may be reclassified to the Consolidated income statement: |
|
|
|
| ||||||
Exchange differences in translation of overseas operations | 378 | - | 378 | (1,864) | - | (1,864) | (6,295) | - | (6,295) |
|
Exchange differences in translation of overseas joint venture | 384 | - | 384 | (528) | - | (528) | 169 | - | 169 |
|
Effective portion of changes in fair value of cash flow hedges, net of recycling | (7,586) | - | (7,586) | (11,188) | - | (11,188) | 5,804 | - | 5,804 |
|
Deferred tax on effective portion of changes in fair value of cash flow hedges | 2,003 | - | 2,003 | 2,839 | - | 2,839 | (1,451) | - | (1,451) |
|
|
|
|
| |||||||
Total for items that may be reclassified | (4,821) | - | (4,821) | (10,741) | - | (10,741) | (1,773) | - | (1,773) |
|
|
|
|
| |||||||
Total other comprehensive income and expense, net of tax | (3,686) | - | (3,686) | (10,722) | - | (10,722) | 630 | - | 630 |
|
|
|
|
| |||||||
Total comprehensive income and expense for the period | 46,425 | (13,792) | 32,633 | 35,207 | - | 35,207 | 100,851 | (16,464) | 84,387 |
|
|
| |||||||||
Attributable to: |
| |||||||||
Equity shareholders of the parent company | 32,633 | 35,207 | 84,387 |
| ||||||
Non-controlling interest | - | - | - |
| ||||||
| ||||||||||
Total comprehensive income and expense for the period | 32,633 | 35,207 | 84,387 |
| ||||||
'Remeasurement of defined benefit pension scheme assets / liabilities / reimbursement right' and 'Deferred tax on remeasurement of defined benefit pension scheme assets / liabilities / reimbursement right' have been restated in the comparative information. See Note 1 for further details.
Consolidated balance sheet
Notes |
At 31 December 2025 (Unaudited) £'000 | At 31 December 2024 (Unaudited) (Restated) £'000 |
At 30 June 2025 (Audited) £'000 | |
Assets | ||||
Property, plant and equipment | 8 | 343,155 | 334,997 | 338,287 |
Right-of-use assets | 11,695 | 13,773 | 12,218 | |
Investment properties | 11,424 | 10,076 | 11,566 | |
Intangible assets | 9 | 52,963 | 49,224 | 50,550 |
Investments in joint ventures | 28,645 | 26,089 | 27,692 | |
Finance lease receivables |
| 11,964 | 14,430 | 11,950 |
Employee benefits | 11 | 12,105 | 11,410 | 11,443 |
Reimbursement right | 11 | 14,632 | 12,584 | 12,909 |
Deferred tax assets |
| 21,883 | 20,637 | 22,432 |
Derivatives | 10 | 4,667 | 2,052 | 7,878 |
Total non-current assets | 513,133 | 495,272 | 506,925 | |
Current assets | ||||
Inventories | 164,892 | 157,758 | 159,465 | |
Trade receivables | 10 | 126,118 | 112,616 | 128,464 |
Finance lease receivables | 4,790 | 3,382 | 5,195 | |
Current tax | 7,647 | 8,123 | 6,453 | |
Other receivables | 45,046 | 43,756 | 40,732 | |
Derivatives | 10 | 10,207 | 5,412 | 14,345 |
Bank deposits | 162,870 | 143,000 | 186,226 | |
Cash and cash equivalents | 78,011 | 90,161 | 87,420 | |
Total current assets | 599,581 | 564,208 | 628,300 | |
Current liabilities | ||||
Trade payables | 28,765 | 23,544 | 25,943 | |
Contract liabilities | 13,586 | 13,806 | 14,669 | |
Current tax | 6,984 | 2,662 | 11,303 | |
Provisions | 9,805 | 3,963 | 8,978 | |
Derivatives | 10 | 554 | 2,385 | 150 |
Lease liabilities | 4,349 | 3,915 | 3,992 | |
Amounts owed to joint ventures | 13 | 16,087 | 11,570 | 14,530 |
Borrowings | 682 | 773 | 764 | |
Other payables | 50,307 | 40,059 | 57,132 | |
Total current liabilities | 131,119 | 102,677 | 137,461 | |
Net current assets | 468,462 | 461,531 | 490,839 | |
Non-current liabilities | ||||
Lease liabilities | 7,946 | 10,313 | 8,769 | |
Borrowings | 1,683 | 2,491 | 2,120 | |
Employee benefits | 11 | 21,311 | 22,848 | 21,131 |
Deferred tax liabilities | 36,645 | 30,106 | 38,784 | |
Derivatives | 10 | 827 | 2,520 | 1,096 |
Total non-current liabilities | 68,412 | 68,278 | 71,900 | |
Total assets less total liabilities | 913,183 | 888,525 | 925,864 | |
Equity | ||||
Share capital | 14,558 | 14,558 | 14,558 | |
Share premium | 42 | 42 | 42 | |
Own shares held | (1,136) | (2,367) | (2,140) | |
Currency translation reserve | (2,884) | 88 | (3,646) | |
Cash flow hedging reserve | 9,681 | 2,562 | 15,264 | |
Retained earnings | 894,005 | 873,177 | 901,170 | |
Other reserve | (506) | 1,042 | 1,193 | |
Equity attributable to the shareholders of the parent company | 913,760 | 889,102 | 926,441 | |
Non-controlling interest | (577) | (577) | (577) | |
Total equity | 913,183 | 888,525 | 925,864 |
Reimbursement right, Employee benefits, Deferred tax assets and retained earnings have been restated in the comparative information. See Note 1 for further details.
Consolidated statement of changes in equity
Unaudited |
Share capital £'000 |
Share premium £'000
|
Own shares held £'000 |
Currency translation reserve £'000 | Cash flow hedging reserve £'000
|
Retained earnings £'000 |
Other reserve £'000 |
Non- controlling interest £'000
|
Total £'000
|
Balance at 1 July 2024 (restated) | 14,558 | 42 | (2,963) | 2,480 | 10,911 | 870,434 | 1,380 | (577) | 896,265 |
Profit for the period | - | - | - | - | - | 45,929 | - | - | 45,929 |
Other comprehensive income and expense (net of tax) | |||||||||
Remeasurement of defined benefit pension assets / liabilities / reimbursement right | - | - | - | - | - | 19 | - | - | 19 |
Foreign exchange translation differences | - | - | - | (1,864) | - | - | - | - | (1,864) |
Relating to joint ventures | - | - | - | (528) | - | - | - | - | (528) |
Changes in fair value of cash flow hedges | - | - | - | - | (8,349) | - | - | - | (8,349) |
Total other comprehensive income and expense | - | - | - | (2,392) | (8,349) | 19 | - | - | (10,722) |
Total comprehensive income and expense | - | - | - | (2,392) | (8,349) | 45,948 | - | - | 35,207 |
Transactions with owners recorded in equity | |||||||||
Share-based payments charge | - | - | - | - | - | - | 412 | - | 412 |
Distribution of own shares | - | - | 750 | - | - | - | (750) | - | - |
Own shares purchased | - | - | (154) | - | - | - | - | - | (154) |
Dividends paid | - | - | - | - | - | (43,205) | - | - | (43,205) |
Balance at 31 December 2024 (restated) | 14,558 | 42 | (2,367) | 88 | 2,562 | 873,177 | 1,042 | (577) | 888,525 |
Profit for the period | - | - | - | - | - | 37,828 | - | - | 37,828 |
Other comprehensive income and expense (net of tax) | |||||||||
Remeasurement of defined benefit pension assets / liabilities / reimbursement right | - | - | - | - | - | 2,384 | - | - | 2,384 |
Foreign exchange translation differences | - | - | - | (4,431) | - | - | - | - | (4,431) |
Relating to joint ventures | - | - | - | 697 | - | - | - | - | 697 |
Changes in fair value of cash flow hedges | - | - | - | - | 12,702 | - | - | - | 12,702 |
Total other comprehensive income and expense | - | - | - | (3,734) | 12,702 | 2,384 | - | - | 11,352 |
Total comprehensive income and expense | - | - | - | (3,734) | 12,702 | 40,212 | - | - | 49,180 |
Transactions with owners recorded in equity | |||||||||
Share-based payments charge | - | - | - | - | - | - | 378 | - | 378 |
Distribution of own shares | - | - | 227 | - | - | - | (227) | - | - |
Own shares purchased | - | - | - | - | - | - | - | - | - |
Dividends paid | - | - | - | - | - | (12,219) | - | - | (12,219) |
Balance at 30 June 2025 | 14,558 | 42 | (2,140) | (3,646) | 15,264 | 901,170 | 1,193 | (577) | 925,864 |
|
|
|
|
|
|
|
|
| |
Profit for the period | - | - | - | - | - | 36,319 | - | - | 36,319 |
Other comprehensive income and expense (net of tax) | |||||||||
Remeasurement of defined benefit pension assets / liabilities / reimbursement right | - | - | - | - | - | 1,135 | - | - | 1,135 |
Foreign exchange translation differences | - | - | - | 378 | - | - | - | - | 378 |
Relating to joint ventures | - | - | - | 384 | - | - | - | - | 384 |
Changes in fair value of cash flow hedges | - | - | - | - | (5,583) | - | - | - | (5,583) |
Total other comprehensive income and expense | - | - | - | 762 | (5,583) | 1,135 | - | - | (3,686) |
Total comprehensive income and expense | - | - | - | 762 | (5,583) | 37,454 | - | - | 32,633 |
Transactions with owners recorded in equity | |||||||||
Share-based payments charge | - | - | - | - | - | - | 287 | - | 287 |
Distribution of own shares | - | - | 1,986 | - | - | - | (1,986) | - | - |
Purchase of own shares | - | - | (982) | - | - | - | - | - | (982) |
Dividends paid | - | - | - | - | - | (44,619) | - | - | (44,619) |
Balance at 31 December 2025 | 14,558 | 42 | (1,136) | (2,884) | 9,681 | 894,005 | (506) | (577) | 913,183 |
'Remeasurement of defined benefit pension scheme assets / liabilities / reimbursement right' have been restated in the comparative information. See Note 1 for further information.
Consolidated statement of cash flow
6 months to 31 December 2025 (Unaudited) £'000 | 6 months to 31 December 2024 (Unaudited) £'000 | Year ended 30 June 2025 (Audited) £'000 | |
Cash flows from operating activities | |||
Profit for the period | 36,319 | 45,929 | 83,757 |
Adjustments for: |
| ||
Depreciation and impairment of property, plant and equipment, right-of-use assets, and investment properties | 14,313 | 12,278 | 29,057 |
Profit on sale of property, plant and equipment | (59) | (1,005) | (1,083) |
Amortisation and impairment of intangible assets | 2,094 | 2,394 | 6,689 |
Loss on disposal of intangible asset | 916 | - | - |
Share of profits from joint ventures | (1,526) | (1,806) | (3,538) |
Defined benefit pension scheme past service and administrative costs | 775 | 494 | 1,833 |
Financial income | (6,373) | (6,339) | (16,517) |
Financial expenses | 1,929 | 2,221 | 9,940 |
Share-based payment expense | 287 | 412 | 790 |
Tax expense | 9,713 | 11,555 | 34,243 |
22,069 | 20,204 | 61,414 | |
(Increase)/decrease in inventories | (5,427) | 4,170 | 2,463 |
(Increase)/decrease in trade and other receivables | (158) | 8,337 | (11,025) |
(Decrease)/increase in trade and other payables | (6,143) | (5,101) | 16,527 |
Increase in provisions | 252 | 966 | 1,129 |
(11,476) | 8,372 | 9,094 | |
Defined benefit pension scheme contributions | (764) | (79) | (162) |
Income taxes (paid)/received | (15,178) | 1,815 | (6,207) |
Cash flows from operating activities | 30,970 | 76,241 | 147,896 |
|
| ||
Investing activities |
|
| |
Purchase of property, plant and equipment, and investment properties | (17,305) | (23,352) | (46,273) |
Sale of property, plant and equipment | 1,023 | 2,814 | 4,887 |
Development costs capitalised | (5,176) | (4,079) | (9,999) |
Purchase of other intangibles | (47) | (226) | (286) |
Decrease/(increase) in bank deposits | 23,356 | (47,458) | (90,684) |
Interest received | 4,988 | 6,091 | 12,216 |
Dividend received from joint venture | 957 | 674 | 1,500 |
Cash flows from investing activities | 7,796 | (65,536) | (128,639) |
|
| ||
Financing activities |
|
|
|
Repayment of borrowings | (375) | (390) | (794) |
Amounts received as deposit from joint venture | 1,304 | 3,361 | 5,983 |
Interest paid | (453) | (491) | (1,140) |
Repayment of principal of lease liabilities | (2,348) | (2,069) | (4,284) |
Own shares purchased | (982) | (154) | (154) |
Dividends paid | (44,619) | (43,205) | (55,424) |
Cash flows from financing activities | (47,473) | (42,948) | (55,813) |
|
| ||
Net decrease in cash and cash equivalents | (8,707) | (32,243) | (36,556) |
Cash and cash equivalents at the beginning of the period | 87,420 | 122,293 | 122,293 |
Effect of exchange rate fluctuations on cash held | (702) | 111 | 1,683 |
Cash and cash equivalents at the end of the period | 78,011 | 90,161 | 87,420 |
Cash and cash equivalents and bank deposits at 31 December 2025 were £240.9m (30 June 2025: £273.6m).
Notes
1. Basis of preparation
The Interim report, which includes the condensed consolidated financial statements for the six months ended 31 December 2025, was approved by the Directors on 10 February 2026.
The condensed consolidated financial statements for the six months ended 31 December 2025 were prepared in accordance with International Accounting Standard 34 'Interim Financial Reporting' (IAS 34) as issued by the International Accounting Standards Board and as adopted by the UK. These apply the same accounting policies, presentation and methods of calculation as were applied in the preparation of the Group's consolidated financial statements for the year ended 30 June 2025, except for income taxes which are accrued using the forecast tax rate for the financial year.
The condensed consolidated financial statements included in this Report have not been audited and do not constitute the Group's statutory accounts as defined in section 434 of the Companies Act 2006. The information relating to the year ended 30 June 2025 is an extract from the Group's published Annual Report for that year, which has been delivered to the Registrar of Companies, and on which the auditor's report was unqualified and did not contain any emphasis of matter or statements under section 498(2) or 498(3) of the Companies Act 2006.
Foreign currencies
The Group's financial results are principally exposed to US dollar, Euro, Chinese renminbi and Japanese yen exchange rates, which are detailed in the table below:
31 December 2025 | 31 December 2024 | 30 June 2025 | ||||
Closing rate | Average rate | Closing rate | Average rate | Closing rate | Average rate | |
US dollar | 1.35 | 1.33 | 1.25 | 1.29 | 1.37 | 1.30 |
Euro | 1.15 | 1.15 | 1.21 | 1.20 | 1.17 | 1.19 |
Chinese renminbi | 9.40 | 9.47 | 9.20 | 9.27 | 9.80 | 9.35 |
Japanese yen | 211 | 202 | 197 | 194 | 198 | 193 |
Prior year restatement
As explained in the FY2025 Annual Report, an error was identified with the Group's classification of a German pension scheme as a defined contribution scheme, as opposed to a defined benefit scheme, following a request for funding from the pension scheme support fund. In line with IAS 8, the Group has restated balances at 1 July 2024 and 31 December 2024 for the purpose of the interim report.
The impact on the financial statements at 1 July 2024 was the recognition of a non-current liability employee benefit of £21,349,000 and a reimbursement right asset of £12,116,000. A corresponding net deferred tax asset of £2,677,000 has also been recognised. The net effect was a reduction in retained earnings of £6,556,000. This balance sheet was presented in the 30 June 2025 Annual Report and is not presented in the interim report.
At 31 December 2024, the closing non-current liability employee benefit and reimbursement right asset were £22,848,000 and £12,584,000 respectively. A corresponding net deferred tax asset of £3,079,000 has also been recognised. The total adjustment recognised through the Consolidated statement of comprehensive income and expense related to the 'Remeasurement of defined benefit pension scheme assets / liabilities / reimbursement right' and 'Deferred tax on remeasurement of defined benefit pension scheme assets / liabilities / reimbursement right' was a loss of £1,031,000 and a gain of £402,000 respectively.
31 December 2024 | 30 June 2024 | |||||
Reported £'000 | Adjustment £'000 | Restated £'000 | Reported £'000 | Adjustment £'000 | Restated £'000 | |
Assets | ||||||
Reimbursement right | - | 12,584 | 12,584 | - | 12,116 | 12,116 |
Deferred tax asset | 17,558 | 3,079 | 20,637 | 17,690 | 2,677 | 20,367 |
Non-current liabilities | ||||||
Employee benefits | - | (22,848) | (22,848) | - | (21,349) | (21,349) |
Equity | ||||||
Retained earnings | 880,362 | (7,185) | 873,177 | 876,990 | (6,556) | 870,434 |
Going concern
The Directors have prepared the unaudited interim financial information on a going concern basis. In considering the going concern basis, the Directors have considered the previously mentioned principal risks and uncertainties, as well as the Group's current trading performance and updated cashflow forecasts. The Directors have also considered the financial resources available to the Group, with net current assets of £468.5m at 31 December 2025 (compared to £490.8m at 30 June 2025), including £240.9m cash and cash equivalents and bank deposits at 31 December 2025.
We have updated our reverse stress testing to identify what would need to happen in the period to 28 February 2027 for the Group to deplete its cash and cash equivalents and bank deposit balances. This identified a trading level so low (significantly below FY2025 revenue) that the Directors feel that the events that could trigger this would be remote. The Directors also concluded that a one-off cash outflow that would exhaust the Group's cash and cash equivalents and bank deposit balances in the assessment period was also remote.
Based on this assessment, the Directors have a reasonable expectation that the Group will be able to continue in operation and meet its liabilities as they fall due over the period to 28 February 2027.
2. Revenue disaggregation and segmental analysis
As previously announced, the Group has introduced three new reporting segments in FY2026, which have replaced the Manufacturing technologies and Analytical instruments and medical devices segments. The new segments group together product lines with similar end-user markets, which more closely align segmental performance with external market data and demand drivers. They are also aligned to our evolving organisation structure. Our new reporting segments are Industrial Metrology, Position Measurement and Specialised Technologies. More details of the Group's products and services are given in the New reporting segments for FY2026 RNS which was published on 23 September 2025.
In normal trading conditions, although future revenue is difficult to predict given that the Group's outstanding order book is typically less than three months' worth of revenue value, larger consumer electronics orders in the APAC region within the Industrial Metrology segment typically fall in the first or last quarter of the financial year. In addition, the Group typically experiences lower demand in August and December, and so revenue and operating profits are typically lower in the first half of the year. This information is provided to allow for a better understanding of the results, and management do not believe that the business is 'highly seasonal' in accordance with IAS 34.
| Industrial Metrology | Position Measurement | Specialised Technologies | Total |
6 months to 31 December 2025 | £'000 | £'000 | £'000 | £'000 |
Revenue | 212,071 | 110,487 | 43,058 | 365,616 |
Depreciation, amortisation and impairment | 10,742 | 4,119 | 1,546 | 16,407 |
Statutory operating profit | 21,907 | 21,648 | (3,493) | 40,062 |
Cost reduction programme | 9,086 | 3,830 | 1,912 | 14,828 |
Loss of office payable to Executive Director | 1,271 | 411 | 298 | 1,980 |
Closure of drug delivery business | - | - | 666 | 666 |
Adjusted operating profit | 32,264 | 25,889 | (617) | 57,536 |
Share of profits from joint ventures | 243 | 1,283 | - | 1,526 |
Net financial income | - | - | - | 5,019 |
Adjusted profit before tax |
|
|
| 64,081 |
|
|
|
| |
6 months to 31 December 2024 |
| |||
Revenue | 203,295 | 102,874 | 35,233 | 341,402 |
Depreciation, amortisation and impairment | 9,676 | 2,544 | 2,452 | 14,672 |
Statutory operating profit | 30,969 | 28,470 | (7,879) | 51,560 |
Share of profits from joint ventures | 278 | 1,528 | - | 1,806 |
Net financial income/(expense) | - | - | - | 4,118 |
Profit before tax | - | - | - | 57,484 |
Year ended 30 June 2025 | ||||
Revenue | 430,565 | 207,430 | 75,049 | 713,044 |
Depreciation, amortisation and impairment | 22,768 | 8,219 | 4,759 | 35,746 |
Statutory operating profit | 74,130 | 46,010 | (12,255) | 107,885 |
Closure of drug delivery business | - | - | 2,059 | 2,059 |
Closure of Edinburgh research facility | 1,378 | 618 | 324 | 2,320 |
Adjusted operating profit | 75,508 | 46,628 | (9,872) | 112,264 |
Share of profits from joint ventures | 488 | 3,050 | - | 3,538 |
Net financial income/(expense) | - | - | - | 11,429 |
Adjusted profit before tax | 127,231 |
There is no allocation of assets and liabilities to segments identified above. Depreciation, amortisation and impairments are allocated to segments on the basis of the level of activity.
The following table shows the disaggregation of Group revenue by category:
6 months to 31 December 2025 £'000 | 6 months to 31 December 2024 £'000 | Year ended 30 June 2025 £'000 | |
Goods, capital equipment and installation | 334,768 | 306,441 | 642,378 |
Aftermarket services | 30,848 | 34,961 | 70,666 |
Total Group revenue | 365,616 | 341,402 | 713,044 |
Aftermarket services include repairs, maintenance and servicing, programming, training, extended warranties, and software licences and maintenance.
The following table shows the analysis of revenue by geographical market:
6 months to 31 December 2025 £'000 | 6 months to 31 December 2024 £'000 | Year ended 30 June 2025 £'000 | |
APAC | 178,022 | 161,366 | 337,721 |
UK (country of domicile) | 14,766 | 18,825 | 34,017 |
EMEA, excluding UK | 82,211 | 83,486 | 173,751 |
EMEA | 96,977 | 102,311 | 207,768 |
Americas | 90,617 | 77,725 | 167,555 |
Total Group revenue | 365,616 | 341,402 | 713,044 |
Revenue in the previous table has been allocated to regions based on the geographical location of the customer. Countries with individually significant revenue figures in the context of the Group were:
6 months to 31 December 2025 £'000 | 6 months to 31 December 2024 £'000 | Year ended 30 June 2025 £'000 | |
China | 103,273 | 87,976 | 186,495 |
USA | 79,510 | 67,345 | 142,860 |
Japan | 24,623 | 25,036 | 55,682 |
Germany | 28,186 | 28,175 | 49,273 |
There was no revenue from transactions with a single external customer amounting to 10% or more of the Group's total revenue.
3. Cost of sales
6 months to 31 December 2025 (Unaudited) | 6 months to 31 December 2024 (Unaudited) | Year ended 30 June 2025 (Audited) | |||||||
Adjusted total £'000
| Adjusting items £'000
| Statutory total £'000
| Adjusted total £'000
| Adjusting items £'000
| Statutory total £'000
| Adjusted total £'000
| Adjusting items £'000
| Statutory total £'000
| |
Production costs | 150,556 | 2,655 | 153,211 | 131,486 | - | 131,486 | 272,814 | - | 272,814 |
Research and development expenditure | 28,194 | 3,382 | 31,576 | 33,781 | - | 33,781 | 68,910 | - | 68,910 |
Other engineering expenditure | 22,629 | 2,715 | 25,344 | 21,758 | - | 21,758 | 46,770 | 4,379 | 51,149 |
Gross engineering expenditure | 50,823 | 6,097 | 56,920 | 55,539 | - | 55,539 | 115,680 | 4,379 | 120,059 |
Development expenditure capitalised (net of amortisation) | (3,292) | - | (3,292) | (1,855) | - | (1,855) | (5,574) | - | (5,574) |
Development expenditure impaired | - | - | - | - | - | - | 1,818 | - | 1,818 |
Development expenditure disposed | - | 916 | 916 | - | - | - | - | - | - |
Research and development tax credit | (3,200) | - | (3,200) | (3,110) | - | (3,110) | (5,088) | - | (5,088) |
Total engineering costs | 44,331 | 7,013 | 51,344 | 50,574 | - | 50,574 | 106,836 | 4,379 | 111,215 |
Total cost of sales | 194,887 | 9,668 | 204,555 | 182,060 | - | 182,060 | 379,650 | 4,379 | 384,029 |
4. Financial income and expenses
| 6 months to 31 December 2025 £'000 | 6 months to 31 December 2024 £'000 | Year ended 30 June 2025 £'000 |
Financial income | |||
Bank interest receivable | 4,964 | 6,091 | 11,741 |
Currency gains | 1,109 | - | - |
Interest on pension schemes' assets | 276 | 248 | 503 |
Fair value gains from one-month forward currency contracts | - | - | 3,360 |
Other interest income | 24 | - | 913 |
Total financial income | 6,373 | 6,339 | 16,517 |
Financial expenses | |||
Currency losses | - | 1,448 | 3,899 |
Fair value losses from one-month forward currency contracts | 719 | 264 | - |
Lease interest | 317 | 348 | 685 |
Interest on pension scheme liabilities | 163 | - | - |
Interest payable on amounts owed to joint ventures | 136 | 74 | 371 |
Interest payable on borrowings | 19 | 18 | 49 |
Other interest payable | 575 | 69 | 4,936 |
Total financial expenses | 1,929 | 2,221 | 9,940 |
Currency gains relate to revaluations of foreign currency-denominated balances using latest reporting currency exchange rates. The gains recognised in H1 FY2026 largely related to a depreciation of Sterling relative to the US dollar affecting US dollar-denominated intragroup balances in the Company. Rolling one-month forward currency contracts are used to offset currency movements on certain intragroup balances, with fair value gains and/or losses being recognised in financial income or expenses.
Other interest payable includes liabilities recognised of £575,000 for historical and non-recurring tax matters, see Note 5 for further details.
5. Taxation
The income tax expense in the Consolidated income statement has been estimated at a rate of 21.1% (H1 FY2025: 20.1%), based on management's best estimate of the full year effective tax rates by geographical unit, applied to half-year profits. The effective tax rate on adjusted profit before tax in H1 was 21.8%. This compares to a full year effective tax rate on adjusted profit before tax of 21.2% in FY2025.
Uncertain tax positions
In FY2025, the Group recognised a tax liability of £9,154,000 relating to historical and non-recurring tax matters. The tax matters relate to specific legacy arrangements which we would not expect to recur. Applicable accounting standards require a full provision for tax and the associated interest of £4,852,000, however we continue to seek resolution to these matters which would reduce these amounts. There has been no change to our conclusion at H1 FY2026 related to the historical and non-recurring tax matters. Additional interest of £575,000 has been recognised related to the tax liability in H1 FY2026.
6. Earnings per share
The earnings per share for the six months ended 31 December 2025 is calculated on earnings of £36,319,000 (31 December 2024: £45,929,000) and on 72,756,860 shares (31 December 2024: 72,729,059 shares), being the number of shares in issue during the period. This excludes 31,683 shares (31 December 2024: 59,484 shares) held by the Renishaw Employee Benefit Trust.
7. Dividends
Dividends paid during the period were:
| 6 months to 31 December 2025 £'000 | 6 months to 31 December 2024 £'000 | Year ended 30 June 2025 £'000 |
| |||
FY2025 final dividend paid of 61.3p per share (FY2024: 59.4p) | 44,619 | 43,205 | 43,205 |
FY2025 Interim dividend paid of 16.8p per share (FY2024: 16.8p) | - | - | 12,219 |
Total dividends paid during the period | 44,619 | 43,205 | 55,424 |
All shareholders on the register on 6 March 2026 will be paid an interim dividend of 16.8p net per share on 7 April 2026, resulting in a dividend payable of £12,223,000.
8. Property, plant and equipment
| Freehold land and buildings |
Plant and equipment |
Motor vehicles | Assets in the course of construction |
Total |
| £'000 | £'000 | £'000 | £'000 | £'000 |
Cost | |||||
At 1 July 2025 | 274,628 | 309,054 | 5,962 | 34,539 | 624,183 |
Additions | 2,746 | 7,765 | 79 | 6,715 | 17,305 |
Transfers | 20,030 | 6,485 | - | (26,515) | - |
Disposals | (43) | (2,471) | (591) | - | (3,105) |
Currency adjustment | 367 | 936 | 59 | - | 1,362 |
At 31 December 2025 | 297,728 | 321,769 | 5,509 | 14,739 | 639,745 |
Depreciation | |||||
At 1 July 2025 | 53,790 | 227,715 | 4,391 | - | 285,896 |
Charge for the period | 3,393 | 8,208 | 164 | - | 11,765 |
Disposals | (21) | (1,728) | (392) | - | (2,141) |
Currency adjustment | 413 | 632 | 25 | - | 1,070 |
At 31 December 2025 | 57,575 | 234,827 | 4,188 | - | 296,590 |
Net book value |
|
|
|
|
|
At 31 December 2025 | 240,153 | 86,942 | 1,321 | 14,739 | 343,155 |
At 30 June 2025 | 220,838 | 81,339 | 1,571 | 34,539 | 338,287 |
Additions to assets in the course of construction of £6,715,000 (31 December 2024: £11,385,000) comprise £3,840,000 (31 December 2024: £3,752,000) for freehold land and buildings and £2,875,000 (31 December 2024: £7,633,000) for plant and equipment. At the end of the period, assets in the course of construction, not yet transferred, of £14,739,000 (31 December 2024: £59,264,000) comprise £10,460,000 (31 December 2024: £35,969,000) for freehold land and buildings and £4,279,000 (31 December 2024: £23,295,000) for plant and equipment.
9. Intangible assets
Goodwill
| Internally generated development costs | Software licences | Intellectual property and other intangible assets |
Total | |
£'000 | £'000 | £'000 | £'000 | £'000 | |
Cost |
| ||||
At 1 July 2025 | 19,882 | 189,572 | 12,505 | 4,879 | 226,838 |
Additions | - | 5,176 | 4 | 43 | 5,223 |
Disposals | - | (5,827) | - | - | (5,827) |
Currency adjustment | 174 | - | 34 | 6 | 214 |
At 31 December 2025 | 20,056 | 188,921 | 12,543 | 4,928 | 226,448 |
| |||||
Amortisation |
| ||||
At 1 July 2025 | 9,028 | 152,407 | 11,956 | 2,897 | 176,288 |
Charge for the period | - | 1,884 | 103 | 107 | 2,094 |
Disposals | - | (4,911) | - | - | (4,911) |
Currency adjustment | - | - | 26 | (12) | 14 |
At 31 December 2025 | 9,028 | 149,380 | 12,085 | 2,992 | 173,485 |
| |||||
Net book value |
|
|
|
|
|
At 31 December 2025 | 11,028 | 39,541 | 458 | 1,936 | 52,963 |
At 30 June 2025 | 10,854 | 37,165 | 549 | 1,982 | 50,550 |
As detailed in the 2025 Annual Report, the key assumption in determining the value-in-use of intangible assets are sales forecasts. Latest sales forecasts (and other factors which may impact the business plans) for relevant cash generating units have been reviewed for indicators of impairment on 31 December 2025. This includes an assessment of our discount rate based on prevailing market assumptions on 31 December 2025, which has increased to 11.6% based on a higher risk-free rate (31 December 2024: 10.9%). As a result of the review, no impairments have been recognised in the six months to 31 December 2025 (31 December 2024: nil).
10. Financial instruments
There is no significant difference between the fair value of financial assets and financial liabilities and their book value in the Consolidated balance sheet. All financial assets and liabilities are held at amortised cost, apart from the forward exchange contracts which are held at fair value, with changes going through the Consolidated income statement unless subject to hedge accounting. The fair values of the forward exchange contracts have been calculated by a third-party expert, discounting estimated future cash flows on the basis of market expectations of future exchange rates, representing level 2 in the IFRS 13 fair value hierarchy. There were no transfers between levels during any period disclosed.
Credit risk
The Group carries a credit risk relating to non-payment of trade receivables by its customers. The Group establishes an allowance for impairment in respect of trade receivables where recoverability is considered doubtful. In the six months to 31 December 2025, the Group has generally not experienced a deterioration in debtor repayments nor in the assumptions used in calculating allowances for expected credit losses. At 31 December 2025, total expected credit losses amounted to £5,929,000, being 4.5% of gross trade receivables, compared with £5,984,000 at 30 June 2025, being 4.4% of gross trade receivables.
Liquidity risk
The Group's approach to managing liquidity is to ensure, as far as possible, that we will always have sufficient liquidity to meet our liabilities when due, without incurring unacceptable losses or risking damage to the Group's reputation. We use monthly cash flow forecasts on a rolling 12-month basis to monitor cash requirements. Net cash and bank deposits on 31 December 2025 totalled £240,881,000, compared with £273,646,000 at 30 June 2025. This decrease included a dividend payment of £44,619,000 and cash generation from operating activities of £30,970,000 during the period. In consideration of this, the Group remains in a strong liquidity position.
Market risk
The Group continues to mitigate market risk on cash flows using USD, EUR and JPY forward currency contracts. At 31 December 2025 the total nominal value of USD, EUR and JPY forward contracts held for cash flow hedging purposes was £466,120,539 (31 December 2024: £450,775,855). At 31 December 2025, there were no forward contracts becoming ineffective for hedge accounting purposes. A decrease of 10% in the highly probable revenue forecasts of Renishaw plc and Renishaw UK Sales Limited, being the hedged item, would result in no forward contracts becoming ineffective on 31 December 2025.
11. Employee benefits
The net deficit of the Group's defined benefit pension schemes, on an IAS 19 basis, has reduced from a £9,688,000 liability at 30 June 2025 to a £9,206,000 liability at 31 December 2025. This mostly relates to a reduction in liabilities within the Irish and German scheme due to increases in the discount rate. In FY2024, the Trustee of the UK scheme undertook a buy-in and insured around 99% of the UK scheme's liabilities by purchasing an insurance policy. This contract was effective from 19 October 2023 and the value of the contract is recognised as a UK scheme asset. The buy-in eliminates investment return, longevity, inflation and funding risks in respect of those liabilities covered. Changes to other key assumptions from 30 June 2025 to 31 December 2025 have not had a material effect on the schemes.
The Group has a reimbursement right in respect of its pension obligation for the German scheme. At 31 December 2025, the value of reimbursement right has increased to £14,632,000 (30 June 2025: £12,909,000) due to company contributions. This asset relates to an insurance policy that reimburses the Group for pension payments made to scheme member, but is not classified as a 'plan asset' as it is not a qualifying insurance policy.
The latest full actuarial valuation of the UK scheme was carried out as at 30 September 2024. The actuarial valuation was completed on 24 December 2025; we will adopt the latest valuation as part of our full-year accounting at 30 June 2025.
Benefits in the UK Fund are subject to a DC underpin at the point of retirement or transfer out. Historically, this has been allowed for in the accounts in a consistent manner to current administrative practice and the triennial funding valuations. During the buy-in process, it was identified that the drafting of the DC underpin in the UK Fund Rules may require that the DC underpin is applied in a manner which is different to the administrative practice which has been applied. The Trustee and Company are currently seeking legal clarification and advice on this issue, with the intention of correcting the Rules to match administrative practice. No allowance for this matter has been made at 31 December 2025 , as management continue to assess to be unlikely that there will be an increase in liabilities, and due to the uncertainty of legal treatment and therefore any potential impact on liabilities.
In June 2023, the High Court ruled that certain historic amendments made to the rules of the Virgin Media pension scheme were invalid without the scheme's actuary having provided the associated Section 37 certificates. This judgment was upheld by the Court of Appeal in July 2024, which has implications on other schemes that were contracted-out on a salary-related basis, and made amendments between April 1997 and April 2016. The UK scheme was contracted out until 5 April 2007 and amendments were made during the relevant period and as such the ruling could have implications for the UK scheme. In June 2025, the UK Government announced it will introduce legislation to allow affected pension schemes to retrospectively obtain written actuarial confirmation that historic benefit changes met the necessary standards. The Company and the Trustees have commenced a review of all amending documents between 6 April 1997 and 5 April 2016 for the scheme to determine whether proper procedures were undertaken at the time of the amendments by the Trustees, actuaries and administrators. The Trustee and Company continue to seek legal advice on this matter and will act appropriately to obtain retrospective actuarial confirmation where appropriate. At the date of approving these interim financial statements, the possible implications, if any, for the UK scheme not having all Section 37 certificates have not been investigated in detail. Accordingly, no amendments for this matter have been included in the IAS 19 actuarial valuation as the impact, if any, cannot be reliably assessed.
12. Alternative performance measures
In accordance with Renishaw's Alternative Performance Measures (APMs) policy and ESMA Guidelines on Alternative Performance Measures (2015), this section defines non-IFRS measures that we believe give readers additional useful and comparable views of our underlying performance. We continue to report Revenue at constant exchange rates, Adjusted profit before tax, Adjusted earnings per share, Adjusted operating profit (including by segment), Adjusted operating profit at constant exchange rates, Adjusted cash flow conversion from operating activities, and Return on invested capital as APMs.
The APMs are calculated consistently with previous years, except for Adjusted cash flow conversion from operating activities. Adjusted cash flow from operating activities now adjusts for the cash effect of the adjusting items. The cash impact of adjusting items on previously reported metrics is not material and therefore has not been restated.
Aside from Revenue at constant exchange rates, all other APMs exclude infrequently occurring events which impact our financial statements, recognised according to applicable IFRS, that we believe should be excluded from these APMs to give readers additional useful and comparable views of our underlying performance.
Revenue at constant exchange rates is defined as revenue recalculated using the same rates as were applicable to the previous year and excluding forward contract gains and losses.
Revenue at constant exchange rates
|
| 6 months to 31 December 2025 | 6 months to 31 December 2024 |
|
| £'000 | £'000 |
|
|
| |
Statutory revenue as reported |
| 365,616 | 341,402 |
Adjustment for forward contract gains |
| (5,005) | (12,959) |
Adjustment to restate at previous year exchange rates |
| 5,525 | - |
Revenue at constant exchange rates |
| 366,136 | 328,443 |
Year-on-year revenue growth at constant exchange rates |
| 11.5% |
Adjusted profit before tax, Adjusted profit after tax, Adjusted earnings per share and Adjusted operating profit are defined as the profit before tax, earnings per share and operating profit after excluding:
- Cost reduction programme (a)
- Loss of office payable to Executive Director (b)
- Closure of drug delivery business (c)
- Other interest payable on historical and non-recurring tax matters (d)
(a) Restructuring costs, where applicable during the year, are excluded from adjusted measures on the basis that they do not frequently recur. In FY2025, the Group initiated a cost reduction programme to achieve labour cost savings. The cost of the voluntary and compulsory redundancies has been recognised in FY2026 based on relevant accounting standards. The Group has recognised redundancy payments of £14,828,000. The amounts have been recognised in Cost of sales, Distribution expenditure and Administrative expenditure within the Consolidated income statement respectively.
(b) There may be other items which do not frequently recur, for which it may be appropriate to exclude from adjusted measures. The Group Finance Director retired from the Group on the 31 December 2025. The Group recognised costs related to the loss of office of £1,980,000 in the period, as detailed on page 98 of the 2025 Annual Report. As the loss of office does not relate to current year trading performance, the amounts have been excluded from adjusted measures. The amounts have been recognised in Administrative expenses within the Consolidated income statement.
(c) Restructuring costs, where applicable during the year, are excluded from adjusted measures on the basis that they do not frequently recur. In FY2025, the Group made the decision to close the drug delivery business. In FY2026, the Group incurred further costs, following the decision to sell the drug delivery business. The Group has recognised income of £250,000 related to the sale, and a loss on disposal of intangible assets of £916,000. The amounts have been recognised in Cost of sales, in Gross engineering expenditure, within the Consolidated income statement respectively.
(d) There may be other items which do not frequently recur, for which it may be appropriate to exclude from adjusted measures. During FY2025, the Group recognised an interest charge of £4,852,000 and a Taxation charge of £9,154,000 relating to historical and non-recurring tax matters. The tax matters relate to specific legacy arrangements which we would not expect to recur. Applicable accounting standards require a full provision for tax and the associated interest, however, we continue to seek resolution to these matters which would reduce these amounts. In H1 FY2026, additional interest of £575,000 has been recognised related to the tax liability. As the historical and non-recurring tax matters do not relate to current year trading performance, the amounts have been excluded from adjusted measures. The amount has been recognised in Financial expenses within the Consolidated income statement.
Adjusted profit before tax | 6 months to 31 December 2025 | 6 months to 31 December 2024 | Year ended 30 June 2025 |
| £'000 | £'000 | £'000 |
Statutory profit before tax | 46,032 | 57,484 | 118,000 |
Cost reduction programme | 14,828 | - | - |
Loss of office payable to Executive Director | 1,980 | - | - |
Closure of drug delivery business | 666 | - | 2,059 |
Other interest payable on historical and non-recurring tax matters | 575 | - | 4,852 |
Closure of Edinburgh research facility | - | - | 2,320 |
Adjusted profit before tax | 64,081 | 57,484 | 127,231 |
Adjusted earnings per share | 6 months to 31 December 2025 | 6 months to 31 December 2024 | Year ended 30 June 2025 |
| £'000 | £'000 | £'000 |
Statutory earnings per share | 49.9 | 63.2 | 115.2 |
Cost reduction programme | 15.4 | - | - |
Loss of office payable to Executive Director | 2.0 | - | - |
Closure of drug delivery business | 0.7 | - | 2.1 |
Other interest payable on historical and non-recurring tax matters | 0.8 | - | 5.5 |
Closure of Edinburgh research facility | - | - | 2.4 |
Prior year adjustment taxation charge on historical and non-recurring tax matters | - | - | 12.6 |
Adjusted earnings per share | 68.8 | 63.2 | 137.8 |
Adjusted operating profit | 6 months to 31 December 2025 | 6 months to 31 December 2024 | Year ended 30 June 2025 |
| £'000 | £'000 | £'000 |
Statutory operating profit | 40,062 | 51,560 | 107,885 |
Cost reduction programme | 14,828 | - | - |
Loss of office payable to Executive Director | 1,980 | - | - |
Closure of drug delivery business | 666 | - | 2,059 |
Closure of Edinburgh research facility | - | - | 2,320 |
Adjusted operating profit | 57,536 | 51,560 | 112,264 |
Adjustments to the segmental operating profit
Industrial metrology | 6 months to 31 December 2025 | 6 months to 31 December 2024 | Year ended 30 June 2025 |
| £'000 | £'000 | £'000 |
Operating profit | 21,907 | 30,969 | 74,130 |
Cost reduction programme | 9,086 | - | - |
Loss of office payable to Executive Director | 1,271 | - | - |
Closure of drug delivery business | - | - | - |
Closure of Edinburgh research facility | - | - | 1,378 |
Adjusted operating profit | 32,264 | 30,969 | 75,708 |
Position measurement | 6 months to 31 December 2025 | 6 months to 31 December 2024 | Year ended 30 June 2025 |
| £'000 | £'000 | £'000 |
Operating profit | 21,648 | 28,470 | 46,010 |
Cost reduction programme | 3,830 | - | - |
Loss of office payable to Executive Director | 411 | - | - |
Closure of drug delivery business | - | - | - |
Closure of Edinburgh research facility | - | - | 618 |
Adjusted operating profit | 25,889 | 29,470 | 46,628 |
Specialised technologies | 6 months to 31 December 2025 | 6 months to 31 December 2024 | Year ended 30 June 2025 |
| £'000 | £'000 | £'000 |
Operating profit | (3,493) | (7,879) | (12,255) |
Cost reduction programme | 1,912 | - | - |
Loss of office payable to Executive Director | 298 | - | - |
Closure of drug delivery business | 666 | - | 2,059 |
Closure of Edinburgh research facility | - | - | 324 |
Adjusted operating profit | (617) | (7,879) | (9,872) |
Operating profit at constant exchange rates is defined as Operating profit recalculated using the same rates as applied to the previous year and excluding forward contract gains and losses.
Operating profit at constant exchange rates
|
| 6 months to 31 December 2025 | 6 months to 31 December 2024 |
|
| £'000 | £'000 |
|
|
| |
Operating profit |
| 57,536 | 51,560 |
Adjustment for forward contract gains |
| (5,005) | (12,959) |
Adjustment to restate current year at previous year exchange rates |
| 5,222 | - |
Operating profit at constant exchange rates |
| 57,753 | 38,601 |
Year-on-year Operating profit growth at constant exchange rates |
| 49.6% |
Year-on-year adjusted operating profit at constant exchange rates was a reduction for H1 FY2025 of 4.9%.
Adjusted cash flow conversion from operating activities is calculated as Adjusted cash flow from operating activities as a proportion of Adjusted operating profit. This is useful for the Board to measure how efficient we are at converting operating profit into cash. The 31 December 2025 Adjusted cash flow from operating activities has been adjusted for the cash effect of the adjusting items, being Cost reduction programme and Closure of drug delivery business, as well as Income taxed paid, purchase of property, plant and equipment and intangible assets, and proceeds from sale of property, plant and equipment and intangible assets. The cash impact of adjusting items on the year-end 30 June 2025 metric is not material and therefore has not been restated.
Adjusted cash flow conversion from operating activities
| 6 months to 31 December 2025 | 6 months to 31 December 2024 | Year ended 30 June 2025 |
| £'000 | £'000 | £'000 |
Statutory cash flow from operating activities | 30,970 | 76,241 | 147,896 |
Cash effect of cost reduction programme | 14,413 | - | - |
Cash effect of closure of drug delivery business | 222 | - | - |
Income taxes paid | 15,178 | (1,815) | 6,207 |
Purchase of property, plant and equipment and intangible assets | (22,528) | (25,746) | (56,558) |
Proceeds from sale of property, plant and equipment and intangible assets | 1,023 | 2,814 | 4,887 |
Adjusted cash flow from operating activities | 39,278 | 51,494 | 102,432 |
Adjusted cash flow conversion from operating activities | 68.3% | 99.9% | 91.2% |
Return on invested capital is the Adjusted profit after tax before bank interest receivable as a percentage of the Average invested capital in the preceding 12 months. This is useful for the Board to measure our efficiency in allocating capital to profitable activities.
Adjusted profit after tax before bank interest receivable is calculated as follows:
| 6 months to 31 December 2025 | 6 months to 31 December 2024 | Year ended 30 June 2025 |
| £'000 | £'000 | £'000 |
Statutory profit after tax | 36,319 | 45,929 | 83,757 |
Cost reduction programme (net of tax) | 11,232 | - | - |
Loss of office payable to Executive Director (net of tax) | 1,485 | - | - |
Closure of drug delivery business (net of tax) | 500 | - | 1,544 |
Other interest payable on historical and non-recurring tax matters (net of tax) | 575 | - | 4,026 |
Closure of Edinburgh research facility (net of tax) | - | - | 1,740 |
Prior year adjustment taxation charge on historical and non-recurring tax matters | - | - | 9,154 |
Adjusted profit after tax | 50,111 | 45,929 | 100,221 |
Bank interest receivable (net of tax) | (3,723) | (4,568) | (8,805) |
Profit after tax before bank interest received | 46,388 | 41,361 | 91,416 |
Profit after tax before bank interest received for the 12-months to 31 December 2025 was £96.4m.
Return on invested capital (ROIC): | 6 months to 31 December 2025 | 6 months to 31 December 2024 | Year ended 30 June 2025 | Year ended 30 June 2024 |
| £'000 | £'000 | £'000 | £'000 |
Total non-current assets | 513,133 | 495,272 | 506,925 | 464,765 |
Total current assets | 599,581 | 564,208 | 628,300 | 586,618 |
Total current liabilities | (131,119) | (102,677) | (137,461) | (100,948) |
Less cash and cash equivalent | (78,011) | (90,161) | (87,420) | (122,293) |
Less bank deposits | (162,870) | (143,000) | (186,226) | (95,542) |
Invested capital | 740,714 | 723,642 | 724,118 | 732,600 |
Average invested capital | 732,178 | 715,314 | 728,359 | 733,715 |
Return on invested capital | 13.2% | 12.6% | 12.6% | 12.3% |
Average invested capital in the year is the average of the invested capital at the beginning of the reporting period and at the end of the reporting period. The impact on the ROIC metric of the German pension scheme restatement on the Consolidated balance sheet at 31 December 2024 and 30 June 2024 is not material and therefore has not been restated.
13. Related party transactions
Transactions between the Company and its subsidiaries, which are related parties, have been eliminated on consolidation and are not disclosed in this note. Full details of the Group's other related party relationships, transactions and balances are given in the Group's Annual Report for the year ended 30 June 2025.
On 25 November 2025 shares in the Company previously held by the families of the Company's founders, the late Sir David McMurtry and current Non-executive Director, John Deer, were transferred to Deltam Holdings Limited ('Deltam') which now holds 50.25% of the issued share capital and voting rights of the Company. Under these arrangements the Deer family representatives on the Deltam board of directors (representing a 27.88% interest in Deltam) can require all of the Renishaw shares held by Deltam to be voted against a special resolution of the Company and the McMurtry family representatives on the Deltam board of directors (representing a 72.12% interest in Deltam) can require all of the Renishaw shares held by Deltam to be voted in favour of an ordinary resolution of the Company. If the Deltam board of directors cannot agree on how to vote the Renishaw shares held by Deltam, then the Deltam board shall cast the votes as it sees fit. This may include casting some votes in favour and some votes against the relevant resolution. Certain members of the McMurtry and Deer families have retained personal holdings of Renishaw shares representing, in aggregate, 2.64% of the issued shares and these shares are not subject to the above arrangements.
Renishaw International Limited ('RIL') has a 14-day notice deposit agreement with RLS Merilna tehnika d.o.o. ('RLS'), a joint venture of the Group. Interest is payable by RIL to RLS at a market rate on a monthly basis. As at 31 December 2025, according to this agreement, the amount RIL had received was EUR 18.5m (£16.1m equivalent), an increase from EUR 17.0m (£14.5m equivalent) at 30 June 2025. The amounts are recognised as 'amounts payable to joint venture' in the Consolidated balance sheet. The total interest payable on amounts owed to joint ventures during the period was £136,000 (31 December 2024: £74,000).
No other related party transactions have taken place in the first six months of FY2026, or events subsequent to the end of the reporting period, that have materially affected the financial position or the performance of the Group during that period.
14. Responsibility statement
The condensed set of financial statements is the responsibility of, and has been approved by, the Directors. We confirm that to the best of our knowledge:
- As required by DTR 4.2 of the Disclosure Rules and Transparency Rules, the condensed set of financial statements, which has been prepared in accordance with the applicable set of accounting standards, gives a true and fair view of the assets, liabilities, financial position and profit or loss of the Company and the undertakings included in the consolidation as a whole. The Interim report has been prepared in accordance with IAS 34, 'Interim Financial Reporting', as issued by the International Accounting Standards Board and as adopted by the UK.
- The Interim report includes a fair review of the information required by:
(a) DTR 4.2.7 of the Disclosure Rules and Transparency Rules, being an indication of important events that have occurred during the first six months of the financial year and their impact on the condensed set of financial statements; and a description of the principal risks and uncertainties for the remaining six months of the year; and
(b) DTR 4.2.8 of the Disclosure Rules and Transparency Rules, being related party transactions that have taken place in the first six months of the current financial year and that have materially affected the financial position or performance of the entity during that period; and any changes in the related party transactions described in the last Annual Report that could do so.
On behalf of the Board
Will Lee
Chief Executive Officer
10 February 2026
Registered office: Renishaw plc, New Mills, Wotton-under-Edge, Gloucestershire GL12 8JR, U.K.
Registered number: | 01106260 |
Company Secretary: | |
Telephone: | +44 1453 524524 |
Website: | www.renishaw.com |
Related Shares:
Renishaw