31st Mar 2026 17:09
The information contained within this announcement is deemed by CloudCoCo to constitute inside information pursuant to Article 7 of EU Regulation 596/2014 as it forms part of UK domestic law by virtue of the European Union (Withdrawal) Act 2018 as amended.
31 March 2026
CloudCoCo Group plc
("CloudCoCo", the "Company" or the "Group")
Final Results
CloudCoCo (AIM: CLCO), the Sheffield-based e-commerce and IT procurement group delivering tailored, next-day IT solutions through its Systems Assurance and MoreCoCo divisions, is pleased announce its full year results for the year ended 30 September 2025 ("FY 2025").
Highlights:
· Group revenue of £9.6 million (FY24: £27.5 million), reflecting the disposal of legacy managed services businesses
· Continuing operations revenue of £8.0 million (FY24: £8.7 million)
· Total comprehensive profit of £2.6 million (FY24: £3.1 million loss) driven primarily by gain on disposal
· Profit from sale of discontinued operations of £3.1 million
· Trading Group EBITDA1 (continuing operations) improved to £0.08 million (FY24: £0.06 million)
· Full repayment of £6.2 million MXC loan notes, leaving the Group substantially debt-free
· Significant reduction in Plc costs to £0.5 million (FY24: £0.8 million)
· Strong operational progress with annualised revenue run-rate approaching £10 million exiting the year
· Post year-end fundraise of £275,000 (gross) announced 10 March to support growth strategy (Project Brightstar)
1 profit or loss before net finance costs, tax, depreciation, amortisation, plc costs, exceptional costs and share-based payments
Simon Duckworth, Chairman of CloudCoCo, commented:
"FY2025 has been a transformational year for CloudCoCo. The successful disposal of our legacy managed services businesses has allowed us to eliminate debt, strengthen the balance sheet and reposition the Group around a simplified, scalable e-commerce and IT procurement model.
While revenues reflect the impact of this transition, the underlying trading business has shown improving momentum, exiting the year with a run-rate approaching £10 million. With a lean cost base, growing WebStore platform, and the recent launch of Project Brightstar to accelerate B2B growth, we believe the Group is now well positioned to scale revenues, improve margin quality and move towards sustainable profitability."
The Company's Annual Report will be available on the Company's website and will be posted to shareholders today along with notice of the Annual General Meeting to be held on 28th April 2026 at 12:30 p.m. Copies of these documents are available on the Company's website at www.cloudcoco.co.uk.
Contacts:
CloudCoCo Group plc Simon Duckworth (Chairman)Darron Giddens (CFO)Peter Nailer (Managing Director | Tel: +44 (0) 114 292 2930
|
Allenby Capital Limited - (Nominated Adviser & Broker) Jeremy Porter / Vivek Bhardwaj - Corporate FinanceTony Quirke / Amrit Nahal - Equity Sales | Tel: +44 (0)20 3328 5656
|
About CloudCoCo
CloudCoCo is a streamlined, growth-focused technology group specialising in e-commerce and IT procurement business based in Sheffield. Combining expert IT procurement solutions through Systems Assurance with the scalable e-commerce capabilities of MoreCoCo (www.morecoco.co.uk), helping organisations deliver enhanced efficiency, security, and agility. Backed by strong vendor partnerships and a team of industry specialists, we deliver tailored solutions and next-day access to hundreds of thousands of IT products. www.cloudcoco.co.uk
Chairman's statement
Introduction I am pleased to present the annual results of CloudCoCo Group plc for the year ended 30 September 2025. During the year, the Group undertook a transformative restructuring, including the disposal of its legacy managed services businesses, resulting in a simplified operating model and a strengthened balance sheet.
The Group now focuses on two core trading activities: e-commerce through MoreCoCo and IT procurement and value-added resale through Systems Assurance. This repositioning provides a clear platform for future growth.
Strategic and Financial Transformation The most significant event of the year was the sale of the Group's legacy managed services businesses, CloudCoCo Limited and CloudCoCo Connect Limited, completed on 31 October 2024. Total cash proceeds of £7.9 million, including £7.5 million initial consideration for CloudCoCo Limited, subsequently reduced by £0.385 million following agreement of completion accounts reflecting working capital movements. Further details are included in Note 13. This transaction enabled the full repayment of the £6.2 million MXC loan notes, eliminated long-term debt and avoided a £550,000 extension fee.
As a result, the Group moved from net liabilities of £2.1 million at 30 September 2024 to net assets of approximately £0.5 million and net cash of approximately £0.6 million at 30 September 2025. Driven primarily by the gain on disposal, the Group reported a total comprehensive profit for the year of £2.6 million.
Continuing revenues for the year were £8.0 million, below the restated FY2024 figure, reflecting supplier data-feed disruption in the first quarter and the residual complexity of the pre-disposal structure. Trading improved steadily thereafter, and the Group exited the year with an annualised revenue run-rate approaching £10 million.
This transaction materially strengthened the Group's balance sheet and removed all long-term debt.
Operational Performance and Cost Discipline Gross margins improved to approximately 15% before seller fees (around 7% net), supported by improved pricing, automation and commercial terms. MoreCoCo remained the principal driver of revenues, with over half of e-commerce orders now processed without human intervention, enabling growth without a corresponding increase in headcount.
Plc-level costs were reduced by 46% from £0.8 million in FY2024 to £0.5 million in FY2025, of which approximately £0.3 million relates to ongoing Plc costs. In addition, Executive Directors elected to take aggregate salary and associated cost reductions of c.£90,000 per annum from 1 April 2025, demonstrating the Board's commitment to cost discipline and alignment with the scale of the business.
Leadership and People Our people have been central to the progress made during this transitional year. Despite a lean headcount of 13 employees at the year end, the Group retains significant experience and capability.
In November 2024, Peter Nailer was appointed Managing Director of the trading business. Under his leadership, both MoreCoCo and Systems Assurance have gained momentum, with a renewed focus on execution and growth. The Board thanks all employees for their commitment and professionalism during a year of significant change.
Outlook The Board's strategy is to scale the trading business toward an initial £10 million annual revenue level, which is expected to support consistent positive monthly cash flow. As revenues increase, the Group anticipates benefiting from operating leverage across its largely fixed cost base.
The Group is focused on increasing higher-margin direct web sales and expanding software-led revenue streams, including its white-label WebStore platforms, which now support approximately 60 business customers. The Board is encouraged by the current pipeline across both e-commerce and WebStore solutions. Post Year-End Developments Subsequent to the year end, the Company announced a strategic growth initiative, Project Brightstar, designed to accelerate the Group's expansion in the B2B technology procurement market and support the scaling of revenues beyond the Group's initial £10 million target. On 27 March 2026, shareholders approved a capital reorganisation and a subscription for new ordinary shares. Following these approvals, the Company completed a subscription raising £275,000 (gross) through the issue of 229,166,666 new ordinary shares at 0.12 pence per share, with net proceeds of approximately £260,000. The capital reorganisation reduced the nominal value of the Company's ordinary shares to facilitate the fundraising. The proceeds of the subscription will be used to support the recruitment of an experienced enterprise sales team and further develop the Group's digital commerce and IT procurement capabilities. The Board believes this initiative represents a natural evolution of the Group's strategy, combining its e-commerce infrastructure with higher-value enterprise procurement services to drive scalable revenue growth and improved margin quality.
The Board believes the Group is well positioned to accelerate its growth strategy in FY2026, with Project Brightstar providing a clear platform to scale revenues, enhance margin quality and deliver sustainable long-term growth.Simon DuckworthChairman 31 March 2026
Trading Review
Performance Overview
The year ended 30 September 2025 represents the first full reporting period following the Group's strategic transition to a focused IT procurement and e-commerce model. Continuing operations generated revenues of £8.0 million (FY2024 continuing: £8.7 million), with Trading Group EBITDA improving to £80k (FY2024 continuing: £63k), reflecting the underlying operating leverage of the streamlined Group and the benefits of a more focused trading strategy.
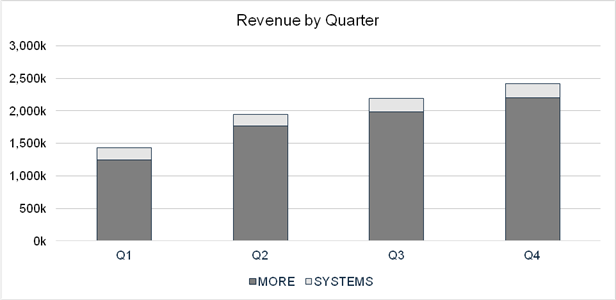
Performance in the first quarter was impacted by supplier data-feed disruption and the residual effects of operating within a more complex Group structure prior to the disposal of the managed services businesses in October 2024. Trading momentum improved steadily thereafter, with quarterly revenues increasing from £1.4 million in Q1 to £2.4 million in Q4, as illustrated in the quarterly revenue chart, equating to an annualised run-rate approaching £10 million by the year end.
The statutory operating loss from continuing operations was £394k (FY2024: £540k), after charging amortisation of acquired intangibles of £79k, share-based payments of £2k and Plc-level costs of £354k.
MoreCoCo - E-Commerce Platform
MoreCoCo remained the principal driver of Group revenues, accounting for the majority of value-added resale income of £7.8 million. During the year, six new vendor distribution partners were onboarded, expanding the product catalogue to over 190,000 items and improving price competitiveness and product availability, particularly within IT hardware and gaming components.
Operational scalability continued to improve materially. Over 50% of e-commerce orders are now processed without human intervention, with automation handling more than 7,000 orders per month. This has reduced marginal fulfilment costs and provides a scalable platform capable of supporting significant revenue growth with minimal additional headcount.
Third-party marketplaces, predominantly Amazon, accounted for approximately 91% of e-commerce revenues during the year. While these channels provide valuable volume, customer reach and supplier pricing leverage, net margins after marketplace fees average approximately 4%, compared with c.12% on direct website sales and other lower-fee channels. Management's strategic priority is therefore to increase the proportion of direct and alternative channel sales over time, improving blended margins while maintaining overall sales volumes.
Systems Assurance - B2B Procurement and WebStore Growth
Systems Assurance has been repositioned as a specialist IT value-added reseller and procurement broker, focusing on hardware, licensing and software rather than managed IT services. Continuing managed IT services revenues reduced to £246k (FY2024 continuing: £420k), consistent with the Group's strategy to prioritise scalable, repeatable procurement-led activity over labour-intensive service contracts.
The business secured 10 new customers in the first half of the year and continued to build its pipeline in the second half, supported by growing demand for structured procurement solutions and best-value sourcing. A key development has been the expansion of the Group's branded WebStore offering, with approximately 60 WebStore customers onboarded during the year. These platforms provide business customers with 30-day credit terms, delegated approval workflows, consolidated invoicing and rapid fulfilment, supporting repeat purchasing behaviour and improved customer retention, and creating software-enabled, higher-quality revenue streams.
Trading Performance For the year ended 30 September 2025, the Group's total performance, including both continuing and discontinued operations, is as follows:
· Total Revenue: £9.6 million (FY24: £27.5 million)
· Gross Profit: £1.0 million (FY24: £7.6 million)
· Trading Group EBITDA1: £0.2 million (FY24: £1.6 million)
The financial statements present the discontinued operations separately in accordance with IFRS 5. The continuing e-commerce business is now the primary contributor to the Group's revenue and profitability.
Continuing and Discontinued Operations
Following the disposal of CloudCoCo Limited and CloudCoCo Connect Limited, the Group's discontinued managed services activities are presented separately in accordance with IFRS 5. The continuing e-commerce and procurement businesses through MoreCoCo and Systems Assurance are now the sole contributors to the Group's future revenue and profitability.
Including discontinued operations, the Group generated revenues of £9.6 million in the year (FY2024: £27.5 million), reflecting the disposal of the majority of the managed services activities. Discontinued operations contributed £1.6 million of revenue (FY2024: £18.8 million), while continuing operations delivered £8.0 million (FY2024: £8.7 million), of which £7.8 million related to value-added resale. Continuing Operations Performance Our continuing operations, comprising the e-commerce business through Systems Assurance and MoreCoCo, delivered solid performance during the year. This segment focuses on providing IT hardware, components, and related products to both business and consumer customers through our online platform.
|
| Continuing2025£'000 | Continuing2024£'000 | |
More Computers - e-commerce |
| 7,198 | 7,406 | |
Systems Assurance - B2B Procurement and Managed Services |
| 793 | 911 | |
Total Revenue |
| 7,991 | 8,737 |
 Key highlights for the continuing operations include:
· Trading EBITDA1 growth during the period as a result of better gross margins and improved cost controls.
· Plc costs were reduced by 21% to £354k and the Group ended the year debt-free with a cash balance of £635k.
· WebStore developed to increase sales to B2B customers in 2026.
Gross Margin and Cost Base
Gross profit from continuing operations was £0.5 million, representing a gross margin of approximately 6.5% after seller fees (c.14.5% gross). This improvement reflects enhanced pricing discipline, improved supplier terms, increased automation and lower payment processing costs.
Administrative expenses relating to continuing operations reduced to £0.9 million (FY2024 continuing: £1.0 million), reflecting the full-year impact of operating as a standalone trading group following the disposal of discontinued operations, including costs previously absorbed elsewhere within the Group.
Plc-level costs were reduced by 25% to £354k (FY2024: £472k). Further cost alignment was achieved through Executive Directors electing to take aggregate salary and associated cost reductions of c,£90k per annum from 1 April 2025. As revenues grow toward the initial £10 million annual target, management expects the largely fixed central cost base to be leveraged more effectively, supporting improved profitability. Cash Flow, Working Capital and Balance Sheet
The Group remained focused on cash discipline throughout the year. Net cash outflow from operating activities was £0.6 million, reflecting operating losses, working capital movements and the Group operating below target scale. This was more than offset by investing inflows of £7.33 million, primarily from the disposal of CloudCoCo Limited and CloudCoCo Connect Limited.
Financing outflows of £6.34 million largely comprised the full repayment of the MXC loan notes and accrued interest following the disposal. As a result, the Group moved from a net debt position of £5.15 million at 30 September 2024 to net cash position of approximately £0.53 million at 30 September 2025. Cash at bank at the year end was £0.64 million (FY2024: £1.04 million), and net assets improved to £0.5 million (FY2024: net liabilities of £2.1 million).
Technology, Automation and Scalability
The Group continues to invest selectively in technology to enhance efficiency and customer experience. AI-enabled tools are currently deployed in supplier invoice processing and web development, with further applications under evaluation to improve product discovery, customer support and post-sale services across a catalogue exceeding 300,000 stocked items. The Group operated with a lean headcount of 13 employees at the year end (FY2024: 82). Due to the low-touch nature of the e-commerce model, management believes revenues could be materially increased with limited incremental headcount, providing strong operational leverage as scale increases. Strategic Focus and Future Opportunities
Following the disposal of the Managed Services businesses, the Group's strategic focus is firmly aligned around scaling its remaining operations in a disciplined and capital-efficient manner. Management's priority is to grow revenues while improving gross margins and cash generation, leveraging the inherently scalable nature of the Group's e-commerce and procurement platforms.
A central element of this strategy is the continued expansion of direct web sales, which offer materially higher net margins than third-party marketplaces. While marketplaces such as Amazon continue to provide valuable volume, customer reach and supplier pricing leverage, the Group is increasingly focused on migrating repeat and business customers toward its own digital channels. This approach is expected to improve blended margins over time while maintaining overall sales volumes.
In parallel, the Group is developing white-label and private WebStore solutions to serve professional bodies, affinity marketing groups and multi-site organisations. These platforms allow partners and customers to offer curated procurement environments supported by the Group's infrastructure, credit facilities and fulfilment capabilities, creating scalable, software-enabled revenue streams with attractive repeat-purchase characteristics.
The Group also continues to strengthen strategic relationships with key manufacturers and distributors, with a focus on improving product availability, pricing and fulfilment reliability. As scale increases, management expects these partnerships to further enhance commercial terms and reinforce the Group's competitive positioning.
Within Systems Assurance, the strategic emphasis is on expanding higher-value consultancy, procurement and middleware solutions that support business customers in managing complex IT purchasing requirements. Rather than competing directly in the crowded managed IT services market, the Group is positioning itself as a specialist procurement and integration partner, enabling customers to source, deploy and manage IT infrastructure more efficiently.
Market Environment and Principal Risks
Trading during the year took place against a backdrop of ongoing UK cost-of-living pressures and inflationary impacts on both consumer and business spending. The Group's focus on essential IT hardware, flexible procurement models and rapid fulfilment has helped mitigate some of these pressures, particularly where technology investment remains operationally necessary for customers.
The principal risks facing the Group remain centred on execution and scale. These include the need to grow revenues sufficiently to fully absorb Plc-level costs, exposure to inventory management and potential product obsolescence, reliance on key suppliers and marketplaces, and the requirement to maintain robust cyber security across increasingly digital platforms. The Board actively monitors these risks and continues to strengthen internal controls, supplier diversification and technology resilience.
While the Board remains mindful of broader economic uncertainty and the competitive nature of the IT procurement and e-commerce markets, the Group enters the new financial year with a strengthened balance sheet, minimal debt, a lean cost base and a clearly defined strategic focus. Management believes this provides a solid foundation from which to navigate market challenges and pursue sustainable, long-term growth. Technology, Automation and Scalability
The Group continues to invest selectively in technology to enhance efficiency and customer experience. AI-enabled tools are currently deployed in supplier invoice processing and web development, with further applications under evaluation to improve product discovery, customer support and post-sale services across a catalogue exceeding 300,000 stocked items.
The Group operated with a lean headcount of 13 employees at the year end (FY2024: 82). Due to the low-touch nature of the e-commerce model, management believes revenues could be materially increased with limited incremental headcount, providing strong operational leverage as scale increases.
Strategic Focus and Market Outlook
Following the disposal of the managed services businesses, the Group's strategic focus is firmly aligned around scaling its remaining operations in a disciplined and capital-efficient manner. Management's priority is to grow revenues while improving gross margins and cash generation, leveraging the inherently scalable nature of the Group's e-commerce and procurement platforms.
A central element of this strategy is the continued expansion of direct web sales, alongside the development of white-label and private WebStore solutions for professional bodies, affinity groups and multi-site organisations. The Group also continues to strengthen relationships with key manufacturers and distributors to improve pricing, availability and fulfilment reliability.
Subsequent to the year end, the Group announced Project Brightstar, a strategic initiative intended to accelerate the Group's growth in the B2B technology procurement market by combining its digital commerce platform with enterprise-focused sales capability. The programme is designed to increase direct customer engagement, improve margin quality and expand higher-value procurement and services opportunities.
In March 2026, shareholders approved a capital reorganisation and a subscription raising £275,000 (gross) to support the initial phase of this initiative. The Board believes this additional growth capital will enable the Group to accelerate its revenue scaling strategy while maintaining its disciplined approach to cost management.
Trading during the year took place against a backdrop of ongoing UK cost-of-living pressures and inflationary impacts on both consumer and business spending. The Group's focus on essential IT hardware, flexible procurement models and rapid fulfilment has helped mitigate some of these pressures.
The principal risks facing the Group remain centred on execution and scale, including the need to grow revenues to absorb Plc-level costs, managing inventory exposure and obsolescence risk, reliance on key suppliers and marketplaces, and maintaining robust cyber security across digital platforms. These risks are actively monitored by the Board.
Conclusion
The 2025 financial year marked a decisive reset for CloudCoCo Group plc. While the disposal of the managed services businesses was necessary to repay legacy debt, it has also created a simpler, more scalable and more focused trading group. With a debt-free balance sheet, a disciplined cost base and improving revenue momentum, the Board believes the Group is now positioned to pursue the next phase of growth.
With the launch of Project Brightstar and the strengthening of the Group's commercial capabilities, the Board believes the Company is well positioned to accelerate revenue growth, improve margin quality and move toward sustainable positive EBITDA, including the absorption of Plc-level costs, while continuing to focus on long-term value creation for shareholders.
Darron Giddens Chief Financial Officer 31 March 2026
Financial review
The financial results for the year reflect a significant transition for the Group, following the disposal of the Infrastructure division on 31 October 2024. As a result, the Group now reports a substantially simplified business focused on its continuing operations.
While the disposal has materially reduced the Group's scale, it has also removed a large operational cost base and balance sheet complexity. The continuing business therefore ended this financial year with a cleaner balance sheet, a leaner cost structure and a clearer strategic focus.
The following sections discuss the key movements during the year.
Revenues Group revenues reduced from £27.5 million in FY-2024 to £9.6 million in FY-2025, reflecting the sale of the legacy Managed IT Services businesses, CloudCoCo Limited and CloudCoCo Connect Limited, which completed on 31 October 2024.
Revenues | FY 2025£'000 | FY 2024£'000 |
Revenues generated by Direct Sales channels | 2,440 | 20,118 |
Revenues generated by E-Commerce channels | 7,198 | 7,406 |
Total Revenue | 9,638 | 27,524 |
Where results are presented as "Continuing Operations", they comprise the Group's e-commerce and IT procurement activities delivered through More Computers Limited (trading as MoreCoCo) and Systems Assurance Limited.
Revenues - Continuing Operations Revenue from continuing operations for the year was £8.0 million (FY-2024: £8.7 million).
Following the disposal of the Managed IT Services businesses and the appointment of Peter Nailer as Managing Director of the continuing trading businesses in November 2024, the Group has made encouraging progress in stabilising and improving the performance of its remaining operations.
Prior to the disposals, the legacy Managed IT Services businesses were experiencing a material cash drain, which was partially being supported by the continuing e-commerce and procurement operations. This created working capital constraints that negatively impacted the trading performance of these businesses entering FY-2025.
Following the disposal, the Group was able to replenish working capital and refocus management attention on the continuing operations. With a strengthened balance sheet and a leaner operating structure, the Group has been working to enhance the performance of the business and broaden the range of services offered.
Revenue in the first half of FY-2025 was £3.4 million, compared with £4.3 million in H1-2024, reflecting the impact of these earlier working capital constraints and the transitional period immediately following the disposals.
Encouragingly, performance improved during the year. The annualised revenue run-rate of the continuing trading businesses was approximately £6.0 million towards the end of 2024, but increased to approximately £9.6 million as the Group exited FY-2025. This improvement was driven primarily by an expanded product range and the onboarding of additional distribution partners, supporting the recovery and growth of the e-commerce platform. The £9.6 million exit run-rate signifies that after the divestment, the continuing business is now on a stable growth trajectory, with renewed focus and a strengthened offering. This momentum provides a solid foundation for future expansion, allowing us to scale revenues and profitability more sustainably in FY-2026 and beyond.
Revenues - Continuing operations |
|
| Continuing2025£'000 | Continuing2024£'000 |
More Computers - e-commerce |
| 7,198 | 7,406 | |
Systems Assurance - B2B Procurement and Managed Services |
| 793 | 911 | |
Total Revenue |
| 7,991 | 8,737 |
Revenues in the discontinued operations generated £1.6 million in 2025 and £18.8 million in 2024 Performance in 2025 relates solely to October 2024 when the two operations were sold.
Revenues - Discontinued operations | 2025£'000 | 2024£'000 |
Revenues generated by CloudCoCo Limited (Direct Sales) | 547 | 7,479 |
Revenues generated by CloudCoCo Connect Limited (Direct Sales) | 1,100 | 11,308 |
Discontinued operations | 1,647 | 18,787 |
Cost of Sales and Gross Profit
The Group's current trading is dominated by its e-commerce operations, primarily through MoreCoCo. A significant proportion of revenues are generated through Amazon and other online marketplaces, and the associated platform selling fees are reflected within cost of sales.
The Group operates primarily as an online drop-ship partner, meaning that products are supplied directly to customers by distribution partners rather than being held in the Group's own warehouse. This model allows the Group to avoid the capital and operational overheads associated with maintaining warehouse infrastructure and stock, while still providing customers with next-day delivery through established distribution networks.
Under this model, the Group effectively acts as a sales and fulfilment channel, and gross profit reflects the margin earned for facilitating these transactions. While the initial gross margin on hardware sales is typically around 16%, this reduces to 6.3% after marketplace fees, selling commissions and distribution costs are taken into account.
During the year, gross margin showed a modest improvement, rising from 5.3% in H2-2024 to 6.3% in H2-2025, with a peak of 6.7% in H1-2025, delivering an average margin of 6.5% for FY-2025, compared with 5.7% in FY-2024.
Although margins remain relatively modest in absolute terms, the improvement reflects a gradual shift in revenue mix and stronger commercial discipline, with management focusing on transactions that generate more sustainable returns.
Sales generated through the Group's direct website (https://morecoco.co.uk) typically achieve higher margins than those completed through third-party marketplaces. However, building brand recognition and customer acquisition through direct channels requires sustained investment in marketing and search engine optimisation. At present, the Group is taking a measured approach to this investment, focusing instead on steady growth through affiliate marketing, gaming partnerships and targeted promotional campaigns, including discount voucher programmes. The Group's cost base continues to be dominated by third-party product procurement, reflecting the nature of the e-commerce and IT hardware resale model.
For H1 FY-2025, gross profit remained stable at £0.23 million (H1 FY-2024: £0.23 million) despite lower revenues. This demonstrates improved commercial efficiency and pricing discipline. Gross margin for the period improved to 6% (H1 FY2024: 5%), reflecting:
· improved vendor pricing following renegotiations and new supplier onboarding;
· increased levels of automation within the order fulfilment process; and
· a continued shift toward higher-volume, low-touch e-commerce transactions.
| Continuing 2025 | Continuing 2024 | Discontinued 2025 | Discontinued 2024 |
£'000 | £'000 | £'000 | £'000 | |
Revenue | 7,991 | 8,737 | 1,647 | 18,787 |
Cost of sales | (7,473) | (8,238) | (1,125) | (11,671) |
Gross profit | 518 | 499 | 522 | 7,116 |
Gross margin % | 6.5% | 5.7% | 31.7% | 37.9% |
While e-commerce transactions typically deliver lower percentage margins than traditional direct sales, they benefit from significantly lower operational overheads and greater scalability, supporting the Group's strategy of prioritising automated, capital light revenue streams.
Administrative Expenses
Administrative expenses for continuing operations fell by 12% to £0.91 million (FY-2024: £1.04 million), reflecting management's continued focus on controlling operational overheads following the disposal of the legacy Managed IT Services businesses.
H2FY2025 | H1FY2025 | H2FY2024 | H1FY2024 | Year to 30 Sept2025 | Year to 30 Sept2024 | |
Continuing operations | (425) | (489) | (563) | (476) | (914) | (1,039) |
Discontinued operations | - | (485) | (4,451) | (4,461) | (485) | (8,912) |
Administrative Expenses | (425) | (974) | (5,014) | (4,937) | (1,399) | (9,951) |
The reduction in administrative expenses reflects the simplification of the Group's operating structure following the disposal, together with a continued focus on operational efficiency. Cost reductions during the period were achieved through:
· headcount rationalisation following the disposal of the legacy businesses;
· reduced professional and advisory costs; and
· lower operational overheads aligned with a simplified trading model.
· The use of automation and third-party applications to reduce manual labour.
Trading Group EBITDA
Trading Group EBITDA from continuing operations increased to £80k (FY-2024: £63k).
While EBITDA remains modest in absolute terms, the improvement reflects the benefits of continued cost discipline and operational focus within the streamlined business. Performance improved during the latter part of FY-2024, with EBITDA increasing from £21k in H1-24 to £42k in H2-24, reflecting operational improvements ahead of the disposal of the Infrastructure division.
In H1 FY-2025, EBITDA from continuing operations was £26k, demonstrating the ongoing profitability of the simplified business despite the smaller revenue base.
Operating within relatively low gross margins means that EBITDA generation is incremental, with trading surpluses typically reinvested into initiatives designed to improve future performance. These initiatives, which include supplier onboarding, platform improvements and process automation, often take several months to translate into revenue growth and margin expansion. Nevertheless, each project undertaken by the management team is intended to strengthen the long-term performance and scalability of the Group.
The improvement in continuing EBITDA reflects the combined impact of margin expansion, administrative cost reductions and increased operational automation. While Trading Group EBITDA remains modest, management views this performance as an important milestone in the Group's transition toward sustainable monthly cash generation.
H2-FY25 | H1-FY25 | H2-FY24 | H1-FY24 | FY25 | FY24 | |
Continuing operations | 54 | 26 | 42 | 21 | 80 | 63 |
Discontinued operations | - | 134 | 289 | 1,205 | 134 | 1,494 |
Trading Group EBITDA | 54 | 160 | 331 | 1,226 | 214 | 1,557 |
Discontinued operations generated £134k of EBITDA in FY-2025 prior to disposal, compared with £1.5m in FY-2024, highlighting the historical contribution of the Infrastructure division before its sale.
Plc Costs
Plc costs comprise the non-trading expenses associated with maintaining the Group's AIM listing and corporate governance structure, including Board remuneration, regulatory compliance and related professional fees.
Following the disposal of the legacy Managed IT Services businesses, plc costs reduced significantly as the Group began aligning its central cost base with the scale of the continuing operations.
Plc Costs | H2-FY25 | H1-FY25 | H2-FY24 | H1-FY24 | FY25 | FY24 |
Continuing operations | (155) | (199) | (251) | (221) | (354) | (472) |
Discontinued operations | - | (97) | (204) | (164) | (97) | (368) |
Plc Costs | (155) | (296) | (455) | (385) | (451) | (840) |
As part of this process, the Directors voluntarily agreed to temporary salary reductions from April 2025, reflecting their commitment to reducing the Group's cost burden while management focuses on strengthening the trading performance of the continuing business.
As a result, plc costs attributable to continuing operations reduced to £354k in FY-2025, compared with £472k in FY-2024. While these costs remain a meaningful component of the Group's overall expenditure, management continues to review opportunities to further optimise the corporate cost base while maintaining the governance standards expected of an AIM-listed company.
The salary reductions implemented during FY-2025 are expected to deliver additional annualised savings of approximately £0.1 million, further aligning plc-level costs with the scale and profitability of the continuing operations. Finance Costs and Exceptional Items Finance costs from continuing operations reduced significantly to £6k in FY-2025 (FY-2024: £14k), reflecting the Group's improved capital position following the disposal of the Infrastructure division and the reduction in associated borrowing requirements.
In prior periods, finance costs were materially higher due to funding arrangements connected with the Infrastructure businesses, which are now reported as discontinued operations.
During FY-2024, the Group recorded exceptional costs of £481k, primarily relating to strategic review activities and transaction costs associated with the disposal of the Infrastructure division. No exceptional items were recorded in FY-2025, reflecting the completion of these restructuring activities.
TaxationThe Group recorded a tax credit of £20k in FY-2025, consistent with FY-2024.
The credit primarily reflects the utilisation of carried-forward tax losses together with adjustments relating to prior periods. A small tax credit was recognised in H1 FY-2025, consistent with the treatment in prior periods and reflecting timing differences within the Group's tax position.
The Group's effective tax rate continues to be influenced by the availability of brought-forward tax losses and the profitability profile of the continuing operations.
Statement of Financial Position and Cash Following the disposal of the Infrastructure division, the Group generated in excess of £1 million of cash proceeds. Management took the decision to utilise these funds to re-capitalise the continuing trading businesses, restore supplier payment terms and provide the operational liquidity required to support future growth.
Part of the available cash resources was also used to fund the difference between Trading Group EBITDA and plc-level costs, reflecting the Group's transitional phase following the disposal.
Discontinued operations generated a net cash outflow of £214k in FY-2025, representing the final operating and transaction-related cash movements prior to completion of the disposal.
Despite these transitional cash movements, the Group maintained a strong liquidity position, with cash of £818k at 31 March 2025, compared with £606k at the same point in the prior year. The Group's balance sheet strengthened significantly following the disposal of the Infrastructure division. At 30 September 2025, the Group reported net assets of £495k, compared with negative £2.1 million, at 30 September 2024.
Prior to disposal, the Infrastructure division had been classified as assets held for sale of £15.0m, with associated liabilities of £11.6m. These balances were removed from the Group's balance sheet following completion of the transaction.
As a result, the Group enters the new financial year with a simplified balance sheet, improved liquidity and a stronger financial position, providing a solid platform from which to pursue future growth opportunities.
OutlookThe Board considers FY-2025 to have been a foundational year following the Group's strategic transformation and the disposal of the Infrastructure division. While revenues remain below the level required to fully absorb plc-level costs, the operational improvements delivered during the year, including margin enhancement, cost reductions and a strengthened balance sheet, provide a clearer pathway toward sustainable profitability as revenues continue to scale.
The Group's recently completed fund raise provides additional working capital to support the continued development of the trading business, enabling management to invest selectively in initiatives designed to accelerate revenue growth and improve operational efficiency.In parallel, the Group has launched Project Brightstar, an internal programme focused on enhancing the Group's commercial B2B capability, expanding vendor relationships and improving the scalability of its e-commerce and procurement platforms.
Looking ahead, the Group remains focused on growing e-commerce volumes, strengthening vendor and distribution partnerships, and expanding consultancy and partnership-led revenue streams. Together with the initiatives being delivered through Project Brightstar, these actions are expected to support continued revenue growth and operational leverage, enabling the Group to progress toward consistent monthly cash generation and improved shareholder value.
Consolidated income statement
for the year ended 30 September 2025
Note | Group2025£'000 | Group2024£'000 | Continuing2025£'000 | Continuing2024£'000 | Discontinued2025£'000 | Discontinued2024£'000 | |
Revenue | 3 | 9,638 | 27,524 | 7,991 | 8,737 | 1,647 | 18,787 |
Cost of sales | (8,598) | (19,909) | (7,473) | (8,238) | (1,125) | (11,671) | |
Gross profit |
| 1,040 | 7,615 | 518 | 499 | 522 | 7,116 |
Administrative expenses | (1,399) | (9,951) | (914) | (1,039) | (485) | (8,912) | |
Trading Group EBITDA 1 | 214 | 1,557 | 80 | 63 | 134 | 1,494 | |
Amortisation of intangible assets | 9 | (79) | (861) | (79) | (105) | - | (756) |
Plc costs2 | (451) | (840) | (354) | (472) | (97) | (368) | |
Depreciation of IFRS16 datacentre right of use assets | 10 | - | (1,392) | - | (14) | - | (1,378) |
Depreciation of tangible assets and other right of use assets | 10 | (41) | (293) | (41) | (1) | - | (292) |
Exceptional items | 4 | - | (481) | - | - | - | (481) |
Share-based payments | (2) | (26) | (2) | (11) | - | (15) | |
Operating loss | 5 | (359) | (2,336) | (396) | (540) | 37 | (1,796) |
Interest receivable | 6 | 14 | 1 | 14 | 1 | - | - |
Interest payable | 6 | (141) | (1,033) | (6) | (14) | (135) | (1,019) |
Loss before taxation |
| (486) | (3,368) | (388) | (553) | (98) | (2,815) |
Taxation | 7 | 20 | 215 | 20 | 20 | - | 195 |
Loss from operations | (466) | (3,153) | (368) | (533) | (98) | (2,620) | |
Profit from sale of discontinued operations (net of tax) | 13 | 3,051 | - | - | - | 3,051 | - |
Profit/(loss) and total comprehensive profit/(loss) for the year attributable to owners of the parent | 2,585 | (3,153) | (368) | (533) | 2,953 | (2,620) | |
Profit/(loss) per share |
| ||||||
Basic and fully diluted | 8 | 0.37p | (0.45)p | (0.05)p | (0.08)p | 0.42p | (0.37)p |
1 profit or loss before net finance costs, tax, depreciation, amortisation, plc costs, exceptional items and share-based payments.
2 Plc costs are non-trading costs relating to the Board of Directors of the Parent Company, the costs of being listed on the AIM Market of the London Stock Exchange and associated professional costs.
Consolidated statement of financial position as at 30 September 2025
September | September | ||
2025 | 2024 | ||
£'000 | £'000 | ||
Non-current assets |
|
| |
Intangible assets | 9 | 720 | 799 |
Property, plant and equipment | 10 | 55 | 85 |
Right of Use assets | 10 | 11 | 3 |
Total non-current assets | 786 | 887 | |
Current assets |
| ||
Inventories | 101 | 76 | |
Trade and other receivables | 581 | 516 | |
Contract assets | 9 | - | |
Cash and cash equivalents | 635 | 1,042 | |
Current assets excluding assets held for sale | 1,326 | 1,634 | |
Assets classified as held for sale | - | 14,976 | |
Total current assets | 1,326 | 16,610 | |
Total assets | 2,112 | 17,497 | |
Current liabilities |
| ||
Trade and other payables | (1,394) | (1,690) | |
Borrowings | (67) | (6,085) | |
Lease liability | (11) | (3) | |
Current liabilities excluding those associated with assets held for sale | (1,472) | (7,778) | |
Liabilities associated with assets held for sale | - | (11,575) | |
Total current liabilities | (1,472) | (19,353) | |
Non-current liabilities |
| ||
Borrowings | (29) | (100) | |
Deferred tax liability | 12 | (116) | (136) |
Total non-current liabilities | (145) | (236) | |
Total liabilities | (1,617) | (19,589) | |
Net assets | 495 | (2,092) | |
Equity |
| ||
Share capital | 7,062 | 7,062 | |
Share premium account | 17,630 | 17,630 | |
Capital redemption reserve | 6,489 | 6,489 | |
Merger reserve | 1,997 | 1,997 | |
Other reserve | 184 | 341 | |
Retained earnings | (32,867) | (35,611) | |
Total equity (see note 27 for post balance sheet event) | 495 | (2,092) |
Consolidated statement of changes in equity
for the year ended 30 September 2025
Share capital £'000 | Share premium £'000 | Capital redemption reserve £'000 | Merger reserve £'000 | Other reserve £'000 | Retained earnings £'000 | Total £'000 | |
At 1 October 2023 | 7,062 | 17,630 | 6,489 | 1,997 | 370 | (32,513) | 1,035 |
Loss and total comprehensive loss for the period | - | - | - | - | - | (3,153) | (3,153) |
Transactions with owners in their capacity of owners | |||||||
Share-based payments | - | - | - | - | 26 | - | 26 |
Share options lapsed | - | - | - | - | (55) | 55 | - |
Total transactions with owners | - | - | - | - | (29) | 55 | 26 |
Total movements | - | - | - | - | (29) | (3,098) | (3,127) |
Equity at 30 September 2024 | 7,062 | 17,630 | 6,489 | 1,997 | 341 | (35,611) | (2,092) |
Share capital £'000 | Share premium £'000 | Capital redemption reserve £'000 | Merger reserve £'000 | Other reserve £'000 | Retained earnings £'000 | Total £'000 | |
At 1 October 2024 | 7,062 | 17,630 | 6,489 | 1,997 | 341 | (35,611) | (2,092) |
Loss and total comprehensive profit for the period | - | - | - | - | - | 2,585 | 2,585 |
Transactions with owners in their capacity of owners | |||||||
Share-based payments | - | - | - | - | 2 | - | 2 |
Share options lapsed | - | - | - | - | (159) | 159 | - |
Total transactions with owners | - | - | - | - | (157) | 159 | 2 |
Total movements | - | - | - | - | (157) | 2,744 | 2,587 |
Equity at 30 September 2025 | 7,062 | 17,630 | 6,489 | 1,997 | 184 | (32,867) | 495 |
Consolidated statement of cash flows for the year ended 30 September 2025
2025 £'000 | 2024 £'000 | |
Cash flows from operating activities | ||
Loss before taxation | (486) | (3,368) |
Adjustments for: |
| |
Depreciation - IFRS data centre right of use assets | - | 1,392 |
Depreciation - other right of use assets | 11 | 140 |
Depreciation - owned assets | 30 | 153 |
Amortisation | 79 | 861 |
Share-based payments | 2 | 26 |
Net finance expense | 127 | 1,032 |
Movements in provisions | - | (133) |
(Increase) / decrease in trade and other receivables | (65) | 522 |
(Increase) / decrease in inventories | (25) | (20) |
(Decrease) / increase in trade payables, accruals and contract liabilities | (238) | 929 |
Net cash (outflow) / inflow from operating activities | (565) | 1,534 |
Net cash (outflow) / inflow from discontinued operations: | (615) | 391 |
Cash flows from investing activities |
| |
Sale of subsidiary undertakings | 7,067 | - |
Purchase of property, plant and equipment (note 10) | - | (57) |
Payment of deferred consideration relating to acquisitions | (50) | (50) |
Interest received | 14 | 1 |
Net cash outflow from investing activities | 7,031 | (106) |
Cash flows from financing activities |
| |
Repayment of loan notes | (6,187) | - |
Repayment of COVD-19 bounce-back loan | (23) | (16) |
Payment of lease liabilities | (13) | (1,504) |
Interest paid | (35) | (51) |
Net cash outflow from financing activities | (6,258) | (1,571) |
Net increase / (decrease) in cash | (407) | 248 |
Cash at bank and in hand at beginning of period | 1,042 | 794 |
Cash at bank and in hand at end of period | 635 | 1,042 |
Comprising: |
| |
Cash at bank and in hand - assets held for sale | - | 855 |
Cash at bank and in hand - continuing operations | 635 | 187 |
Cash at bank and in hand at end of period | 635 | 1,042 |
Notes to the consolidated financial statements
1. General information
CloudCoCo Group plc is a public limited company incorporated and domiciled in England and Wales under the Companies Act 2006. The address of the registered office is given on the back cover of this report. The principal activity of the Group is the provision of IT Services to small and medium-sized enterprises in the UK. The financial statements are presented in pounds sterling (rounded to the nearest thousand (£'000)) because that is the currency of the primary economic environment in which each of the Group's subsidiaries operates.
1.1 Basis of preparation
The consolidated financial statements have been prepared in accordance with UK-adopted international accounting standards. The measurement bases and principal accounting policies of the Group are set out below. These policies have been consistently applied to all years presented unless otherwise stated.
Going concern
The Group had net assets of £0.5 million at 30 September 2025 (2024: net liabilities of £2.1 million). As detailed in Note 13, on 31 October 2024 the Group disposed of CloudCoCo Limited and CloudCoCo Connect Limited for total consideration of £7.37 million. The proceeds from this transaction replenished the Group's cash reserves and enabled the full repayment of the MXC Loan Notes, leaving the Group free from long-term debt and significantly strengthening its financial position.
Following the disposal, the Group continues to trade through its e-commerce platform (morecoco.co.uk) and outsourced procurement businesses and has re-focused its Systems Assurance activities. These continuing operations are expected to generate a positive contribution towards Plc costs, which have been reduced following the Group's restructuring.
In assessing the Group's ability to continue as a going concern, the Directors have reviewed detailed budgets, forecast sales growth and cash flow projections covering the period to 31 March 2027. This assessment includes sensitivity analysis on key assumptions, including the impact of reduced sales volumes and slower cash receipts. The forecasts reflect the Group's reduced cost base, improved cash cycle and current liquidity position.
The key operational risks faced by the Group include the general UK economic outlook, inflationary pressures and their potential impact on consumer spending and investment in IT infrastructure. The Directors have taken mitigating actions to reduce ongoing operational costs and closely manage working capital and cash resources.
Based on this assessment, the Directors have a reasonable expectation that the Group and the Company have adequate resources to continue in operational existence for a period of at least twelve months from the date of approval of these financial statements. Accordingly, the financial statements have been prepared on the going concern basis. 1.2 New standards and interpretations of existing standards that have been adopted by the Group for the first time
- Lease Liability in a Sale and Leaseback (Amendments to IFRS 16)- Classification of Liabilities as Current or Non-Current and Non-current Liabilities with Covenants (Amendments to IAS 1)- Supplier Finance Arrangements (Amendments to IAS 7 and IFRS 7)
The amendments either clarified existing requirements or were not applicable to the Group's activities during the period. The Group did not enter into any material sale and leaseback transactions, does not operate material supplier finance arrangements, and had no borrowings subject to covenant-driven classification at the reporting date.
1.3 New standards and interpretations of existing standards that are not yet effective and have not been adopted early by the Group
At the date of approval of these financial statements, the following standards and amendments had been issued but were not yet effective and had not been adopted early by the Group:
- IFRS 18 Presentation and Disclosure in Financial Statements (effective for periods beginning on or after 1 January 2027)
- Amendments to IFRS 9 and IFRS 7 Classification and Measurement of Financial Instruments (effective for periods beginning on or after 1 January 2026)
The Directors are currently assessing the impact of these standards on the Group's financial statements. The adoption of these standards is not expected to have a material impact on the Group's results or financial position, although IFRS 18 will affect the presentation and disclosure of information in the financial statements.
2. Principal accounting policies
a) Basis of consolidation
The Group financial statements incorporate the financial statements of the Company and entities controlled by the Company (its subsidiaries), prepared to 30 September each year. Control exists where the Company is exposed to, or has rights to, variable returns from its involvement with an investee and has the ability to affect those returns through its power over the investee. Control is generally obtained through voting rights.
The results and financial position of subsidiaries are included in the consolidated financial statements from the date on which control is obtained and are deconsolidated from the date on which control ceases.
Unrealised gains on transactions between the Group and its subsidiaries are eliminated in full. Unrealised losses are also eliminated unless the transaction provides evidence of an impairment of the asset transferred. Amounts reported in the financial statements of subsidiaries have been adjusted where necessary to ensure consistency with the accounting policies adopted by the Group.
Business combinations are accounted for using the acquisition method. The cost of an acquisition is measured as the fair value of the consideration transferred at the acquisition date. Identifiable assets acquired and liabilities assumed, including contingent liabilities that meet the recognition criteria of IFRS 3, are recognised at their fair values at the acquisition date.
Goodwill arising on the acquisition of a subsidiary represents the excess of the consideration transferred over the Group's interest in the fair value of the identifiable net assets acquired at the acquisition date. Goodwill is recognised as an asset and is subsequently measured at cost less accumulated impairment losses.
b) Goodwill
Goodwill representing the excess of the cost of acquisition over the fair value of the Group's share of the identifiable net assets acquired is capitalised and reviewed annually for impairment. Goodwill is carried at cost less accumulated impairment losses. Refer to principal accounting policy (k) for a description of impairment testing procedures.
c) Revenue and revenue recognition
Revenue arises from the sale of goods and the rendering of services as performance obligations are satisfied. Revenue is measured at the transaction price, being the amount of consideration to which the Group expects to be entitled in exchange for transferring promised goods or services to a customer, excluding value added tax, rebates, trade discounts and other sales-related taxes.
The Group enters into contracts for a range of products and services, including the delivery of hardware, software, support services, managed services and professional services. At contract inception, the Group assesses the goods or services promised to the customer and identifies the separately identifiable performance obligations within the contract. Performance obligations may comprise distinct goods or services or a series of distinct goods or services that are substantially the same and transferred to the customer over time.
Where a contract includes multiple performance obligations, the transaction price is allocated to each performance obligation based on the relative stand-alone selling prices of the goods or services promised.
A contract liability is recognised when consideration is received or receivable from a customer before the Group transfers the related goods or services. A contract asset is recognised when the Group has transferred goods or services to a customer but does not yet have an unconditional right to consideration. Sale of goods (hardware and software)
Revenue from the sale of goods is recognised at the point in time when control of the goods transfers to the customer. Revenue from the sale of software with no significant service or support obligation is recognised on delivery, which is the point at which the customer is able to use and obtain substantially all of the benefits from the software.
Rendering of services
The Group generates revenue from managed services, support services and professional services ("Managed IT Services").
Revenue from managed and support services is recognised over time, as the customer simultaneously receives and consumes the benefits provided by the Group's performance. These services are typically provided under contracts of 12 months' duration and revenue is recognised on a straight-line basis over the contract term, which reflects the pattern of service delivery.
Revenue from professional services is recognised over time as the services are performed, measured using a time-based input method based on hours incurred. Contract acquisition and fulfilment costs
Incremental costs of obtaining a contract, such as sales commissions that would not have been incurred if the contract had not been obtained, are capitalised as contract assets where the Group expects to recover those costs. These costs are amortised on a straight-line basis over the period in which the related goods or services are transferred to the customer.
Certain costs incurred to fulfil contracts, including internal technical resources utilised in setting up recurring managed services contracts, are capitalised as contract assets where they relate directly to a contract, generate or enhance resources that will be used to satisfy performance obligations in the future, and are expected to be recovered. These costs are amortised over the period of benefit, typically the contractual term.d) Foreign currencies
Transactions in foreign currencies are translated into the Group's functional currency at the exchange rates ruling at the dates of the transactions. Monetary assets and liabilities denominated in foreign currencies are translated at the exchange rates ruling at the statement of financial position date. Exchange differences arising on settlement or translation are recognised in the Consolidated Income Statement.
e) Property, plant and equipment
Property, plant and equipment are stated at cost less accumulated depreciation and accumulated impairment losses. The depreciation policy is contained in principal accounting policy (i).
f) Right of use assets
A right-of-use asset is recognised at the commencement date of a lease. The right-of-use asset is measured at cost, which comprises the initial amount of the lease liability, adjusted for any lease payments made at or before the commencement date, less any lease incentives received, and including any initial direct costs incurred.
Right-of-use assets are depreciated on a straight-line basis over the shorter of the lease term and the estimated useful life of the underlying asset. Where the Group expects to obtain ownership of the leased asset at the end of the lease term, depreciation is charged over the estimated useful life of the asset. Right-of-use assets are subject to impairment and are adjusted for any remeasurement of the related lease liabilities.
The Group has elected not to recognise right-of-use assets and corresponding lease liabilities for short-term leases with a lease term of 12 months or less and leases of low-value assets. Payments associated with these leases are recognised as an expense on a straight-line basis over the lease term. g) Disposal of assets
The gain or loss arising on the disposal of an asset is determined as the difference between the disposal proceeds and the carrying amount of the asset and is recognised in the Consolidated Income Statement in the period in which the disposal occurs.
h) Exceptional items and Plc costs
Non-recurring items which are material either because of their size or their nature, are highlighted separately on the face of the Consolidated Income Statement. The separate reporting of these items helps provide a better picture of the Group's underlying performance. Items which may be included within this category include, but are not limited to, acquisition costs, spend on the integration of significant acquisitions and other major restructuring or rationalisation programmes, significant goodwill or other asset impairments and other particularly significant or unusual items.
Exceptional items are excluded from the performance measures used by management to assess the underlying performance of the Group and are highlighted separately in the Consolidated Income Statement, as management believe that separate disclosure is necessary to provide an understanding of the Group's underlying trading performance. Note 4 contains more detail on exceptional items.
Plc costs are non-trading costs, relating to the Board of Directors of the Parent Company, the costs of being listed on the AIM Market of the London Stock Exchange and its associated professional advisors.
i) Depreciation
Depreciation is calculated on a straight-line basis so as to write off the cost of an asset, less its estimated residual value, over the useful economic life of that asset as follows:
IT equipment - three to four yearsFixtures, fittings and leasehold improvements - three to four yearsE-commerce platform - three to four yearsRight of use asset - over the remaining term of the lease
Material residual value estimates are updated as required, but at least annually.
j) Intangible assets
Intangible assets mainly comprise the fair value of customer bases and other identifiable assets acquired which are not included on the balance sheets of the acquired companies. A fair value calculation is carried out based on evaluating the net recurring income stream from each type of intangible asset. Intangible assets are initially recognised at fair value, and are subsequently carried at this fair value, less accumulated amortisation and impairment. The following items were identified as part of the acquisitions of entities by the Group and were still owned at 30 September 2025:
· Billing and website systems amortised over three years;
· customer lists amortised over five to ten years; and
· brands amortised over ten years.
Judgement is used in the allocation of fair values to the tangible assets and the identification and valuation of intangible assets which affect the calculation of goodwill recognised in respect of an acquisition. Refer to principal accounting policy (j).
k) Impairment testing of goodwill, other intangible assets and property, plant and equipment
For the purposes of assessing impairment, assets are grouped at the lowest levels for which there are separately identifiable cash inflows (cash generating units). As a result, some assets are tested individually for impairment and some are tested at cash generating unit ("CGU") level. Goodwill is allocated to those CGUs that are expected to benefit from the synergies of the related business combination and represent the lowest level within the Group at which management monitors the related cash flows.
Impairment reviews are carried out using multi-year cash flow projections from the approved budgets of the Group. These are discounted using a discount rate specific to each CGU. Forecast cash flows beyond 5 years assume steady growth at no more than the long-term average growth rate for the United Kingdom. The discount rate for each CGU reflects the time value of money and the nature and risks of the CGU.
An impairment loss is recognised where the carrying amount of an asset or CGU exceeds its recoverable amount. The recoverable amount is the higher of fair value less costs of disposal and value in use, determined using discounted cash flow projections. Impairment losses are recognised in the Consolidated Income Statement and reduce the carrying amount of the relevant asset. With the exception of goodwill, assets are reassessed at each reporting date for indications that an impairment loss previously recognised may no longer exist. l) Leases
A lease liability is recognised at the commencement date of a lease and is initially measured at the present value of the lease payments over the lease term, discounted using the interest rate implicit in the lease or, where this cannot be readily determined, the Group's incremental borrowing rate. Lease payments include fixed payments, variable payments that depend on an index or rate, amounts expected to be payable under residual value guarantees, and payments arising from options to purchase or terminate the lease where the Group is reasonably certain to exercise those options. Variable lease payments that do not depend on an index or rate are recognised in profit or loss as incurred.
Lease liabilities are subsequently measured at amortised cost using the effective interest method and are remeasured when there is a change in future lease payments, the lease term, or the assessment of purchase or termination options. Any remeasurement is recognised as an adjustment to the corresponding right-of-use asset, or in profit or loss where the right-of-use asset has been fully written down.m) Inventories and work in progress Inventories are stated at the lower of cost and net realisable value, after making due allowance for obsolete and slow moving items. The cost is calculated using the FIFO basis. Work in progress relates to costs incurred on part-completed work.
n) Taxation
Current tax is the tax currently payable based on taxable results for the year. Deferred income taxes are calculated using the liability method on temporary differences. Deferred tax is generally provided on the difference between the carrying amounts of assets and liabilities and their tax bases. However, Deferred tax is not recognised on temporary differences arising from the initial recognition of goodwill or from the initial recognition of assets and liabilities in a transaction that is not a business combination and that affects neither accounting nor taxable profit.
In addition, tax losses available to be carried forward as well as other income tax credits to the Group are assessed for recognition as deferred tax assets. Deferred tax liabilities are provided in full, with no discounting. Deferred tax assets are recognised to the extent that it is probable that the underlying deductible temporary differences will be able to be offset against future taxable income. Current and deferred tax assets and liabilities are calculated at tax rates that are expected to apply to their respective period of realisation, provided they are enacted or substantively enacted at the reporting date.
Changes in deferred tax assets or liabilities are recognised as a component of tax expense in the Consolidated Income Statement, except where they relate to items that are charged or credited directly to equity, in which case the related deferred tax is also charged or credited directly to equity.
o) Financial assets
Financial assets comprise of cash and cash equivalents and trade and other receivables. All financial assets are initially recognised at fair value, plus transaction costs and subsequently measured at amortised cost.
Trade receivables are held in order to collect the contractual cash flows and are initially measured at the transaction price as defined in IFRS 15, as the contracts of the Group do not contain significant financing components. Impairment losses are recognised based on lifetime expected credit losses in profit or loss.
The Group reviews the amount of credit loss associated with its trade receivables based on forward looking estimates, taking into account current and forecast credit conditions.
All financial assets are recognised when the Group becomes a party to the contractual provisions of the instrument. Derecognition of financial assets occurs when the rights to receive cash flows from the instruments expire or are transferred and substantially all of the risks and rewards of ownership have been transferred. An assessment for impairment is undertaken, at least, at each reporting date.
Interest and other cash flows resulting from holding financial assets are recognised in the Consolidated Income Statement when receivable.
p) Cash and cash equivalents
Cash at bank and in hand comprises cash on hand and demand deposits.
q) Financial liabilities
Financial liabilities comprise trade and other payables, lease liabilities and borrowings. Financial liabilities are recognised when the Group becomes a party to the contractual provisions of the instrument. Financial liabilities are initially recognised at fair value and are subsequently measured at amortised cost using the effective interest method.
Finance charges, including interest, premiums payable on settlement or redemption, and directly attributable transaction costs, are recognised as finance costs in the Consolidated Income Statement using the effective interest method and are added to the carrying amount of the financial liability to the extent that they are not settled in the period in which they arise.
The modification of the terms of a financial liability is accounted for as an extinguishment of the original liability and the recognition of a new liability where the modification is substantial. A modification is considered substantial if the net present value of the cash flows under the modified terms, including any fees paid or received, differs by at least 10 per cent from the net present value of the remaining cash flows of the original liability, both discounted using the original effective interest rate r) Issued share capital
Ordinary shares are classified as equity. Incremental costs attributable to the issue of shares or options are recorded in equity as a deduction from proceeds.
s) Non-current assets held for sale Non-current assets and disposal groups are classified as held for sale when they are actively marketed, management is committed to selling, and a sale is expected within 12 months. These assets are measured at the lower of their carrying amount and fair value less disposal costs and are not depreciated once classified. The results of disposed operations are included in the consolidated statement of comprehensive income up to the disposal date but are shown separately in order to identify the profit/(loss) associated with the discontinued operations.
t) Employee benefits
Share-based payment - equity-settled
All material share-based payment arrangements are recognised in the financial statements. All goods and services received in exchange for the grant of any share-based remuneration are measured at their fair values. Fair values of employee services are indirectly determined by reference to the fair value of the share options awarded, excluding those that have lapsed as a result of staff leaving the company. Their value is appraised at the grant date and excludes the impact of non-market vesting conditions (for example, profitability and sales growth targets).
All share-based remuneration is ultimately recognised as an expense in the Consolidated Income Statement with a corresponding credit to "other reserve". If vesting periods or other non-market vesting conditions apply, the expense is allocated over the vesting period, based on the best available estimate of the number of share options expected to vest. Estimates are subsequently revised if there is any indication that the number of share options expected to vest differs from previous estimates.
Any cumulative adjustment prior to vesting is recognised in the current period. No adjustment is made to any expense recognised in prior periods if share options ultimately exercised are different to that estimated on vesting.
Upon exercise of share options, the proceeds received, net of attributable transaction costs, are credited to share capital and share premium.
Share-based payment - modification, cancellation and issue of replacement awards.
If equity-settled awards are modified, as a minimum an expense is recognised as if the modification has not been made. An additional expense is recognised, over the remaining vesting period, for any modification that increases the total fair value of the share-based compensation benefit as at the date of modification. u) Pension
The Group makes payments to defined contribution retirement benefit plans that are charged as an expense as they fall due. Payments are made on the basis of a percentage of qualifying salary for certain employees to personal pension schemes.
v) Government Grants
The Group received funding from various Government sources in relation to COVID-19 in FY22. Government income is recognised in profit or loss (within other income) on a systematic basis over the periods in which the Group recognises costs for which the grants are intended to compensate. Where it is not yet considered highly probable that Government funding will not have to be repaid, this element is deferred on the balance sheet within other creditors.
w) Critical accounting judgements and key sources of estimation uncertainty
The preparation of the Group's consolidated financial statements requires management to make judgements, estimates and assumptions that affect the application of accounting policies and the reported amounts of assets and liabilities at the reporting date. Actual results may differ from these estimates. Critical judgements in applying the Group's accounting policies
The following are the critical judgements that management has made in the process of applying the Group's accounting policies and that have the most significant effect on the amounts recognised in the consolidated financial statements.
Business combinations and goodwill allocation The allocation of fair values to tangible assets and the identification and valuation of intangible assets acquired in a business combination require judgement in the selection of appropriate valuation techniques and inputs. These judgements affect the amount of goodwill recognised and the allocation of goodwill to cash-generating units ("CGUs"), being the lowest level at which management monitors goodwill for internal management purposes. Further details are disclosed in note 9.
Assessment of lease arrangements Judgement is required in determining whether arrangements for dark fibre connections contain a lease within the scope of IFRS 16. Management concluded that, except for any last-mile connections between a supplier's core network and the Group's customers, the Group does not control the use of specific identified fibre assets or a significant portion of a supplier's network, and therefore such arrangements do not give rise to the recognition of a right-of-use asset and corresponding lease liability.
Judgement is also applied in determining the lease term for data centre lease arrangements, including the assessment of extension and termination options. Management has further exercised judgement in assessing whether right-of-use assets are recoverable or whether any onerous contract provisions are required in respect of data centre lease arrangements.
Key sources of estimation uncertainty
The key assumptions concerning the future and other sources of estimation uncertainty at the reporting date that have a significant risk of resulting in a material adjustment to the carrying amounts of assets and liabilities within the next financial year are set out below.
Impairment of goodwill and intangible assets Goodwill is tested annually for impairment and other intangible assets are tested for impairment when there is an indication that their carrying amount may not be recoverable. The impairment tests require the estimation of future cash flows attributable to the relevant CGUs or assets and the selection of appropriate pre-tax discount rates that reflect current market assessments of the time value of money and the risks specific to the asset or CGU. Changes in these assumptions could result in a material impairment charge. Further details of the impairment testing methodology are set out in principal accounting policy (k) and note 9
Valuation of customer relationships Customer relationships recognised as intangible assets are valued using discounted cash flow techniques, which require estimates of future revenue streams, customer retention rates and appropriate discount rates over the expected useful economic life of the assets. Retention rates are based on historical customer behaviour, adjusted where necessary for current and forecast market conditions. Changes in these assumptions could result in a material adjustment to the carrying value of customer relationship intangible assets. Further details are provided in note 9.
Incremental borrowing rate Where the interest rate implicit in a lease cannot be readily determined, the Group estimates an incremental borrowing rate to discount future lease payments when measuring the lease liability at the commencement date of the lease. The incremental borrowing rate represents the rate that the Group would have to pay to borrow funds to obtain an asset of a similar value to the right-of-use asset, over a similar term and with similar security, in a similar economic environment. An incremental borrowing rate of 10% per annum was applied in measuring lease liabilities and the corresponding right-of-use assets. Changes to this rate could have a material impact on the carrying amounts of lease liabilities and right-of-use assets.
3. Segment reporting
The Chief Operating Decision Maker ("CODM") has been identified as the executive director of the Company, who review the Group's internal management reporting in order to assess performance and allocate resources.
The CODM assesses the Group's performance principally using adjusted profit measures, including Trading Group EBITDA, which are consistent with those disclosed elsewhere in the Annual Report and Accounts. A reconciliation between Trading Group EBITDA and the statutory operating loss is presented in the Consolidated Income Statement.
The Board has determined that the Group operates as a single operating and reporting segment, being the provision of IT products and services to customers. This conclusion is based on the fact that the Group's activities are managed on a consolidated basis, and that the operating costs and operating asset base used to generate revenues are shared across the business and are not separately reviewed by the CODM for the purposes of resource allocation or performance assessment.
For the purposes of internal management reporting, the CODM reviews revenues and related gross profit by the following revenue categories, which do not represent separate operating segments:
Managed IT Services | - This category comprises the provision of recurring IT services which either have an ongoing billing and support element or utilise the technical expertise of our people. |
Value added resale | - This category comprises the resale of one-time solutions (hardware and software) from our leading technology partners, including revenues from the More Computers e-commerce platform. |
All revenues are derived from customers within the UK and no customer accounts for more than 10% of external revenues in both financial years. Inter-category transactions are accounted for using an arm's length commercial basis.
3.1 Analysis of continuing results
All revenues from continuing operations are derived from customers within the UK. In order to simplify our reporting of revenue, we condense our reporting segments into two categories - Managed IT Services and Value Added Resale. This analysis is consistent with that used internally by the CODM and, in the opinion of the Board, reflects the nature of the revenue. Trading EBITDA1 is reported as a single segment. 3.1.1 Revenue
Continuing2025£'000 | Continuing2024£'000 | Discontinued2025£'000 | Discontinued2024£'000 | |
Managed IT Services | 246 | 420 | 1,306 | 16,236 |
Value added resale | 7,745 | 8,317 | 341 | 2,551 |
Total Revenue | 7,991 | 8,737 | 1,647 | 18,787 |
3.1.2 Revenue
Continuing2025£'000 | Continuing2024£'000 | Discontinued2025£'000 | Discontinued2024£'000 | |
Recognised over time | 246 | 420 | 1,277 | 15,283 |
Recognised at a point in time | 7,745 | 8,317 | 370 | 3,504 |
Total Revenue | 7,991 | 8,737 | 1,647 | 18,787 |
4. Exceptional Items
Items which are material and non-routine in nature are presented as exceptional items in the Consolidated Income Statement.
Discontinued 2025 £'000 | Discontinued 2024 £'000 | ||
Costs relating to re-finance of the loan notes | - | (40) |
|
Run-off costs relating to discontinued data centre services | - | (353) | |
Costs relating to onerous contracts settled in the year | - | (18) | |
Integration and restructure costs | - | (70) |
|
Exceptional items | - | (481) |
|
Integration and restructure costs relate to notice period, redundancy, holiday pay and severance payments made to staff whose roles were duplicate or whose employment was terminated during the year as part of the internal reorganisation. Run-off costs relating to discontinued data centre services contain unrecoverable operating expenses incurred during the year for data centre racks that were empty on acquisition. Costs associated with exploring options relating to the search for re-finance of the loan notes have also been separately identified as have costs relating to onerous contracts settled during the year. 5. Operating loss
Continuing2025£'000 | Continuing 2024£'000 | Discontinued 2025£'000 | Discontinued 2024£'000 | |
Operating loss is stated after charging: | ||||
Depreciation of owned assets | 30 | 26 | - | 127 |
Depreciation of right of use assets | 11 | 13 | - | 1,519 |
Short life lease expense: IFRS16 data centre short-life leases | - | - | - | 446 |
Amortisation of intangibles | 79 | 105 | - | 756 |
Auditor's remuneration: | ||||
- Audit of parent company | 40 | 35 | - | - |
- Audit of subsidiary companies | 14 | 15 | - | 48 |
6. Finance income and finance costs
Finance cost includes all interest-related income and expenses. The following amounts have been included in the Consolidated Income Statement line for the reporting periods presented:
Continuing2025 £'000 | Continuing2024 £'000 | Discontinued2025 £'000 | Discontinued2024 £'000 | |
Interest income resulting from short-term bank deposits | 14 | 1 | - | - |
Finance income | 14 | 1 | - | - |
Interest expense resulting from: |
|
| ||
Lease liabilities | 1 | 1 | 3 | 46 |
Interest on borrowings | 5 | 13 | 1 | 27 |
Loan note interest | - | - | 131 | 846 |
Unwinding of the discount on provisions | - | - | - | 100 |
Finance costs | 6 | 14 | 135 | 1,019 |
The £5.0 million MXC Loan Notes, together with accumulated deferred interest of £1.18 million, were repaid in full on 31 October 2024 following the disposal of CloudCoCo Limited and CloudCoCo Connect Limited. As a result, no further interest accrued on the loan notes after this date. Further details are provided in Note 11.
7. Income tax | 2025 £'000 | 2024 £'000 |
Current tax |
| |
UK corporation tax for the period at 25% (2024: 25%) | - | - |
Deferred tax |
| |
Deferred tax credit on intangible assets | 20 | 215 |
Total tax credit for the year | 20 | 215 |
The tax credit recognised in the Consolidated Income Statement can be reconciled as follows:
2025 £'000 | 2024 £'000 | |
Loss for the year before tax: | (486) | (3,310) |
Tax rate | 25% | 25% |
Expected tax credit | (121) | (828) |
Adjusted for: |
| |
Non-deductible expenses | 37 | (14) |
Prior-year adjustments | 5 | - |
Movement in deferred tax | (20) | 534 |
Movement in unprovided deferred tax relating to losses | 42 | 180 |
Short-term timing differences | 37 | (87) |
Total tax credit for the year | (20) | (215) |
The Group has unrecognised deferred tax assets in respect of tax losses carried forward totalling £2,286,000 (2024: £4,735,000). The reduction reflects the disposal of subsidiaries during the year, which held approximately £10m of tax losses that are no longer available to the Group. There are no restrictions in the use of tax losses. Deferred tax assets remain unrecognised until it becomes probable that the underlying deductible temporary differences will be able to be utilised against future taxable income.A substantively enacted tax rate of 25% was applied for the years ending 30 September 2024 and 30 September 2025.
8. Earnings/(Loss) per share | 2025 £'000 | 2024 £'000 |
Profit/(Loss) attributable to ordinary shareholders | 2,585 | (3,153) |
Weighted average number of Ordinary Shares in issue, basic and diluted | 706,215,686 | 706,215,686 |
Basic and diluted earnings/(loss) per share | 0.37p | (0.45)p |
The weighted average number of Ordinary Shares used in calculating both the basic and diluted earnings/(loss) per share is the same. This is because the Group had outstanding share options were anti-dilutive in both periods. In the year ended 30 September 2024, the Group reported a loss and the inclusion of potential ordinary shares would have reduced the loss per share. In the year ended 30 September 2025, the share options were anti-dilutive as their inclusion would not have reduced earnings per share.
9. Intangible assets
Intangible assets comprise non-physical assets acquired through business combinations and internally generated development costs that meet the recognition criteria of IAS 38. Examples include customer relationships, software and other identifiable intellectual property.
Development costs are capitalised only when the Group can demonstrate the technical feasibility of completing the asset, its intention and ability to use or sell the asset, the probability that the asset will generate future economic benefits, and the ability to reliably measure the expenditure attributable to the asset. Research costs are expensed as incurred.
Intangible assets are recognised only where it is probable that future economic benefits attributable to the asset will flow to the Group and the cost of the asset can be measured reliably. Amortisation of intangible assets is recognised within administrative expenses in the Consolidated Income Statement.
Intangible assets | Goodwill £'000 | IT, billing and website systems £'000 | Brand £'000 | Customer lists £'000 | Total £'000 | ||
Cost | |||||||
At 1 October 2023 | 11,281 | 361 | 2,383 | 11,445 | 25,470 | ||
Re-classified as assets held for sale | (11,028) | (182) | (1,913) | (11,304) | (24,427) | ||
At 30 September 2024 and 30 September 2025 | 253 | 179 | 470 | 141 | 1,043 | ||
Accumulated amortisation | ||||||
At 1 October 2023 |
| - | (220) | (1,277) | (6,813) | (8,310) |
Charge for the year | - | (18) | (122) | (721) | (861) | |
Re-classified as assets held for sale | - | 183 | 1,254 | 7,490 | 8,927 | |
At 30 September 2024 | - | (55) | (145) | (44) | (244) | |
Charge for the year | - | (18) | (46) | (15) | (79) | |
At 30 September 2025 | - | (73) | (191) | (59) | (323) |
Impairment | ||||||
At 1 October 2023 | (4,447) | - | (225) | (1,193) | (5,865) | |
Re-classified as assets held for sale | 4,447 | - | 225 | 1,193 | 5,865 | |
At 30 September 2024 and 30 September 2025 | - | - | - | - | - |
Carrying amount | ||||||
At 30 September 2025 |
| 253 | 106 | 278 | 83 | 720 |
At 30 September 2024 | 253 | 124 | 325 | 97 | 799 | |
Average remaining amortisation period |
| 5.9 years for each category of intangible asset 6.9 years 6.9 years 6.9 years | ||||
For the purposes of assessing impairment, assets are grouped at the lowest levels for which there are independent cash inflows (cash generating units). Goodwill is allocated to those assets that are expected to benefit from synergies of the related business combination and represent the lowest level within the Group at which management monitors the related cash inflows. The directors concluded that at 30 September 2025, there were two CGUs being Systems Assurance Limited and More Computers Limited.
Each year, management prepares the resulting cash flow projections using a value in use approach to compare the recoverable amount of the CGU to the carrying value of goodwill and allocated assets and liabilities. Any material variance in this calculation results in an impairment charge to the Consolidated Income Statement.
The calculations used to compute cash flows for the CGU level are based on the Group's Board approved budget for the next twelve months, and business plan, growth rates as below, the weighted average cost of capital ("WACC") and other known variables. The calculations are sensitive to movements in both WACC and the revenue growth projections. The impairment calculations were performed using post-tax cash flows at post-tax WACC of 13.25% (FY24: 13.25%) for each CGU. The pre-tax discount rate (weighted average cost of capital) was calculated at 18% per annum (FY24:18%) and the revenue growth rate is 5% per annum (FY24: 5%) for each CGU for 5 years and a terminal growth rate of 2.3% (FY24: 2.3%).
Sensitivities have been run on cash flow forecasts for each CGU. Revenue growth rates are considered to be the most sensitive assumption in determining future cash flows for each CGU. Management is satisfied that the key assumptions of revenue growth rates should be achievable and that reasonably possible changes to those key assumptions would not lead to the carrying amount exceeding the recoverable amount. Sensitivity analyses have been performed and the table below summarises the effects of changing certain other key assumptions and the resultant excess (or shortfall) of discounted cash flows against the aggregate of goodwill and intangible assets.
Sensitivity analysis £'000 | SystemsAssuranceLimited | MoreComputersLimited | |
Excess of recoverable amount over carrying value: | |||
Base case - headroom | 47 | 3,105 | |
Pre-tax discount rate increased by 1% - resulting headroom | 88 | 2,993 | |
Revenue growth rate reduced in years 2 to 5 by 1% per annum - resulting headroom | - | 3,036 |
Base case calculations highlight that the impairment review in respect of Systems Assurance Limited is most sensitive to the discount rate and growth rate.
10. Property, plant and equipment | Right of Use Assets | ITequipment | E-commerce platform | Fixtures, fittings andleaseholdimprovements | Total | ||||||
| £'000 | £'000 | £'000 | £'000 | £'000 | ||||||
Cost of assets |
|
|
|
|
| ||||||
At 1 October 2023 | 3,288 | 400 | 107 | 71 | 3,866 | ||||||
Additions | 172 | 10 | 45 | 2 | 229 | ||||||
Modifications | 1,234 | - | - | - | 1,234 | ||||||
Disposals | (115) | (6) | - | (2) | (123) | ||||||
Re-classified as assets held for sale | (4,560) | (378) | - | (59) | (4,997) | ||||||
At 30 September 2024 | 19 | 26 | 152 | 12 | 209 | ||||||
Additions | - | - | - | - | - | ||||||
Modifications | 19 | - | - | - | 19 | ||||||
Disposals | - | - | - | - | - | ||||||
At 30 September 2025 | 38 | 26 | 152 | 12 | 228 | ||||||
|
| ||||||||||
Depreciation | |||||||||||
At 1 October 2023 | 1,758 | 186 | 41 | 39 | 2,024 | ||||||
Charge for the year | 1,532 | 110 | 26 | 17 | 1,685 | ||||||
Disposals | (115) | (6) | - | (2) | (123) | ||||||
Re-classified as assets held for sale | (3,159) | (264) | - | (42) | (3,465) | ||||||
At 30 September 2024 | 16 | 26 | 67 | 12 | 121 | ||||||
Charge for the year | 11 | - | 30 | - | 41 | ||||||
At 30 September 2025 | 27 | 26 | 97 | 12 | 162 | ||||||
|
|
|
|
|
| ||||||
Net book value |
| ||||||||||
At 30 September 2025 | 11 | - | 55 | - | 66 | ||||||
At 30 September 2024 | 3 | - | 85 | - | 88 | ||||||
£1,532k of net book value relating to Property, Plant and Equipment held within discontinued operations at 30 September 2024 are classified as assets held for sale. The net book value of right of use assets at 30 September 2025 comprised:
Land &buildings £'000 | Data CentreAssets£'000 | MotorVehicles £'000 | Total £'000 |
| ||
At 30 September 2025 | 11 | - | - | 11 | ||
At 30 September 2024 | 3 | - | - | 3 | ||
The depreciation charge in respect of right of use assets comprises £1,392k in respect of data centre assets (FY23: £879k) and £140k in respect of property and other assets (FY23: £87k).
11. Financial instrument At 30 September 2025, the Group had no loan notes outstanding (2024: £6.0 million). The loan notes were previously held by MXC Guernsey Limited and were repayable in October 2024. Following the disposal of CloudCoCo Limited and CloudCoCo Connect Limited, the loan notes, together with accrued deferred interest, were repaid in full on 31 October 2024. Accordingly, no amounts in respect of the loan notes were outstanding at the reporting date.
12. Deferred tax liabilities
Deferred tax on acquired intangibles £'000 | ||
Deferred tax liability at 1 October 2023 | 951 | |
Credited to income statement - on intangibles | (215) | |
Re-classified as "Assets held-for-sale" | (600) | |
Deferred tax liability at 30 September 2024 | 136 | |
Credited to income statement - on intangibles | (20) | |
Deferred tax liability at 30 September 2025 |
| 116 |
13. Sale of CloudCoCo Limited and CloudCoCo Connect Limited
Disposal of subsidiaries
On 31 October 2024, the Company disposed of its entire interests in CloudCoCo Limited and CloudCoCo Connect Limited for total cash proceeds of £7.9 million. Of this amount, £6.2 million was applied immediately to the repayment of the MXCG loan notes, thereby avoiding further costs associated with extending the loan note term.
The initial consideration attributable to CloudCoCo Limited was £7.5 million, which was subsequently reduced by £0.385 million following agreement of the completion accounts during the period to 30 June 2025, reflecting unrecoverable balances identified in the original balance sheet. The carrying value of the net assets disposed of at the date of disposal was £2.94 million, resulting in a gain on disposal before costs of £4.42 million. After deducting transaction-related costs of £0.18 million, the gain on disposal recognised was £4.12 million.The gain on disposal includes the remaining amortisation of intangible assets and the related deferred tax credit arising on amortisation.
Dissolution of subsidiaries
Prior to the disposal, the Group had transferred the assets and liabilities of three wholly owned subsidiaries into CCC as part of an internal reorganisation. As a result, the dormant subsidiaries Nimoveri Holdings Limited and CloudCoCo Managed IT Limited were formally dissolved on 15 October 2024 and 29 July 2025 respectively.
As part of the dissolution process, inter-company balances, including inter-company loans of £0.965 million, were written off. These items reduced the overall gain recognised by the Group.
Net gain recognised
After taking account of the dissolution of subsidiaries and the related write-off of inter-company balances, the net gain recognised in the consolidated income statement was £3.05 million, which has been presented as an exceptional gain within discontinued operations. Details of the disposals and the resulting gain recognised are set out below.
CloudCoCo Limited | CloudCoCo Connect Limited | Total | ||
| £'000 | £'000 | £'000 | |
Total cash proceeds |
| 7,115 | 250 | 7,365 |
Non-current assets |
| |||
Intangible assets (net) | 6,847 | 2,788 | 9,635 | |
Other net liabilities | (2,187) | (3,678) | (5,865) | |
Deferred tax credit on amortisation | (201) | (399) | (600) | |
Net assets disposed |
| 4,459 | (1,289) | 3,170 |
| ||||
Initial Gain on disposal |
| 2,656 | 1,539 | 4,195 |
Less disposal costs | (89) | (90) | (179) | |
Gain on disposal before dissolution |
| 2,567 | 1,449 | 4,016 |
Dissolution of subsidiaries | (965) | |||
Net gain recognised |
|
|
| 3,051 |
Cash movements | CloudCoCo Limited | CloudCoCo Connect Limited | Total | |
| £'000 | £'000 | £'000 | |
Total cash proceeds |
| 7,115 | 250 | 7,365 |
Cash Movements |
| |||
Cash included in other net liabilities above | 18 | 101 | 118 | |
Disposal costs | 89 | 90 | 179 |
14. Post-Balance Sheet Event
Subsequent to the reporting date of 30 September 2025, the Company held a General Meeting on27 March 2026 at which shareholders approved a capital reorganisation, a subscription for new ordinary shares and the adoption of a new employee share option scheme.
Following approval of the resolutions, the Company implemented a capital reorganisation whereby each existing ordinary share of 1 penny was subdivided and reclassified into one new ordinary share of 0.01 pence and one deferred share of 0.99 pence. The deferred shares carry no voting rights, dividend rights or rights to attend general meetings and are intended to be cancelled in due course.
The Company also announced a subscription for 229,166,666 new ordinary shares at a price of 0.12 pence per share, to raise gross proceeds of £275,000 (approximately £260,000 net of expenses). The new ordinary shares will rank pari passu with the existing ordinary shares and are expected to be admitted to trading on AIM on or around 2 April 2026.
The proceeds of the subscription are intended to fund the Group's growth initiative, Project Brightstar, which is designed to support the expansion of the Group's B2B technology procurement and services activities.
As these events occurred after the reporting date, they are treated as non-adjusting events after the end of the reporting period in accordance with Section 32 of FRS 102, and accordingly no adjustment has been made to the financial statements for the year ended 30 September 2025. END
Related Shares:
CloudCoCo