20th Feb 2026 07:00
Click on, or paste the following link into your web browser, to view the associated PDF document.
YEAR END FINANCIAL REPORT
for the year ended 31 December 2025
20 February 2026
Anglo American Preliminary Results 2025
Portfolio progress highlights quality of Copper and Premium Iron Ore business performance
• A transformational year of portfolio optimisation and strategic progress to merge with Teck, unlocking material value for shareholders
• Strong production and cost performance from continuing operations, delivering:
◦ Underlying EBITDA* of $6.4 billion (2024: $6.3 billion)
◦ EBITDA margins* of 49% in Copper and 43% in Premium Iron Ore
• $1.8 billion of run-rate cost savings delivered on schedule by the end of 2025
• Strong cash conversion* for continuing operations at 107% with further reductions in working capital delivered
• Net debt* decreased to $8.6 billion (2024: $10.6 billion) reflecting proceeds from sale of residual Valterra Platinum shareholding, with proceeds from planned divestments expected to support further deleveraging
• Loss attributable to equity shareholders of $3.7 billion - including a pre-tax impairment of $2.3 billion relating to De Beers
• $0.2 billion total cash dividends, equal to $0.23 per share, consistent with our 40% payout policy
Duncan Wanblad, CEO of Anglo American, said: "2025 was a transformational year for Anglo American as we progressed our portfolio simplification and set the course for the future of our company by agreeing to merge with Teck to form a global critical minerals champion - as Anglo Teck. In parallel, we continued to accelerate delivery of our own strategic priorities of operational excellence, portfolio optimisation and growth, making great strides during the year and unlocking material value for our shareholders.
"I am delighted with the continued strong operational and cost performance in Copper and Premium Iron Ore in 2025, with improved underlying EBITDA in both businesses. Underlying EBITDA from continuing operations increased to $6.4 billion, reflecting our unwavering focus on cost discipline and operational excellence, while also hitting our targeted $1.8 billion cost savings run-rate. We are continuing to strengthen our balance sheet, driven by the early proceeds from our portfolio optimisation and our continued focus on cash conversion.
"Safety is our number one value and our first priority, always. We saw further improvement in key leading safety indicators, with a continuation of the downward trend in injury frequency, recording our lowest ever rate in 2025. I am, however, sorry to report that we lost two colleagues following accidents in Brazil and Zimbabwe, in the first half of the year. We extend our sincerest condolences to their families, friends and colleagues and we will be relentless in our efforts to create a workplace where everyone returns home safely.
"We are committed to seeing our portfolio changes through to their conclusion, following the successful demerger of Valterra Platinum in May and the sale of our residual holding in the business in September. We continue to progress the sale of our Steelmaking Coal business, the agreed sale of our Nickel business is moving through regulatory approval, and we are progressing the separation of De Beers.
"Our merger agreement to form Anglo Teck marks a defining moment in our long history - a compelling combination that is designed to unlock significant value both in the near and long term, while offering our shareholders more than 70% exposure to copper. Having received Investment Canada Act approval in December, following overwhelming support from both companies' shareholders, we continue to secure key regulatory approvals ahead of being in a position to deliver the exceptional value that we have identified as we take shape as a critical minerals powerhouse."
Stuart Chambers, Chair of Anglo American, commented: "On behalf of the Board, I commend the entire leadership team and all our employees, led by Duncan, for an exceptional year of strategic delivery on so many fronts. Shareholders have benefited from considerable returns as the inherent value of Anglo American is brought to the fore, including via the successful demerger of Valterra Platinum. The progress to simplify our portfolio, in parallel with agreeing the merger with Teck and progressing the transaction so quickly and with such overwhelming shareholder support, together highlight the determination and energy with which we have been repositioning Anglo American to the forefront of our industry in terms of value-accretive growth."
Year ended | 31 December 2025 | 31 December 2024 (re-presented)(1) | Change | ||||||
US$ million, unless otherwise stated | |||||||||
Continuing operations | |||||||||
Revenue | 18,546 | 17,745 | 5 | % | |||||
Underlying EBITDA* | 6,417 | 6,322 | 2 | % | |||||
EBITDA margin* | 33 | % | 34 | % | |||||
Attributable free cash flow* | 790 | (209 | ) | n/a | |||||
Basic underlying earnings per share*($) | 0.80 | 1.11 | (28 | %) | |||||
Attributable ROCE* | 12 | % | 12 | % | 0 | % | |||
Total (including discontinued operations) | |||||||||
Loss attributable to equity shareholders of the Company | (3,741 | ) | (3,068 | ) | 22 | % | |||
Basic underlying earnings per share* ($) | 0.54 | 1.60 | (66 | %) | |||||
Loss per share ($) | (3.30 | ) | (2.53 | ) | 30 | % | |||
Interim dividend per share ($) | 0.07 | 0.42 | (83 | %) | |||||
Final dividend per share ($) | 0.16 | 0.22 | (27 | %) | |||||
Total dividend per share ($) | 0.23 | 0.64 | (64 | ) | % | ||||
Terms with this symbol * are defined as Alternative Performance Measures (APMs). For more information, refer to page 95.
(1) Comparative figures are re-presented to exclude results from discontinued operations, see note 8.
Note: Continuing operations includes Anglo American's future portfolio (Copper, Premium Iron Ore, Manganese and Crop Nutrients) and De Beers, per accounting requirements; discontinued operations includes the Steelmaking Coal, Nickel and PGMs businesses.
Sustainability performance
Key sustainability performance indicators(1)
Anglo American tracks its strategic progress using KPIs that are based on our seven pillars of value: safety and health, financial, cost, environment, people, production and socio-political. In addition to the financial and cost performance set out above and our operational performance on pages 19-34, our performance for the remaining four pillars is set out below, with further detail on pages 13-16.
Our basis of preparation for sustainability reporting is to account for 100% of managed operations (including both continuing and discontinued operations) until the date of divestment. The performance against targets set out below therefore includes the performance of our Platinum business until it was divested at the end of May 2025. The exceptions to this are GHG emissions - Scopes 1 & 2 - where data is prepared in line with GHG Protocol guidance on the treatment of divestments - and Fresh water withdrawals. For these two metrics, for comparative purposes, full year 2025 and 2024 data, as well as the target baseline, excludes our PGM business.
Pillar of value | Metric | 31 December 2025 | 31 December 2024 | Target(2) | Target achieved | ||
Safety and health | Work-related fatal injuries(3) | 2 | 3 | Zero | Not achieved | ||
Total recordable injury frequency rate (TRIFR) per million hours | 1.26 | 1.57 | Reduction year on year | Achieved | |||
New cases of occupational disease | 16 | 19 | Reduction year on year | Achieved | |||
Environment | GHG emissions - Total Scopes 1 & 2 (Mt CO2e) | 6.3 | 7.3 | Reduce absolute GHG emissions by 30% by 2030 | On track | ||
Fresh water withdrawals (ML) | 20,955 | 25,394 | Reduce fresh water abstraction in water scarce areas by 50% by 2030 | On track | |||
Level 4-5 environmental incidents | 0 | 0 | Zero | Achieved | |||
People | Women in management(4) | 36 | % | 35 | % | To achieve 40% by 2030 | On track |
Women in the workforce | 27 | % | 26 | % | |||
Voluntary labour turnover | 4.2 | % | 4 | % | < 5% | Achieved | |
Socio-political | Number of jobs supported off site(5) | 165,286 | 157,199 | ||||
Local procurement spend ($bn)(6) | 10.6 | 12.1 | |||||
Taxes and royalties ($m)(7) | 3,738 | 3,950 | |||||
(1) The following sustainability performance indicators for the 12 months ended 31 December 2025 and the comparative period are externally assured: work-related fatal injuries; TRIFR; GHG emissions; Fresh water withdrawals; Level 4-5 environmental incidents; and Number of jobs supported off site. Refer to the Assurance Statement in the Integrated Annual Report for further details.
(2) Environment targets reflect the Sustainable Mining Plan's commitments and goals, which were in place to the end of 2025. Our updated Sustainability ambitions and targets, which apply from 2026, can be found on page 17.
(3) 2025 reported performance includes one work-related fatality at the PGMs business.
(4) Management includes middle and senior management across the Group.
(5) Jobs supported since 2018, in line with the Sustainable Mining Plan's Livelihoods stretch goal.
(6) Local procurement is defined as procurement from businesses that are registered and based in the country of operation - also referred to as in-country procurement - and includes local procurement expenditure from the Group's subsidiaries and a proportionate share of the Group's joint operations, based on shareholding.
(7) Taxes and royalties include all taxes and royalties borne and taxes collected by the Group. This includes corporate income taxes, withholding taxes, mining taxes and royalties, employee taxes and social security contributions and other taxes, levies and duties directly incurred by the Group, as well as taxes incurred by other parties (e.g. customers and employees) but collected and paid by the Group on their behalf. Figures disclosed are based on cash remitted, being the amounts remitted by entities consolidated for accounting purposes, plus a proportionate share, based on the percentage shareholding, of joint operations. Taxes borne and collected by equity accounted associates and joint ventures are not included.
Operational and financial review of Group results for the year ended 31 December 2025
Operational performance
Production - continuing operations | 2025 | 2024 | % vs 2024 | ||
Copper (kt)(1) | 695 | 773 | (10 | ) | % |
Premium iron ore (Mt)(2) | 60.8 | 60.8 | 0 | % | |
Manganese ore (kt)(3) | 2,975 | 2,288 | 30 | % | |
Diamonds (Mct)(4) | 21.7 | 24.7 | (12 | ) | % |
(1) Contained metal basis. Reflects copper production from the Copper operations in Chile and Peru only.
(2) Wet basis.
(3) Anglo American's 40% attributable share of saleable production.
(4) Production is on a 100% basis, except for the Gahcho Kué joint operation which is on an attributable 51% basis.
Continuing operations
Production volumes decreased by 5% on a copper equivalent basis compared to the prior year, reflecting lower production at Copper Chile and De Beers.
Copper production decreased by 10%, primarily reflecting lower ore grades and copper recovery at Collahuasi. Los Bronces was impacted by lower plant throughput as a result of the smaller Los Bronces processing plant being put on care and maintenance at the end of July 2024 as planned, partially offset by higher ore grade and higher copper recoveries from improved plant performance. This was partly offset by Copper Peru, reflecting strong plant performance and higher throughput year-on-year.
Premium iron ore production was flat, with Kumba production increasing marginally by 1%, while strong operational performance at Minas-Rio enabled broadly flat production levels despite a 23-day planned pipeline shutdown for inspection activities.
Manganese production increased by 30%, reflecting more normalised production levels following the impact of the temporary suspension caused by tropical cyclone Megan in March 2024.
At De Beers, mining operations delivered solid operational performance at lower output levels, as the business produced into prevailing demand. Consequently, rough diamond production reduced by 12%.
For more information on each Business' production and unit cost performance, please refer to the following pages 19-31.
Discontinued operations
For operational information on each Business' production and unit cost performance, please refer to the following pages 32-34.
Financial performance
Continuing operations underlying EBITDA* increased by 2% to $6.4 billion driven by $1.0 billion favourable realised price benefits from copper and premium iron ore, and the delivery of our $1.8 billion cost-out programme, including an additional $0.6 billion gross cost savings realised in 2025, slightly ahead of plan. This offset $0.5 billion lower EBITDA from De Beers due to continuing challenging trading conditions and mitigated the impacts of lower sales volumes at Collahuasi (Copper Chile), as well as inflation and foreign exchange movements. This resulted in EBITDA Margin* broadly in line with prior year at 33%. As a consequence, continuing operations contributed $0.9 billion to total Group underlying earnings of $0.6 billion.
Cash flow was supported by the release of $0.6 billion of working capital primarily through inventory management, as well as proceeds from the accelerated bookbuild offering for the Group's remaining shareholding in Valterra Platinum, net proceeds on disposal of Jellinbah and lower capital expenditure. This reduced net debt by $2.1 billion to $8.6 billion.
Underlying EBITDA* - Continuing operations
Underlying EBITDA increased by $0.1 billion to $6.4 billion (2024: $6.3 billion). Financial results benefited from the favourable copper and premium iron ore realised prices, combined with the realisation of embedded cost reductions from the prior year and the delivery of the transformation programme in 2025. Despite these benefits, the higher earnings were partially offset by the ongoing challenging rough diamond trading conditions at De Beers, alongside lower sales at Copper Chile, driven by the lower production, to support an EBITDA margin* of 33% (2024: 34%). Our ongoing focus on cost control and cash generation has positioned us well as we execute our strategy. A reconciliation of 'Profit before net finance costs and tax', the closest equivalent IFRS measure to underlying EBITDA, is provided within note 4 to the Condensed financial statements.
Underlying EBITDA* by segment
$ million | 2025 | 2024 (re-presented)(1) | ||
Copper | 3,983 |
| 3,805 | |
Premium Iron Ore | 2,873 |
| 2,655 | |
Manganese | 127 |
| 116 | |
Crop Nutrients | (66 | ) | (34 | ) |
De Beers | (511 | ) | (25 | ) |
Corporate and other | 11 |
| (195 | ) |
Total | 6,417 |
| 6,322 | |
(1) Comparative figures are re-presented to exclude results from discontinued operations, see note 8.
Underlying EBITDA* reconciliation for the year ended 31 December 2024 to year ended 31 December 2025
The reconciliation of underlying EBITDA from $6.3 billion in 2024 to $6.4 billion in 2025 shows the major controllable factors (e.g. cost and volume), as well as those outside of management control (e.g. price, foreign exchange and inflation), that drive the Group's performance.
$ billion |
| |
2024 underlying EBITDA* | 6.3 |
|
De Beers | (0.5 | ) |
Price | 1.0 |
|
Foreign exchange | (0.1 | ) |
Inflation | (0.2 | ) |
Volume | (0.3 | ) |
Cost | 0.6 |
|
Other | (0.4 | ) |
2025 underlying EBITDA* | 6.4 |
|
De Beers
Rough diamond trading conditions remained challenging in 2025. The consequential impact of the lower average rough price index and stock rebalancing initiatives had a significant impact on earnings, resulting in underlying EBITDA decreasing by $0.5 billion, further impacted by a one-off benefit during the prior year from the sale of a non-diamond royalty right.
Price
Excluding the impact of De Beers, average market prices for the continuing Group's basket of products increased by 2% compared with 2024. This was driven by a 9% increase in the copper market price, partially offset by a 6% reduction in the iron ore market price. In terms of underlying EBITDA, price had a favourable $1.0 billion impact compared to 2024, driven by a 14% increase in the weighted average realised price for copper and a 4% increase in the weighted average realised price for premium iron ore. Differences in the market price to realised price are largely due to favourable provisional pricing impacts benefiting both Copper and Premium Iron Ore, as well as lower freight rates benefiting Premium Iron Ore.
Foreign exchange
Unfavourable foreign exchange reduced underlying EBITDA by $0.1 billion, primarily reflecting the impact of the stronger South African rand on the allocated cost base.
Inflation
The Group's weighted average CPI was 4% in 2025, broadly in line with the prior year. The impact of CPI inflation on costs reduced underlying EBITDA by $0.2 billion.
Volume
Lower sales volumes impacted underlying EBITDA by $0.3 billion, due to lower production at Copper Chile.
Cost
Lower costs improved underlying EBITDA by $0.6 billion. Driven by gross cost savings of $0.6 billion from the realisation of $0.3 billion run-rate benefits embedded in 2024 including operational and corporate cost savings, as well as a further $0.3 billion from the substantial completion of our Corporate and head-office transformation programme in 2025. These gross cost savings were partially offset by $0.2 billion of headwinds primarily at Collahuasi related to stripping as development work continued towards sustainably higher-grade areas of the mine. A further $0.2 billion benefit primarily arose from lower treatment and refining charges in Copper.
Other
The $0.4 billion unfavourable movement was largely driven by the movement year-on-year in the long term rehabilitation provisions at Copper Chile.
Reconciliation from underlying EBITDA* to underlying earnings* - Continuing operations
Group underlying earnings decreased to $0.9 billion (2024: $1.3 billion), driven by higher finance costs and depreciation as well as the impacts of the earnings mix on income tax expense and non-controlling interests.
$ million | 2025 |
| 2024 (re-presented)(1) | ||
Underlying EBITDA* | 6,417 |
| 6,322 | ||
Depreciation and amortisation | (2,382 | ) |
| (2,281 | ) |
Net finance costs | (557 | ) |
| (418 | ) |
Income tax expense | (1,792 | ) |
| (1,671 | ) |
Non-controlling interests | (779 | ) |
| (610 | ) |
Underlying earnings* - continuing operations | 907 |
| 1,342 | ||
(1) Comparative figures are re-presented to exclude results from discontinued operations, see note 8.
Depreciation and amortisation
Depreciation and amortisation increased 4% to $2.4 billion (2024: $2.3 billion), driven by projects completed at Copper Chile during the second half of 2024.
Net finance costs
Net finance costs, before special items and remeasurements, were $0.6 billion (2024: $0.4 billion), with the increase mainly driven by net foreign exchange losses, primarily on derivative instruments.
Income tax expense
The underlying effective tax rate was higher than the prior year at 51.5% (2024: 46.1% (re-presented)), impacted by the relative levels of profits arising in the Group's operating jurisdictions and losses in certain businesses, most notably De Beers, for which no or limited tax benefit has been recognised. Excluding De Beers, the underlying effective tax rate was 39.1%. The tax charge for the year, before special items and remeasurements, was $1.8 billion (2024: $1.6 billion).
Non-controlling interests
The share of underlying earnings attributable to non-controlling interests was $0.8 billion (2024: $0.6 billion). This is driven by higher earnings in Copper and Premium Iron Ore and partially offset by an increased loss in De Beers.
Reconciliation from underlying EBITDA* to underlying earnings* - Discontinued operations
$ million | 2025 |
| 2024 | ||
Underlying EBITDA - discontinued operations* | 67 |
| 2,138 | ||
Depreciation and amortisation | (213 | ) |
| (894 | ) |
Net finance costs | (120 | ) |
| (323 | ) |
Income tax expense | (23 | ) |
| (197 | ) |
Non-controlling interests | (8 | ) |
| (129 | ) |
Underlying earnings* - discontinued operations | (297 | ) |
| 595 | |
Underlying earnings from discontinued operations were significantly lower driven by the successful demerger of Platinum Group Metals (PGMs) in May 2025 compared to a full year of earnings in 2024, as well as the sales volume impacts in Steelmaking Coal due to the sale of Jellinbah at the end of 2024, the suspension of Grosvenor from July 2024 and the underground incident at Moranbah North in March 2025 as well as lower realised prices. Due to the lower earnings, tax and non-controlling interests were both consequently lower.
Reconciliation from underlying EBITDA* - Total Group* to underlying earnings*
$ million | 2025 |
| 2024 | ||
Underlying EBITDA - Total Group* | 6,484 |
| 8,460 | ||
Depreciation and amortisation | (2,595 | ) |
| (3,175 | ) |
Net finance costs | (677 | ) |
| (741 | ) |
Income tax expense | (1,815 | ) |
| (1,868 | ) |
Non-controlling interests | (787 | ) |
| (739 | ) |
Underlying earnings* | 610 |
| 1,937 | ||
Special items and remeasurements - Continuing operations
Special items and remeasurements (after tax and non-controlling interests) from continuing operations were a net charge of $2.1 billion (2024: net charge of $4.5 billion). This principally related to an impairment within De Beers of $2.3 billion ($1.8 billion after tax and non-controlling interests) and restructuring costs related to the Group's strategic change programme of $0.1 billion.
Full details of the special items and remeasurements recorded are included in note 12 to the Condensed financial statements.
Net debt*
$ million | 2025 |
| 2024 (re-presented)(1) | |
Opening net debt* at 1 January | (10,623 | ) | (10,615 | ) |
Underlying EBITDA* from subsidiaries and joint operations | 6,201 |
| 6,128 | |
Working capital movements | 559 |
| 1,457 | |
Other cash flows from operations | 245 |
| (655 | ) |
Cash flows from operations | 7,005 |
| 6,930 | |
Capital repayments of lease obligations | (287 | ) | (340 | ) |
Cash tax paid | (1,329 | ) | (1,427 | ) |
Dividends from associates, joint ventures and financial asset investments | 47 |
| 62 | |
Net interest(2) | (741 | ) | (949 | ) |
Distributions paid to non-controlling interests | (542 | ) | (470 | ) |
Sustaining capital expenditure | (2,720 | ) | (2,885 | ) |
Sustaining attributable free cash flow* | 1,433 |
| 921 | |
Growth capital expenditure and other(3) | (643 | ) | (1,130 | ) |
Attributable free cash flow* | 790 |
| (209 | ) |
Dividends to Anglo American plc shareholders | (344 | ) | (1,026 | ) |
Acquisitions and disposals(4) | 2,346 |
| 161 | |
Foreign exchange and fair value movements | 184 |
| (156 | ) |
Other net debt movements(5) | (221 | ) | 553 | |
Total movement in net debt* - continuing operations | 2,755 |
| (677 | ) |
Total movement in net debt* - discontinued operations(6) | (703 | ) | 669 | |
Closing net debt* at 31 December | (8,571 | ) | (10,623 | ) |
(1) The 2024 results have been re-presented to show separately the discontinued operations for comparability to the current year.
(2) Includes cash outflows of $267 million (2024: $476 million), relating to interest payments on derivatives hedging net debt, which are included in cash flows from derivatives related to financing activities.
(3) Growth capital expenditure and other includes $41 million (2024: $80 million) of expenditure on non-current intangible assets.
(4) Includes cash received from the sale of our residual 19.9% interest in Valterra Platinum of $2,432 million (net of tax and transaction costs).
(5) Includes the purchase of shares (including for employee share schemes) of $102 million and other movements in lease liabilities (excluding variable vessel leases) increasing net debt by $44 million. 2024 includes the purchase of shares (including for employee share schemes) of $112 million, other movements in lease liabilities (excluding variable vessel leases) increasing net debt by $100 million, investments in joint ventures of $62 million and Mitsubishi's share of Quellaveco's capital expenditure of $30 million, offset by consideration received on the sale of our 11.9% interest in Valterra Platinum of $935 million as part of the two accelerated bookbuilds.
(6) Includes cash received from the Jellinbah disposal of $870 million; finance leases transferred to held for sale during the year and thus excluded from net debt of $141 million; offset by cash flows from operations of $212 million, capital expenditure of $733 million; Valterra Platinum dividends paid to non-controlling interests of $297 million paid prior to demerger, net debt impact of the demerger of Valterra Platinum of $247 million including tax and transaction costs, other transaction costs of $47 million, capital repayment of lease obligations of $84 million and foreign exchange and fair value movements of $38 million. 2024 includes cash flows from operations of $2,538 million, partially offset by capital expenditure of $1,555 million, capital repayment and movement of lease obligations of $114 million, dividends paid to non-controlling interests and interest paid of $119 million and deferred consideration in respect of previous acquisitions of $68 million.
Net debt (including related derivatives) of $8.6 billion has decreased by $2.1 billion from 31 December 2024. Net debt at 31 December 2025 represented gearing (net debt to total capital) of 26% (31 December 2024: 27%). The net debt to EBITDA ratio on a continuing basis decreased to 1.3x (31 December 2024: 1.7x), principally as a result of proceeds from the accelerated bookbuild offering for the Group's remaining shareholding in Valterra Platinum in September 2025, cash received from the Jellinbah disposal, as well as lower capital expenditure and continued working capital management.
Cash flow
Cash flows from operations and Cash conversion* - Continuing operations
Cash flows from operations remained flat at $7.0 billion (2024: $6.9 billion), as a lower working capital inflow of $0.6 billion (2024: inflow of $1.5 billion) was offset by improved other cash flows from operations inflows of $0.2 billion (2024: $0.7 billion outflow) driven by provision movements in Copper Chile and timing of derivative settlements. Within working capital, the movement is driven by a $0.7 billion inventory inflow predominantly as a result of stock rebalancing initiatives at De Beers. A receivables outflow of $0.9 billion was driven by high copper prices impacting amounts to be received on sales, including provisional price adjustments. This was largely offset by a payables inflow of $0.8 billion driven by higher amounts due on third-party copper purchases.
These factors, combined with lower sustaining capital expenditure and repayments of lease obligations, contributed to the Group's cash conversion increasing to 107% (2024: 98%).
Capital expenditure* - Continuing operations
$ million | 2025 | 2024 (re-presented)(1) | ||
Stay-in-business | 1,925 |
| 2,048 | |
Development and stripping | 651 |
| 512 | |
Life-extension projects | 161 |
| 335 | |
Proceeds from disposal of property, plant and equipment | (17 | ) | (10 | ) |
Sustaining capital | 2,720 |
| 2,885 | |
Growth projects | 602 |
| 1,050 | |
Total capital expenditure | 3,322 |
| 3,935 | |
(1) Comparative figures are re-presented to exclude results from discontinued operations, see note 8.
Capital expenditure was $0.6 billion lower compared to the prior year at $3.3 billion (2024: $3.9 billion).
Sustaining capital expenditure was lower at $2.7 billion (2024: $2.9 billion), primarily due to rephasing of the Venetia underground life-extension and rationalisation of stay-in-business capex spend at De Beers, and a planned reduction of Collahuasi desalination project spend as it progresses towards completion in 2026.
Growth capital expenditure was lower at $0.6 billion (2024: $1.1 billion), due to planned lower spend at Woodsmith. Growth capital expenditure primarily relates to spend on the Woodsmith project (Crop Nutrients), the first phase of the Collahuasi debottlenecking initiative (Copper Chile) and Kumba's ultra-high-dense-media-separation (UHDMS) project (Premium Iron Ore).
Attributable free cash flow* - Continuing operations
The Group's attributable free cash flow was an inflow of $0.8 billion (2024: $0.2 billion outflow). The improved results principally reflects lower capex of $3.3 billion (2024: $3.9 billion) and lower net interest of $0.7 billion (2024: $0.9 billion).
Other movements in net debt - Continuing operations
In addition to the movements in attributable free cash flow, the total movement in net debt was impacted by dividends to Anglo American plc shareholders, disposals, foreign exchange and fair value movements and other net debt movements. The dividend paid to Anglo American plc shareholders reduced to $0.3 billion (2024: $1.0 billion), driven by a reduction in underlying earnings.
Shareholder returns
In line with the Group's established dividend policy to pay out 40% of underlying earnings, the Board has proposed a final dividend of 40% of second half underlying earnings, equal to $0.16 per share (2024: $0.22 per share), equivalent to $0.17 billion (2024: $0.27 billion).
Balance sheet
Net assets decreased by $4.4 billion to $24.1 billion (31 December 2024: $28.5 billion), driven by the demerger of net assets of $5.6 billion from the PGMs business, as well as an impairment of $2.3 billion ($1.8 billion after tax and non-controlling interests) recognised for the year ended 31 December 2025 at De Beers.
Attributable ROCE* - Continuing operations
Attributable ROCE remained flat at 12% (2024: 12%) with strong performance in Copper and Premium Iron Ore, offset by the losses in De Beers. Attributable underlying EBIT decreased to $2.6 billion (2024: $2.8 billion), reflecting higher depreciation and changes in the earnings mix. Average attributable capital employed decreased to $22.3 billion (2024: $24.1 billion), primarily due to the impact from the impairment recognised in De Beers in the current year.
Liquidity and funding
Group liquidity was $12.4 billion (2024: $15.3 billion), comprising $6.4 billion of cash and cash equivalents (2024: $8.1 billion) and $6.0 billion of undrawn committed facilities (2024: $7.2 billion).
In March 2025, the Group used $1.0 billion of cash to execute a liability management transaction, retiring $1.0 billion of contractual repayment obligations (including derivatives hedging the bonds). In December 2025, the Group used $0.6 billion of cash to redeem $0.6 billion of Euro denominated bonds originally due to mature in March 2026.
Consequently, the weighted average maturity on the Group's bonds increased to 8.1 years (2024: 7.6 years).
Attractive growth options
Anglo American continues to evolve its portfolio of competitive, world-class assets towards those future-enabling products that are essential for decarbonising the global economy, improving living standards, and supporting food security.
Growth projects (metrics presented on a 100% basis unless otherwise indicated)
Progress and current expectations in respect of our key growth projects are as follows:
Operation | Scope | Capex $bn | Remaining capex $bn | First production |
Copper | ||||
Collahuasi | Debottlenecking investment in additional crushing capacity and flotation cells is expected to increase plant throughput from c.170 ktpd to c.185 ktpd, adding production of c.10 ktpa (44% share) on average from 2026.
Further investments in debottlenecking initiatives have been approved and are expected to expand the existing plant to the total permitted capacity of 210 ktpd and will add c.15 ktpa (44% share) of production from late 2027.
Beyond that, studies and permitting are required to be finalised for a fourth processing line in the plant and mine expansion that would add up to c.150 ktpa (44% share) of production from the mid 2030s. In parallel to the fourth line studies, work is continuing to unlock the alternate growth pathway and realise the significant synergies from the potential operational integration and optimisation of Collahuasi with the neighbouring Quebrada Blanca operation.
The desalination plant that is currently under construction has been designed to accommodate capital efficient expansion in light of the growth potential at the asset. | c.0.2 (44% share)
c.0.3 (44% share) | <0.1 (44% share) c.0.2 (44% share) Subject to ongoing studies, permitting, and approvals | 2026
Late 2027
|
Quellaveco | The plant throughput was initially permitted to a level of 127.5 ktpd. Following regulatory approvals to increase throughput to 150 ktpd, a debottlenecking strategy was implemented to provide added flexibility to design optimal throughput for the plant with limited configuration changes, subject to sectorial permits associated with the specific design and water availability.
In light of this, the stage one expansion was approved and will increase throughput to c.142 ktpd and improve recoveries by late 2026, this involves the installation of a second pebble crusher and additional flotation cells.
Efforts will continue to further debottleneck the plant, while conducting early studies to support Quellaveco's long-term expansion prospects. |
c. 0.1
|
c.0.1
Subject to ongoing studies, permitting and approvals |
Late 2026 |
Sakatti | Polymetallic greenfield project in Finland containing copper, nickel, platinum, palladium, gold, silver and cobalt. The mine design reflects the latest studies and production profile, which is expected to deliver 60-80 ktpa copper equivalent production from a state-of-the-art mine design with minimal surface footprint.
In March 2025, the project was awarded 'strategic project' status under the EU's Critical Raw Materials Act, which enables it to benefit from more efficient processing of permitting applications. Studies are ongoing, with the latest Mineral Resource estimated at c. 157 Mt, with average grades of 0.75 %TCu, 0.40 %Ni and 0.67 g/t 3E PGE. The application for the Natura 2000 derogation is currently being prepared with PFS-B completion targeted for December 2026. | Subject to ongoing studies, permitting, and approvals | Early 2030s | |
Los Bronces | The final agreement was signed with Codelco in September 2025 to implement a joint mine plan between Los Bronces and Andina. The expected additional copper production of c.120,000 tonnes per year is to be shared equally (average over 2030-2051).
In Q4 2025, a Steering Committee was established, including three members of Anglo American and three members of Codelco. Closing of the transaction is expected in H2 2026 and is subject to a number of conditions, including customary competition and regulatory approvals. Implementation of the joint mine plan is expected in 2030, subject to permitting.
Under the terms of the agreement, both Anglo American and Codelco maintain the flexibility to develop separate standalone projects, including the advancement of underground Mineral Resources, during the term of the joint mine plan in a coordinated and appropriate manner.
Los Bronces has significant underground endowment, with underground development permitted as part of the wider Los Bronces integrated project permit granted in 2023. The project would partly replace lower grade open-pit tonnes with higher grade underground tonnes. It is located 5 km from the existing pit and will use the same plant and tailings deposit capacity used by the current operation, without requiring any additional fresh water.
Studies are under way with the aim being to develop a modern operation with minimal surface impact while maximising value delivery from the project. Studies include an evaluation of the expansion option in light of the Los Bronces / Andina joint mine plan from 2030, with the timing of this project being under review. | Subject to permitting, and approvals
Subject to ongoing studies
| 2030
Beyond 2030 | |
Premium Iron Ore | ||||
Minas-Rio | The implementation of recleaner flotation columns to enable higher throughput while maintaining product quality. The average impact on production from the implementation of the recleaners is expected to be ~2.5 Mtpa until 2040, helping mitigate the impact of the mine moving into areas with more ore feed variability. The recleaner uplift is subject to change as studies and permitting on Serpentina is progressed.
The acquisition of the neighbouring Serpentina resource from Vale completed in Q4 2024, with Vale acquiring a 15% shareholding in Minas-Rio. Serpentina is of a higher iron ore grade than Minas-Rio's ore and contains predominantly softer friable ore that together are expected to translate into lower unit costs and capital requirements.
The combination of Minas-Rio with the scale and quality of the Serpentina endowment provides a high value option to potentially double Minas-Rio's production. Vale will also have an option to acquire an additional 15% shareholding in the enlarged Minas-Rio for cash (at fair value calculated at the time of exercise of the option), if and when certain events relating to a future expansion occur. Near-term access to the Serpentina ore as well as the potential future expansion are both subject to obtaining normal licences, which are expected to take a number of years. | c.0.3 | c.0.2
Subject to studies, permitting and approvals | 2028 |
Kumba | The conversion of Sishen's Dense Media Separation (DMS) plant to an Ultra-High DMS (UHDMS) plant will enable Sishen to reduce its ROM cut-off grade (from 48% to 40%) and produce more premium-grade product (from less than 20% to more than 50% of production). | c.0.6 | c.0.4 | Ramp up to full production by 2028 |
Crop Nutrients | ||||
Woodsmith | New polyhalite (natural mineral fertiliser) mine being developed in North Yorkshire, UK. Expected to produce a premium quality, comparatively low carbon fertiliser suitable for organic use. Final design capacity of c.13 Mtpa is expected, subject to studies and final investment decision. | Refer to page 26 for more information on project progress | ||
Life-extension projects (metrics presented on a 100% basis unless otherwise indicated)
Progress and current expectations in respect of our key life-extension projects are as follows:
Operation | Scope | Capex $bn | Remaining capex $bn | Expected first production |
Diamonds | ||||
Venetia | Venetia Underground replaces the open pit operation. This will extend the life of mine by 25 years to 2048. First underground production was achieved in 2023, with progressive ramp up to an expected steady state production of c. 4 - 4.5 Mctpa by the mid 2030s. During 2025, a project review was undertaken to optimise phasing and capital allocation in the current market environment, while preserving long term optionality. | c.2.6 | c.0.8 | Achieved in June 2023 |
Jwaneng | Jwaneng Cut 9 is a replacement for Cuts 7 and 8. This will extend the life of the mine by 12 years to 2039 with steady state production capacity of c. 9 Mctpa (100% basis). | c.0.4 (19.2% share) | c.0.1 (19.2% share) | 2027 |
Technology projects(1)
The Group continues to invest in technology projects that relate to its FutureSmart MiningTM approach, including the delivery of Anglo American's Sustainability Strategy, particularly those that relate to safety, energy, emissions and water. The Group has optimised its technology programme, focusing only on those technologies that will bring the most benefit to the operating assets and development projects, as well as determining the most effective manner to execute these programmes. For more information on technology, please refer to our 2025 Integrated Annual Report pages 66-67.
(1) Expenditure relating to technology projects is included within operating expenditure, or if it meets the accounting criteria for capitalisation, within Growth capital expenditure.
Sustainability performance
Anglo American's longstanding and holistic approach to sustainability helps to build trust with our employees and stakeholders across society, reduces operational risk and delivers direct financial value for our business. Our reputation as a responsible mining company supports our ability to access future resource development opportunities, both from the significant endowments within our business and more broadly - critical to delivering our growth ambitions.
Our 2025 progress against our Sustainable Mining Plan targets is set out below.
Zero mindset
Occupational safety
It is with deep sadness that we report the loss of life of two colleagues at our managed operations. In February 2025, Edvan de Jesus Pinto Bogea, a mechanical-assembly contractor, died following a fall from height during construction work at our Minas-Rio mine in Brazil. In April, Felix Kore was fatally injured while operating an underground load haul dump machine at Unki mine, part of our former Platinum Group Metals (PGMs) business, in Zimbabwe. Both incidents were investigated by specialist teams, independent of the operations, and actions agreed to mitigate the risks identified.
In 2025, we continued to demonstrate progress in our safety journey, recording our lowest TRIFR of 1.26 in 2025 (2024: 1.57). We also reported a 16% improvement in the 2025 lost-time injury frequency rate (LTIFR) to 0.89 (2024: 1.06). This improvement in our lagging metrics reflects the operational rigour and progressive maturity of our operational safety processes.
We recorded 217 occupational injuries, a decrease of 41% (2024: 369). We remain absolutely committed to working towards a step-change in the reduction of injuries and are continuing to implement our targeted safety strategy, investing in systems and technology, standards, and training our people.
Our commitment to safety is unwavering, and these results reflect the strength of our systems, our people, and our leadership. We remain focused on continuous improvement to ensure a safe and sustainable operating environment.
We are dedicated to safeguarding our people from harm. In 2025, our focus was on driving compliance with Technical Standards through timely closure of critical safety actions, a sustained focus on leaders spending time in the field and oversight and disciplined execution of planned work enhancing operational reliability.
Occupational health
Our health and well-being strategy, aligned with the World Health Organization (WHO) Healthy Workplace model, has been updated to include Total Worker Health concepts that integrate actions to support the health and well-being of our workforce and host communities. We recognise our contractors are an integral part of our workforce and are key stakeholders in maintaining safe and stable production. The Total Health Standard ensures we deliver equitable contractor access to our health and well-being programmes by specifically requiring contractor access to information, instruction, training or supervision that is necessary to attend our workplaces without risk to both immediate and long-term health and well‑being.
Occupational diseases
In 2025, there were 16 reported new cases of occupational disease, of which 15 were related to noise exposure and one was a respirable disease (2024: 19, of which 18 were related to noise exposure and one was musculoskeletal). A key challenge in understanding trends in occupational disease reporting is that many hazards do not cause immediately detectable health harms, with most occupational diseases not clinically definable until many years post exposure.
This means disease cases reported in a given year are not a reliable measure of current working conditions, but rather reflect accumulated and/or past working conditions and exposures over a worker's career. This is termed 'latency of presentation'.
These characteristic delays in occupational disease case presentation underscore the importance of prevention. This means ongoing proactive and robust environment monitoring, comprehensive worker education and health surveillance, conducting regular risk assessments, and rigorous control of hazard exposures. Reducing exposure to all known workplace hazards remains an ongoing focus at Anglo American, aligned with our zero-harm mindset.
Healthy environment
We are committed to driving strong environmental stewardship and continued to make meaningful progress toward our Sustainable Mining Plan goals. These included; by 2030, to reduce operational greenhouse gas (GHG) emissions (Scopes 1 and 2) by 30%; achieve a 50% reduction in fresh water abstraction in water scarce areas; and deliver net-positive impacts in biodiversity across our managed operations.
Climate change
We continue to make progress in reducing our operational emissions, with our 2025 Scope 1 and 2 GHG emissions of 6.3 Mt CO2e being 14% lower than in 2024. This equates to a 32% reduction compared with the 2016 baseline on which our existing 2030 target is set. For comparability, all figures referenced here, including our baseline, exclude emissions related to our PGMs business which we demerged in May 2025. When including five months of PGMs data, our Scope 1 and 2 GHG emissions total 7.9 Mt CO2e.
Since 2023, our managed operations in South America have been supplied with 100% renewable electricity and from this year our managed operations in Australia moved to a 100% electricity supply linked to renewable sources, essentially eliminating all Scope 2 emissions from our Steelmaking Coal business. From this point, approximately 90% of the global grid supply for the current Anglo American portfolio was drawn from renewable sources.
We also continue to make progress towards addressing the largest remaining source of Scope 2 emissions - our electricity supply in southern Africa. In 2026, we expect 11 MW of the output of Envusa Energy's Koruson 2 cluster to be wheeled through to Kumba's Kolomela mine reducing the site's Scope 2 emissions by around 85%. On-site solar - totalling 63 MW - at our Sishen iron ore operation is also progressing well, with planned commercial operations in 2027, delivering an estimated 33% reduction in Sishen's Scope 2 emissions.
Methane emissions from our Australian steelmaking coal operations still represent the largest component of our current Scope 1 emissions and we continue to work hard to capture, use and abate those emissions. In 2025, methane emissions reduced by 0.5 Mt to 2.5 Mt CO2e (2024: 3.0 Mt CO2e). This reduction was a result of the impact of the stoppage of operations and subsequent cessation of active ventilation at our Grosvenor steelmaking coal operation following the underground gas ignition incident in June 2024, as well as continued improvements in the management of methane at all of our underground steelmaking coal operations.
For Scope 3, we continue to focus on portfolio choices, growth, partnerships and customer selection to achieve our ambitions. In 2025 our Scope 3 emissions were 136.6 Mt, a reduction of 20% when compared with 2024 (170.6 Mt). This figure includes emissions from our demerged PGMs business, which were not material to the overall total. The reduction in emissions was driven primarily by reduced production and sales of steelmaking coal in 2025 as a result of the temporary suspension of operations at Moranbah North Mine following a localised ignition incident on 31 March 2025 and the temporary sealing of Grosvenor Mine following an event in 2024. Additional reductions were driven by reduced category 15 emissions following the divestment of our stake in Jellinbah and lower reported emissions from the Manganese business.
Water
With more than 70% of our global assets (excluding the PGMs operations) located in water scarce areas, we continue to focus on reducing our dependence on fresh water.
To address this, we have progressed work on projects across our operations that support sustainable reductions in fresh water withdrawals. By the end of 2025, excluding our PGMs business, to enable a meaningful comparison, we have reduced fresh water withdrawals year on year by 17%. Against the 2015 target baseline our fresh water withdrawals had decreased by 47%. This performance reflects improved water efficiency at most of our operations, the diversion of fresh water to communities as well as converting our water supply to alternative non-fresh water sources.
While overall Group-wide water efficiency decreased to 85% in 2025 (2024: 86%), this was largely due to heavy precipitation and flooding at PGMs operations.
Beyond operational performance, we are committed to ensuring that the water resources we manage, and the savings achieved through reduced fresh water withdrawals, translate into increased water availability in ways that are socially equitable, environmentally sustainable, and economically beneficial. This approach underpins our long‑term water strategy and guides investment decisions across our operations.
At Los Bronces, construction of the Integrated Water Security Project progressed as planned throughout 2025. The project is expected to deliver desalinated water in 2026, including a supply of 25 litres per second to rural communities in Tiltil and Colina, with the potential to benefit approximately 10,000 people.
Biodiversity
As custodians of the land and ecosystems around our operations, we seek to improve the footprint of our operations and deliver positive and lasting environmental outcomes for host communities and our stakeholders.
In 2025, we measured progress towards Net Positive Impact (NPI) using our Group-wide biodiversity metric - Quality Habitat Hectares (QHH). This provides a consistent, objective assessment of the extent and quality of ecosystems impacted in and around our operations enabling us to track both losses and gains over time.
Across the Group, a range of biodiversity and nature-positive activities progressed during the year, spanning conservation delivery, impact management and long-term stewardship. Sites advanced reforestation and habitat-restoration programmes, including riparian and wetland restoration, spring and watershed recovery, and the cultivation of native plant species in partnership with local communities and landholders. Biodiversity offset planning continued to support responsible site expansion and regulatory compliance, alongside assessments of residual impacts under Net Positive Impact (NPI) pathways.
During the year, we delivered a range of biodiversity projects across our operations, including large-scale land conservation at El Soldado and Minas-Rio, land restoration at Los Bronces, and connecting fragmented ecosystems at Kumba and Minas-Rio. In Chile, our Quilapilún Botanical Garden earned accreditation from Botanic Garden Conservation International - the highest standard for a botanic garden. At Quellaveco, feasibility studies and implementation planning for compensation and conservation progressed with support from academic and conservation partnerships.
Collectively, these initiatives contribute to species protection, ecosystem restoration, data sharing, and long term biodiversity resilience across landscapes.
Thriving communities
In 2025, we continued to strengthen and expand our social performance capabilities by embedding our Social Way management system across Anglo American. The Social Way - one of the most robust and comprehensive social performance management systems in the mining sector - supports us build trust through transparency and accountability, and helps us protect and enhance value for both our business and our stakeholders. Through our collaborative regional development initiatives, we actively support local and regional economies, as well as the lives and livelihoods of the communities where we operate.
In 2025, we completed a review of our Social Way assurance programme and piloted the revised approach at two of our sites with a team of independent and internal assessors. The updated process is more risk and outcomes focused, and aims to enable teams to prioritise their work to more effectively manage social impacts and risks and drive continuous improvement based on their context. This revised approach will be rolled out across our simplified portfolio from 2026 onwards.
Since the launch of our Sustainable Mining Plan, we have supported 165,286 off site jobs through livelihoods programmes. One example of where we are offering support beyond traditional social investment is our Impact Finance Network (IFN), which supports local growth-stage SMEs prepare for and access funding. The IFN provides pre-investment technical assistance, investor matching, and catalytic capital; working with partners to build effective impact investment ecosystems. To date, it has supported more than 162 companies globally, supporting more than 47,200 jobs and enabling over $157 million in third-party investment.
Building on our work in Southern Africa, we have now established a strong presence in South America. We are in our third year of operation in Chile and our second year in Peru, and we are expanding the IFN into Brazil, where a pilot ran through to the end of 2025.
Trusted corporate leader
In 2025, we continued to strengthen our reputation as a trusted, reliable and responsible mining company, as well as being recognised for the ways in which we live our Values and are guided by our Purpose.
We strive to create a workplace that places people at its heart and are committed to promoting an inclusive and diverse environment where every colleague is valued and respected for who they are, and has the opportunity to fulfil their potential.
By the end of 2025, female representation in our management population reached 36% (2024: 35%) and we are on track to meet our target of 40% by 2030. We have achieved 30% female representation on the ELT (2024: 25%). Female representation on the ELT plus those reporting to an ELT member, increased to 39% (2024: 34%). We continue to monitor other key performance metrics, such as the percentage of women in the overall workforce, which has increased to 27% in 2025 (2024: 26%).
We have actively worked with multi-stakeholder groups developing and adopting some of the most trusted sustainability certification programmes for the mining sector, including the Initiative for Responsible Mining Assurance (IRMA), the Consolidated Mining Standard Initiative (CMSI) and the Responsible Jewellery Council (RJC).
In 2018, we committed to assess all our managed mines against leading responsible mining standards by 2025. With the third-party audit against the Initiative for Responsible Mining Assurance (IRMA) standard at our Los Bronces and Quellaveco copper mines completed in December 2025, and the completion of Towards Sustainable Mining (TSM) assessments at Moranbah North and Dawson mines, we are proud to say that we have delivered on this promise.
Sites that have undergone third-party assessment include:
- Minas-Rio and Barro Alto mines in Brazil were the first premium iron ore and nickel-producing mines in the world to complete an IRMA audit. Both mines achieved the IRMA 75 level of performance.
- Kolomela and Sishen mines in South Africa were the first premium iron ore mines in Africa to complete IRMA audits, achieving an IRMA 75 level of performance.
- Los Bronces and El Soldado copper operations have achieved The Copper Mark certification.
- Our first audits in Steelmaking Coal, using the Towards Sustainable Mining (TSM) standard, were completed at the Capcoal and Aquila mines, with TSM assessments also completed at the Moranbah North and Dawson mines in 2025.
- In 2025, Los Bronces completed their first IRMA audit. Our Quellaveco operation completed an industry first integrated on site audit, combining IRMA and Copper Mark assessments.
- Gahcho Kué has completed the TSM assessment and Venetia has be audited against the RJC Code of Practices.
- Mogalakwena, Mototolo and Amandelbult mines in South Africa and Unki mine in Zimbabwe have been independently assessed against the IRMA Standard. Unki and Mototolo achieved IRMA 75, while Mogalakwena and Amandelbult achieved IRMA 50, completing IRMA audits across all wholly owned PGMs operations prior to demerger.
The success of our business is shared with a wide range of stakeholders, including national governments and host communities, through the significant corporate tax, mining tax and royalty payments that we make. Total taxes and royalties borne and taxes collected amounted to $3,738 million, a 5% decrease compared with the $3,950 million paid in the prior year.
Updated Sustainability Strategy
Designed to be a flexible, living approach, we have updated our Sustainability Strategy to ensure that our sustainability ambitions support delivery of our corporate strategy and deliver tangible value for our business and many stakeholders.
Our updated strategy and targets are for our simplified portfolio and apply from 2026. It continues to be founded on three themes - Trusted Corporate Leader, Healthy Environment, and Thriving Communities - but with renewed areas of focus, concentrating our efforts where they matter most and tailored to what can make the biggest difference for host communities and the natural environment close to our operations.
The principles behind our updated approach are to ensure that we continue to protect and create value for our many stakeholders, while tailoring our longstanding sustainability commitments to a local and business-specific context.
To this end, in our updated Sustainability Strategy, we maintain Group-wide targets on Safety, Climate, Nature, and Livelihoods. We have localised Water, Health, and Education targets to prioritise local needs and maximise positive impact. We are maintaining our strong foundation in human rights and responsible mining and we will continue to use our global voice to advance the case for responsible mining across the industry.
Our updated ambitions and targets are set out below:
Focus area | Ambition |
| Target |
Trusted Corporate Leader |
| ||
Our People | Be a truly inclusive workplace, where every colleague feels safe, valued and supported to thrive. | - Safety: Eliminate all work-related fatalities and foster a safe and resilient operating environment - Health: Ongoing reduction in % workforce potentially exposed to workplace health hazards - Inclusion & Diversity: Increased representation, including 40% women in leadership by 2030 | |
Ethical Business | Operate responsibly and foster trust through deep respect for human rights, meaningful engagement, and applying the highest standards. | - Achieve recognised third-party responsible mine certification for all mining operations | |
Global Voice | Use our voice to shape global standards, catalyse multi-sector impact and advocate for responsible business, driving enduring positive outcomes. | - Pursue advocacy and partnership opportunities that support our strategic ambitions and responsible mining | |
Healthy Environment |
| ||
Climate | Produce carbon neutral metals and minerals that the world needs by 2040.(1) | - Reduce operational emissions by 30% by 2030 (vs. 2020) - Support a Paris-aligned trajectory for the steel industry: targeting an average emissions intensity of 1.3 tCO₂ per tonne of crude steel made from our iron ore by 2040(2) | |
Nature | Deliver nature positive outcomes now and in the future. | - Maintain a continuous, validated pathway to Net Positive Impact on biodiversity throughout the life of our assets | |
Water | Protect, preserve and restore our water catchments to support resilient operations, communities and the environment. | - Business-specific targets focused on key local water priorities and aligned with asset strategy | |
Thriving Communities |
| ||
Livelihoods | Improve local economic opportunities and diversification. | - Support at least 120,000 off-site jobs by 2030 (vs. 2018) | |
Education | Improve quality education for current and future generations with a focus on systems change. | - Business-specific targets improving quality education through systems change | |
Health | Improve health equity by helping to strengthen health systems and addressing local priorities. | - Business-specific targets contributing to strengthening health systems and addressing local health priorities |
(1) For our carbon-neutrality ambition only, this excludes Kumba Iron Ore due to the currently stated life of mine for its assets.
(2) Per ResponsibleSteel data, in 2020 the global average emissions intensity of steel production was 2.8 tCO₂e per tonne of crude steel (tCO2e/t CS). This compares to the estimated emissions intensity of our sold product of 2.2 tCO₂e/t CS in 2020. In 2025, our weighted average emissions intensity was approximately 2.1 tCO₂e/t CS.
The Board
Changes during 2025 to the composition of the Board are set out below.
On 1 January 2025, Anne Wade joined the Board as a non-executive director and a member of the Board's Audit and Sustainability committees.
On 31 December 2025, Hixonia Nyasulu stepped down as a non-executive director of the Board, after six years of service to focus on her wider portfolio.
At the date of this report, four (40%) of the 10 Board directors are female and one (10%) identifies as minority ethnic. The names of the directors at the date of this report and the skills and experience our Board members contribute to the long term sustainable success of Anglo American are set out on the Group's website:
www.angloamerican.com/about-us/leadership-team
Principal risks and uncertainties
Anglo American is exposed to a variety of risks and uncertainties which may have a financial, operational or reputational impact on the Group, and which may also have an impact on the achievement of social, economic and environmental objectives.
The principal risks and uncertainties facing the Group relate to the following:
- Operational events: catastrophic risks
- Economic environment
- Geopolitical
- Cybersecurity
- Operational performance
- Safety
- Corruption
- Portfolio and organisational transformation
Details of any key risks and uncertainties specific to the period are covered in the business reviews on pages 19-34. The principal risks facing the Group at the 2025 year end are set out in detail in the Strategic report section of the Integrated Annual Report 2025, to be published on the Group's website www.angloamerican.com, on 2 March 2026.
Operational and financial business review
Copper
Operational and financial metrics
Production volume | Sales volume | Price | Unit cost* | Group revenue* | Underlying EBITDA* | EBITDA margin* | Underlying EBIT* | Capex* | ROCE* | |||||||||||
kt(1) | kt(2) | c/lb(3) | c/lb(4) | $m(5) | $m | $m | $m | |||||||||||||
Copper Total | 695 | 705 | 475 | 150 | 8,122 | 3,983 | 49 | % | 2,849 | 1,494 | 21 | % | ||||||||
Prior period | 773 |
| 769 |
| 416 |
| 151 |
| 7,572 |
| 3,805 |
| 50 | % | 2,804 |
| 1,598 |
| 23 | % |
Copper Chile | 385 | 395 | 478 | 199 | 4,703 | 1,658 | 35 | % | 900 | 1,117 | 18 | % | ||||||||
Prior period | 466 |
| 463 |
| 416 |
| 181 |
| 4,668 |
| 2,049 |
| 44 | % | 1,398 |
| 1,161 |
| 28 | % |
Los Bronces(6) | 165 | 167 | n/a | 245 | 1,782 | 505 | 28 | % | 169 | 321 | n/a | |||||||||
Prior period | 172 |
| 174 |
| - |
| 273 |
| 1,535 |
| 467 |
| 30 | % | 189 |
| 277 |
| - | |
Collahuasi(7) | 178 | 183 | n/a | 155 | 2,029 | 1,121 | 55 | % | 823 | 741 | n/a | |||||||||
Prior period | 246 |
| 242 |
| - |
| 120 |
| 2,293 |
| 1,447 |
| 63 | % | 1,175 |
| 837 |
| - | |
Other operations(8) | 43 | 45 | n/a | n/a | 892 | 32 | 4 | % | (92 | ) | 55 | n/a | ||||||||
Prior period | 48 |
| 47 |
| - |
| - |
| 840 |
| 135 |
| 16 | % | 34 |
| 47 |
| - | |
Copper Peru (Quellaveco)(9) | 310 | 310 | 472 | 89 | 3,419 | 2,325 | 68 | % | 1,949 | 377 | 26 | % | ||||||||
Prior period | 306 |
| 306 |
| 415 |
| 105 |
| 2,904 |
| 1,756 |
| 60 | % | 1,406 |
| 437 |
| 19 | % |
(1) Shown on a contained metal basis.
(2) Shown on a contained metal basis. Excludes 442 kt third-party sales (2024: 422 kt).
(3) Represents realised copper price and excludes impact of third-party sales.
(4) C1 unit cost includes by-product credits. Total copper unit cost is a weighted average.
(5) Group revenue is shown after deduction of treatment and refining charges (TC/RCs).
(6) Figures on a 100% basis (Group's share: 50.1%).
(7) 44% share of Collahuasi production, sales and financials.
(8) Production and sales are from El Soldado mine (figures on a 100% basis, Group's share: 50.1%). Financials include El Soldado and Chagres (figures on a 100% basis, Group's share: 50.1%), third-party trading, projects, including Sakatti, and corporate costs. El Soldado mine C1 unit costs increased by 7% to 250c/lb (2024: 233c/lb).
(9) Figures on a 100% basis (Group's share: 60%).
Operational performance
Copper Chile
Copper production of 385,000 tonnes decreased by 17% (2024: 466,400 tonnes), primarily due to lower ore grades and copper recovery at Collahuasi.
At Los Bronces, production decreased by 5% to 164,600 tonnes (2024: 172,400 tonnes), primarily due to lower plant throughput as a result of the smaller Los Bronces processing plant being put on care and maintenance at the end of July 2024, partially offset by higher ore grade (0.52% vs 0.47%) and higher copper recoveries from improved plant performance.
At Collahuasi, Anglo American's attributable share of copper production decreased by 28% to 177,800 tonnes (2024: 245,800 tonnes), due to lower ore grade (0.90% vs 1.15%) as well as a higher than expected level of oxidisation in the stockpiles impacting copper recovery. This was partially offset by higher plant throughput as a result of improved water availability from the third quarter, as Collahuasi started receiving ultra-filtered sea water through the pipeline infrastructure of the new desalination plant.
Production at El Soldado decreased by 12% to 42,600 tonnes (2024: 48,200 tonnes), reflecting the planned lower grade (0.83% vs 0.94%) from processing lower grade stockpiles due to the transition between the mine phases.
Copper Peru
Quellaveco production increased by 1% to 310,200 tonnes (2024: 306,300 tonnes), primarily due to strong plant performance which increased throughput by 3%, despite slightly lower grades (0.74% vs 0.76%) as the mine works through natural fluctuations in grade profile.
Markets
31 December 2025 | 31 December 2024 | |
Average market price (c/lb) | 451 | 415 |
Average realised price (Copper Chile - c/lb) | 478 | 416 |
Average realised price (Copper Peru - c/lb) | 472 | 415 |
The differences between the market price and the realised prices are largely a function of provisional pricing adjustments and the timing of sales across the year.
The copper market has experienced a volatile year, navigating persistent US tariff uncertainty and high-profile supply disruptions that have affected both the refined and concentrate markets. Global mine supply growth was negligible and, when coupled with supply disruption from existing operations, this boosted sentiment at various points during the year as well as contributing to record low spot-treatment terms for copper concentrates. The global refined market nevertheless remained in surplus, with copper inventories climbing over the course of the year. The copper price ended 2025 strongly, primarily reflecting the effect that US copper tariff policies have had on physical flows of cathode, exchange prices and regional premia, with the LME copper contract setting an annual intraday high of 581 c/lb in December and average prices reaching 451 c/lb, up 9% compared to the prior year (2024: 415 c/lb). Longer-term copper prices are expected to remain well supported by continued electrification and energy transition infrastructure investment.
Financial performance
Underlying EBITDA for Copper increased by 5% to $3,983 million (2024: $3,805 million), driven by a higher copper price, offsetting the lower sales volumes.
Copper Chile
Underlying EBITDA decreased by 19% to $1,658 million (2024: $2,049 million), primarily driven by higher unit costs, charges relating to long-term rehabilitation provisions and lower sales volumes. This was partially offset by higher copper prices. C1 unit costs increased by 10% to 199 c/lb (2024: 181 c/lb), reflecting the impact of lower production coupled with a shift in the production mix between Los Bronces and Collahuasi, partially offset by the benefit of higher by-product credits and lower treatment and refining charges.
Capital expenditure decreased by 4% to $1,117 million (2024: $1,161 million), driven by lower expenditure at Collahuasi on the desalination plant project.
Copper Peru
Underlying EBITDA increased by 32% to $2,325 million (2024: $1,756 million), reflecting the benefit of higher copper prices and lower C1 unit costs. C1 unit costs decreased by 15% to 89 c/lb (2024: 105 c/lb), reflecting the benefit from lower treatment and refining charges, and strong management of mining costs to hold them flat despite higher mine movement and throughput.
Capital expenditure decreased by 14% to $377 million (2024: $437 million), reflecting the completion of several phases of the tailings management facility.
Operational outlook
Copper Chile
Los Bronces
Los Bronces is a world-class copper deposit, accounting for more than 2% of the world's known copper resources. The mine is ahead of schedule on the development of Donoso 2, with this phase allowing wider access to higher-grade, softer ore. Development activities for this phase continue and it is expected to be fully opened by early 2027.
The improved mine flexibility, tight cost control and the strong copper price environment have enabled us to temporarily restart the second, smaller processing plant at Los Bronces. This allows for profitable production from the second plant until the infrastructure is needed for the removal of the Perez Caldera tailings storage facility, which is expected to start in 2027. The second plant is expected to produce an additional c.25,000 tonnes of profitable production in 2026.
The first phase of the Los Bronces integrated water security project is ongoing and will ramp up during 2026, securing a large portion of the mine's water needs through a desalinated water supply.
Beyond the near-term open-pit development that is under way, Anglo American remains committed to delivering long-term value through the Los Bronces and Andina joint mine plan to unlock an additional 2.7 million tonnes of copper production over a 21-year period, with c.15% lower unit costs relative to standalone operations and minimal incremental capital expenditure. Production under this joint plan is currently projected to commence in 2030(1), once relevant permits are in place.
The Los Bronces underground project offers further longer-dated expansion optionality.
Collahuasi
Collahuasi is a world-class orebody with significant growth potential, accounting for more than 2% of the world´s known copper resources with over 2.6 billion tonnes of sulphide Ore Reserves at 0.96% TCu grade. The mine is currently transitioning between phases in the main Rosario pit and is expected to continue drawing on lower grade stockpiles while access to fresh, higher grade ore progressively improves through 2026. Debottlenecking projects are in execution and are expected to add c.25,000 tonnes per annum (tpa) (our 44% share) of production from late 2027. Beyond that, work is continuing to unlock significant synergies from the potential operational integration and optimisation of Collahuasi with the neighbouring Quebrada Blanca mine. Timing is subject to joint venture negotiations and permitting, with a target for first production as early as 2030. Studies continue for a stand-alone Collahuasi fourth processing line in the plant and mine expansion. Continued progress will be dependent on the discussions and studies for the adjacency project outlined above.
The desalination plant, which is currently under construction, will meet a large portion of the mine's water requirements by mid-2026 when fully operational and has been designed to accommodate capital-efficient expansion to support the fourth processing line expansion option. Until then, the operation continues to progress mitigation measures to optimise and reduce water consumption, including the provision of ultra-filtered sea water that was delivered in July and ramped up during the second half of 2025.
El Soldado
Production in 2026 is expected to be c.35,000 tonnes due to planned lower ore grades, with output projected to progressively decline to c.25,000 tpa by 2028. The environmental permit for the life extension of the operation is expected to be submitted in the first quarter of 2026.
Copper Chile
These factors are reflected in the guidance provided on pages 35-36. Production guidance for 2026 is 390,000-420,000 tonnes and is subject to water availability. Production is expected to be weighted to the second half of 2026 given the progressive improvement in access to fresh, higher grade ore at Collahuasi.
2026 unit cost guidance is c.230 c/lb(2), higher than the 2025 unit cost of 199 c/lb. The increase reflects the impact of a stronger Chilean peso and the production mix between Los Bronces and Collahuasi.
Copper Peru
Quellaveco in Peru remains a cornerstone of our portfolio of world-class copper assets, with a mine plan designed to stably and competitively produce on average c.300,000 tonnes of copper per annum until the end of the decade.
After five years of operating, planned plant maintenance will be carried out on the concentrator, including the mills and conveyors; this is expected to occur in 2027 modestly impacting production.
Significant expansion potential exists that could sustain production beyond the initial high-grade area. The original plant throughput design capacity was 127,500 tonnes per day (tpd). Following regulatory approvals to increase throughput to 150,000 tpd, a debottlenecking strategy was implemented to provide added flexibility to design optimal throughput for the plant with limited configuration changes, subject to sectorial permits associated with the specific design and water availability.
In light of this, the stage one expansion was approved and will increase throughput to c.142,000 tpd and improve recoveries by late 2026; this involves the installation of a second pebble crusher and additional flotation cells. Quellaveco has demonstrated strong plant performance throughout 2025, with throughput rates continuing to exceed the design capacity of the plant, and recoveries improving since the start of the year, with the ongoing continued optimisation of the coarse particle recovery plant. This expansion will enable the operation to embed this performance consistently.
The stage one expansion project represents the first stage to full optimisation of the plant with minimal capital investment, delivering robust returns. Studies will continue to further debottleneck the plant beyond 150,000 tpd, while conducting early studies to support Quellaveco's long-term expansion prospects, underpinned by an exploration drilling campaign below and around the current pit shell, which to date has yielded promising results.
These factors are reflected in the guidance provided on pages 35-36. Production guidance for Peru for 2026 is 310,000-340,000 tonnes. Production is expected to be weighted to the second half of 2026 owing to the expected grade profile. 2026 unit cost guidance is c.100 c/lb(2), higher than the 2025 unit cost of 89 c/lb, reflecting the impact of higher labour and maintenance costs, coupled with a stronger Peruvian sol.
(1) The definitive agreement on the Los Bronces/Andina joint mine plan is subject to a number of conditions, including customary regulatory approvals and implementation of the joint mine plan is subject to securing the relevant environmental permits.
(2) The copper unit costs are impacted by FX rates and pricing of by-products, such as molybdenum. 2026 unit cost guidance was set at c.860 CLP:USD for Chile and c.3.2 PEN:USD for Peru.
Premium Iron Ore
Operational and financial metrics
Production volume | Sales volume | Price | Unit cost* | Group revenue* | Underlying EBITDA* | EBITDA margin* | Underlying EBIT* | Capex* | ROCE* | |||||||||||
| Mt(1) | Mt(1) | $/t(2) | $/t(3) | $m | $m |
| $m | $m |
| ||||||||||
Premium Iron Ore Total | 60.8 | 61.5 | 93 | 37 | 6,651 | 2,873 | 43 | % | 2,179 | 1,159 | 19 | % | ||||||||
Prior period | 60.8 |
| 60.9 |
| 89 |
| 35 |
| 6,573 |
| 2,655 |
| 40 | % | 2,135 |
| 945 |
| 20 | % |
Kumba - South Africa(4) | 36.1 | 37.0 | 95 | 40 | 3,902 | 1,736 | 44 | % | 1,327 | 556 | 38 | % | ||||||||
Prior period | 35.7 |
| 36.2 |
| 92 |
| 39 |
| 3,796 |
| 1,581 |
| 42 | % | 1,260 |
| 527 |
| 40 | % |
Minas-Rio - Brazil | 24.8 | 24.5 | 89 | 32 | 2,749 | 1,137 | 41 | % | 852 | 603 | 13 | % | ||||||||
Prior period | 25.0 |
| 24.7 |
| 84 |
| 30 |
| 2,777 |
| 1,074 |
| 39 | % | 875 |
| 418 |
| 15 | % |
(1) Production and sales volumes are reported as wet metric tonnes. Product is shipped with c.1.5% moisture from Kumba and c.9% moisture from Minas-Rio.
(2) Prices for Kumba are the average realised export basket price (FOB Saldanha) (wet basis). Prices for Minas-Rio are the average realised export basket price (FOB Brazil) (wet basis). Prices for total premium iron ore are a weighted average.
(3) Unit costs are reported on an FOB wet basis. Unit costs for total premium iron ore are a weighted average.
(4) Sales volumes and realised price could differ to Kumba's stand-alone reported results due to sales to other Group companies.
Operational performance
Kumba(1)
Total production of 36.1 Mt was marginally higher than the prior year (2024: 35.7 Mt), reflecting strong operational performance from Kolomela, where production increased by 7% to 10.8 Mt (2024: 10.1Mt). Production at Sishen was slightly lower at 25.3 Mt (2024: 25.7 Mt) following a proactive drawdown of high mine stockpiles and maintenance to facilitate implementation of the ultra-high-dense-media-separation (UHDMS) project.
Consequently, sales volumes increased by 2% to 37.0 Mt (2024: 36.2 Mt), supported by third-party rail performance improving by 6% to 37.6 Mt (2024: 35.6 Mt). Total finished stock remained flat year-on-year at 7.5 Mt, with stock at the mines decreasing by 1.2 Mt to 5.7 Mt and stock at the port increasing by 1.3 Mt to 1.8 Mt.
Minas-Rio
Minas-Rio maintained production at 24.8 Mt (2024: 25.0 Mt), despite the impact of the 23-day planned shutdown for pipeline inspection activities, enabled by strong operational delivery from consistent integrated system performance.
Markets
31 December 2025 | 31 December 2024 | |
Average market price (Platts 62% Fe CFR China - $/tonne) | 102 | 109 |
Average market price (Fastmarkets(2) 65% Fe Fines CFR - $/tonne) | 116 | 123 |
Average realised price (Kumba export - $/tonne) (FOB wet basis) | 95 | 92 |
Average realised price (Minas-Rio - $/tonne) (FOB wet basis) | 89 | 84 |
The 65-62 differential averaged around $13/dmt in 2025, slightly below the previous year, as the brief improvement in Chinese steel mill profitability at the start of the year proved transitory, and weak property market in China continued to weigh on demand, pushing mills to prioritise exports and cost control. Longer term, demand for premium iron ore remains supported by steelmakers' efficiency drive and the shift to low-carbon steelmaking, with the Carbon Border Adjustment Mechanism (CBAM) implementation in Europe and China's National Carbon Emission Trading System (CETS) expansion to the domestic steel industry. Lump premium averaged $0.14/dmtu in 2025, broadly unchanged from the previous year, however, it ended the year at near historic lows of $0.04/dmtu reflecting an increase in product supply from Australia and Brazil. Nonetheless, market conditions are likely to improve with limited medium term supply growth fuelling a recovery in premia from current levels.
Kumba's FOB realised price of $95/wet metric tonne (wmt) for the full year was 12% higher than the equivalent Platts 62% Fe FOB Saldanha market price (adjusted for moisture) of $85/wmt, reflecting the benefit of premiums for our iron content (64.0% Fe) and lump product (approximately 67%).
Minas-Rio's pellet feed product is higher grade (with iron content of c.67% and lower impurities) so the Fastmarkets(2) 65 Fines index is used when referring to the Minas-Rio product. The Minas-Rio full-year realised price of $89/wmt FOB was 6% higher than the equivalent Fastmarkets(2) 65 FOB Brazil index (adjusted for moisture) of $84/wmt FOB, benefiting from the premium for our high-quality product, including higher (~67%) Fe content.
Financial performance
Underlying EBITDA for Premium Iron Ore increased by 8% to $2,873 million (2024: $2,655 million), as the higher realised price, penalty income from Transnet at Kumba, and higher sales volumes were partially offset by an increase in unit costs.
Kumba(1)
Underlying EBITDA was 10% higher at $1,736 million (2024: $1,581 million), due to a higher realised price, increased sales volumes and penalty income from Transnet. Unit costs were marginally higher at $40/tonne (2024: $39/tonne), as a result of the stronger South African rand and inflation, partially offset by the realisation of embedded workforce related cost reductions from the prior year.
Capital expenditure increased by 6% to $556 million (2024: $527 million) reflecting higher spend on the UHDMS project, which ramped up in the second half of the year, and higher deferred stripping capitalisation, partially offset by lower stay-in-business spend.
Minas-Rio
Underlying EBITDA increased by 6% to $1,137 million (2024: $1,074 million), driven by a higher realised price, partially offset by higher unit costs. Unit costs increased by 7% to $32/tonne (2024: $30/tonne), mainly reflecting the planned pipeline inspection costs and inflationary pressure on input costs, partially offset by a weaker Brazilian real and by operational and cost efficiencies.
Capital expenditure was 44% higher at $603 million (2024: $418 million), primarily associated with the completion of the tailings filtration plant project and planned mine equipment replacement spend.
Operational outlook
Kumba
Production is expected to remain at 35-37 Mtpa in the near term reflecting logistics availability, with the exception of 2026, which is impacted by the tie-in of the UHDMS project. This is planned in the second half of 2026, reducing production to 31-33 Mt, with sales volumes not expected to be impacted owing to the planned drawdown of finished stock.
These factors are reflected in the guidance provided on pages 35-36. Production guidance for 2026 is 31-33 Mt, subject to third-party rail and port availability and performance. 2026 unit cost guidance is c.$45/tonne(3), higher than the 2025 unit cost of $40/tonne, primarily reflecting the impact of the stronger South African rand.
Minas-Rio
Production is expected to be 24-26 Mtpa in 2026 and 2027, reflecting strong operational performance and higher recoveries enabled by stable ore feed at the plant.
In 2028, production is expected to slightly reduce to 23-25 Mtpa as the mine moves into areas with more ore feed variability, offsetting the throughput benefit from the recleaner flotation columns implementation. Work is ongoing to increase the maturity of other capital projects to optimise value and enhance cash generation, while the options to integrate and maximise the long-term value of the contiguous Serra da Serpentina higher-grade iron ore Mineral Resource are currently being evaluated.
In parallel, Minas-Rio is focused on increasing tailings storage capacity. The tailings filtration plant project started its ramp-up in December 2025, ahead of schedule, and additional disposal options continue to be studied.
These factors are reflected in the guidance provided on pages 35-36. Production guidance for 2026 is 24-26 Mt. 2026 unit cost guidance is c.$36/tonne(3), higher than 2025 of $32/tonne, reflecting the increased processing cost associated with the tailings filtration plant as well as the stronger Brazilian real and inflation.
(1) Production and sales volumes, stock and realised price are reported on a wet basis and could differ from Kumba's stand-alone results due to sales to other Group companies.
(2) Formerly known as Metal Bulletin.
(3) 2026 unit cost guidance was set at c.16.00 ZAR:USD for Kumba and c.5.3 BRL:USD for Minas-Rio.
Manganese
Operational and financial metrics
Production volume | Sales volume | Group revenue* | Underlying EBITDA* | EBITDA margin* | Underlying EBIT* | Capex* | ROCE* | |||||||||
| Mt | Mt | $m | $m |
| $m | $m |
| ||||||||
Manganese | 3.0 | 2.9 | 472 | 127 | 27 | % | 54 | - | 24 | % | ||||||
Prior period | 2.3 |
| 1.9 |
| 359 |
| 116 |
| 32 | % | 31 |
| - |
| 16 | % |
Operational performance
Attributable manganese ore production increased by 30% to 3.0 Mt (2024: 2.3 Mt), reflecting more normalised production levels following the impact of the temporary suspension caused by tropical cyclone Megan in Australia in March 2024, with export operations resuming in the second quarter of 2025.
The sale of the South African manganese alloy smelter, which had been on care and maintenance since March 2020, was completed in June 2025, in line with expectations.
Financial performance
Underlying EBITDA increased by 9% to $127 million (2024: $116 million), driven by higher sales volumes following the resumption of exports earlier in 2025 after the damage caused by the tropical cyclone in March 2024 at the Australian operation, as well as lower operating costs. This more than offset the impact of lower insurance proceeds year-on-year as well as the weaker average realised manganese ore price. Insurance proceeds of $101 million for the cyclone damage were received in 2025, taking the total received since the incident to $221 million (40% attributable share basis).
The 2025 average benchmark for high-grade manganese ore (Fastmarkets(1) 44% manganese ore CIF China) decreased by 20% to $4.44/dmtu (2024: $5.56/dmtu), as seaborne supply recovered after the cyclone impact in 2024. Prices have been relatively stable in 2025, in the range of typical historical levels, with growth in demand from manganese-bearing battery chemistries being countered by weak margins in global steelmaking and at manganese alloy producers in China.
(1) Formerly known as Metal Bulletin.
Crop Nutrients
Operational and financial metrics
Production volume | Sales volume | Group revenue* | Underlying EBITDA* | EBITDA margin* | Underlying EBIT* | Capex* | ROCE* | |||||||||
| $m | $m |
| $m | $m |
| ||||||||||
Crop Nutrients | n/a | n/a | 195 | (66 | ) | n/a | (67 | ) | 312 | n/a | ||||||
Prior period | - |
| - |
| 188 |
| (34 | ) | - |
| (35 | ) | 834 |
| - |
|
Woodsmith project | n/a | n/a | - | n/a | n/a | n/a | 312 | n/a | ||||||||
Prior period | - |
| - |
| - |
| - |
| - |
| - |
| 834 |
| - |
|
Other(1) | n/a | n/a | 195 | (66 | ) | n/a | (67 | ) | n/a | n/a | ||||||
Prior period | - |
| - |
| 188 |
| (34 | ) | - |
| (35 | ) | - |
| - |
|
(1) Other comprises projects and corporate costs as well as the share in associate results from The Cibra Group, a fertiliser distributor based in Brazil.
Crop Nutrients
Anglo American is developing the Woodsmith project, a large, long-life Tier 1 asset in the north east of England, to access the world's largest known deposit of polyhalite - a natural mineral fertiliser containing low-chloride potassium, sulphur, magnesium and calcium - four of the six nutrients that every plant needs to grow.
Woodsmith is located on the North Yorkshire coast, just south of Whitby, where polyhalite ore will be extracted via two 1,600-metre deep mine shafts (a service shaft and a production shaft) and then transported to the port area in Teesside via an underground conveyor belt in a 37 km mineral transport system (MTS) tunnel, thereby minimising any environmental impact on the surface. The polyhalite can then be granulated into POLY4, our comparatively low-carbon multi-nutrient polyhalite product, at a materials handling facility in the port area, before being exported to a network of customers around the world from the priority access port facility.
Progress update
Woodsmith project
In 2024, we announced that in order to support balance sheet deleveraging, we would slow the pace of development of the Woodsmith project in the near term. The slowdown was completed in the first quarter of 2025, with activities currently focused on critical value-adding works to de-risk the overall project schedule, preserve progress in other areas, and further optimise certain scopes of the project to be ready for ramp-up, subject to the final investment decision (FID).
We are continuing to sink the service shaft in order to progress through the Sherwood sandstone strata - a hypersaline water-bearing layer of hard rock - where the rate of progress is helping determine the overall project schedule which will inform the FID. As planned during 2025, the service shaft began sinking through the sandstone strata and is currently at a depth of 874 metres of the total 1,600-metre depth. Sinking activities on the production shaft were paused in June 2024 at 712 metres of the total 1,600-metre depth. The MTS tunnel has continued at a significantly reduced pace, reaching the 30 km milestone in December 2025 - more than 80% of the total 37 km length.
Value-preservation work during the slowdown period also includes maintenance of key permits and preservation of land rights to allow project ramp-up in due course, while execution of the critical study programme is focused on enhancing the project's configuration.
Market development
Polyhalite products provide farmers with a fertiliser solution to tackle the three key challenges facing the food industry today - the increasing demand for food from less available agricultural land; the need to reduce the environmental impact of farming; and the deteriorating health of soils.
Our market development activities continue and, in 2025, we expanded sales of POLY4 into key selling regions of Europe, North America, China and India, working with existing distribution partners and future customers to develop global demand for polyhalite through realised product sales, and maximise its value-creation potential. Feedback from the sales programme has been positive, and we plan to further extend the programme in 2026 to gain further insights and information to support the study programme.
In May 2025, we published a report looking into the 'Future of Fertiliser' that brought together the voices of a diverse group of 74 agricultural experts to consider how agriculture will have changed by 2050. It confirmed the need for the fertiliser industry to recognise the value of sustainability, balanced nutrition, and soil health to ensure food security. The qualities and characteristics of POLY4, confirmed through more than 2,500 field demonstrations to date on over 80 crops, fit neatly into the long-term gaps the agricultural industry is facing. To further validate this, we are also continuing progress on our pioneering five-year research project with the International Atomic Energy Agency, an organisation within the United Nations' Food and Agriculture Organization (FAO) announced in 2024, into the beneficial impact polyhalite could have in reducing salt levels in soil - a major factor in the degradation of soil health globally.
In December 2025, our research paper into the yield enhancement qualities of POLY4 was published by a recognised leading scientific research body, validating POLY4's ability to increase crop yields by 3-5% compared to standard practice, and further validating the superior quality of our unique product.
2026 Mitsubishi investment
In support of the first two of these conditions, Anglo American has entered into an investment agreement and related shareholders' agreement with Mitsubishi Corporation (Mitsubishi) to support continued development of Woodsmith, including working together on market development and financing opportunities designed to further enhance the existing market development programme. Together, Anglo American and Mitsubishi will explore opportunities to build out demand for POLY4, including providing financial and commercial resources to accelerate pilot sales and leveraging Mitsubishi's extensive networks across food and agriculture sectors to broaden market development across key markets and related business development and strategic partner engagement, which will contribute to optimising the project in the feasibility study phase, prior to submission to the Board for approval.
The agreements include an initial equity investment by Mitsubishi in Woodsmith. Through its investment and involvement in the ongoing development of Woodsmith at this stage, Mitsubishi also intends to evaluate its participation in a future financing plan at the time of the Anglo American Board's final investment decision, currently anticipated from 2028 subject to meeting the above conditions, with potential for Mitsubishi to acquire an equity interest of 25% or other such amount subject to negotiations at that time. The agreements extend the longstanding successful partnership between Anglo American and Mitsubishi Corporation, while allowing for additional investment and the involvement of other partners, and represents a pathway for Anglo American to syndicate a significant minority share of its interest in Woodsmith.
2026 project update
Board approval for Woodsmith remains subject to completion of the feasibility study showing robust economic potential; a clear pathway to syndication; and sufficient deleveraging of the Group balance sheet.
Given the progress in our development of Woodsmith during the current phase of reduced capital expenditure, designed to preserve the option value of the project, Anglo American will continue funding critical activities, with capital expenditure of c.$0.25 billion and operating expenditure of c.$0.05 billion in 2026 and 2027(1). Total Group capital expenditure for the simplified portfolio is unchanged over this period. This investment will be focused on progressing activities required to continue to de-risk the project's critical path, including continued sinking of the service shaft, and market development activities, to inform the feasibility study and enhance the value of the project prior to any final investment decision by the Board.
(1) Previously nil capital expenditure in 2026 and 2027, with operating expenditure of c.$0.1 billion in 2026.
De Beers - Diamonds
Operational and financial metrics(1)
Production volume | Sales volume |
Price | Unit cost* | Group revenue* | Underlying EBITDA* | EBITDA margin(6) | Underlying EBIT* | Capex* | ROCE* | |||||||||||||
| '000 cts | '000 cts(2) | $/ct(3) | $/ct(4) | $m(5) | $m | $m | $m |
| |||||||||||||
De Beers | 21,656 | 20,946 | 142 | 86 | 3,493 | (511 | ) | (15 | ) | % | (787 | ) | 353 | (22 | ) | % | ||||||
Prior period | 24,712 |
| 17,883 |
| 152 |
| 93 |
| 3,292 |
| (25 | ) | (1 | ) | % | (349 | ) | 536 |
| (6 | ) | % |
Botswana | 15,134 | n/a | 110 | 38 | n/a | 381 | n/a | 334 | 70 | n/a | ||||||||||||
Prior period | 17,935 |
| - |
| 143 |
| 39 |
| - |
| 241 |
| - | 185 |
| 83 |
| - | ||||
Namibia | 2,082 | n/a | 353 | 244 | n/a | 89 | n/a | 47 | 18 | n/a | ||||||||||||
Prior period | 2,234 |
| - |
| 426 |
| 295 |
| - |
| 121 |
| - | 82 |
| 41 |
| - | ||||
South Africa | 2,230 | n/a | 66 | 110 | n/a | (127 | ) | n/a | (187 | ) | 148 | n/a | ||||||||||
Prior period | 2,166 |
| - |
| 85 |
| 115 |
| - |
| (54 | ) | - | (126 | ) | 312 |
| - | ||||
Canada | 2,210 | n/a | 50 | 51 | n/a | 17 | n/a | (35 | ) | 83 | n/a | |||||||||||
Prior period | 2,377 |
| - |
| 79 |
| 56 |
| - |
| 45 |
| - | 11 |
| 63 |
| - | ||||
Trading | n/a | n/a | n/a | n/a | n/a | (424 | ) | (15 | ) | % | (428 | ) | 2 | n/a | ||||||||
Prior period | - |
| - |
| - |
| - |
| - |
| (50 | ) | (3 | ) | % | (54 | ) | 1 |
| - | ||
Other(7) | n/a | n/a | n/a | n/a | n/a | (447 | ) | n/a | (518 | ) | 32 | n/a | ||||||||||
Prior period | - |
| - |
| - |
| - |
| - |
| (328) | - | (447) | 36 | - | |||||||
(1) Prepared on a consolidated accounting basis, except for production, which is stated on a 100% basis except for the Gahcho Kué joint operation in Canada, which is on an attributable 51% basis.
(2) Total sales volumes on a 100% basis were 23.9 million carats (2024: 19.4 million carats). Total sales volumes (100%) include De Beers Group's joint arrangement partners' 50% proportionate share of sales to entities outside De Beers Group from Diamond Trading Company Botswana and Namibia Diamond Trading Company.
(3) Pricing for the mining businesses is based on 100% selling value post-aggregation of goods. Realised price includes the price impact of the sale of non-equity product and, as a result, is not directly comparable to the unit cost.
(4) Unit cost is based on consolidated production and operating costs, excluding depreciation and operating special items, divided by carats recovered.
(5) Includes consolidated rough diamond sales of $3.0 billion (2024: $2.7 billion).
(6) EBITDA margin on a total reported basis. On an equity basis, and excluding the impact of non-mining activities, third‑party sales, purchases, trading, Brands & Diamond Desirability, and corporate, the adjusted EBITDA margin is 34% (2024: 35%).
(7) Other includes Element Six, Brands & Diamond Desirability, and Corporate.
Markets
Rough diamond trading conditions remained challenging throughout 2025 amid persistent industry, geopolitical and tariff uncertainty. While demand for larger, higher-quality diamonds strengthened through the year, demand for smaller and lower-quality diamonds experienced pressure in light of the growing supply from other producers.
Polished wholesale diamond prices showed signs of stabilisation early in the year, but sentiment weakened sharply following the introduction of US tariffs on Indian exports. India remains the main cutting centre for natural diamonds and the US remains the largest end-market for diamond jewellery.
Demand for natural diamonds at the retail level proved resilient, although retail sales of laboratory-grown diamonds continue to have an impact. In the US, strong performance in higher-end categories largely offset reduced demand at the lower end of the assortment. India continued to deliver robust growth while demand in China remained muted.
Operational performance
Mining
The mining operations delivered solid operational performance at lower output levels, as the business produced into prevailing demand. Consequently, rough diamond production reduced by 12% to 21.7 million carats (2024: 24.7 million carats).
In Botswana, production reduced by 16% to 15.1 million carats (2024: 17.9 million carats), following planned reductions at Orapa, including extended maintenance downtime, and the transition of the Letlhakane Tailings Treatment Plant into care and maintenance(1). This built on actions already taken in 2024 to lower production levels at Jwaneng.
Production in Namibia decreased 7% to 2.1 million carats (2024: 2.2 million carats), driven by output reductions at Debmarine Namibia through the decommissioning of the Coral Sea and Grand Banks vessels, partially offset by higher-grade ore and improved recoveries at Namdeb.
In South Africa, production at Venetia remained at low levels consistent with prior year at 2.2 million carats (2024: 2.2 million carats), as the underground project progressed in line with the recently reconfigured plan.
Production in Canada decreased 7% to 2.2 million carats (2024: 2.4 million carats), largely due to the planned treatment of lower-grade ore.
Financial performance
Challenging rough diamond trading conditions persisted, with total revenue remaining subdued at $3.5 billion (2024: $3.3 billion), including rough diamond sales of $3.0 billion (2024: $2.7 billion). Total rough diamond consolidated sales volumes of 20.9 million carats (2024: 17.9 million) were broadly in line with De Beers' share of production globally as the business supplied into areas experiencing demand.
The full year consolidated average realised price declined by 7% to $142 per carat (2024: $152 per carat), primarily due to a 12% decrease in the average rough price index and the impact of stock rebalancing initiatives (whereby low-demand assortments are sold at lower prices), partially offset by strong demand for higher value stones. The average rough price index does not reflect the impact of rebalancing initiatives. The equivalent price index reduction including the impact of stock rebalancing action would be a 25% year-on-year decrease.
Lower average rough price index and stock rebalancing initiatives had a significant impact on earnings, resulting in an underlying EBITDA loss of $511 million (2024: loss of $25 million). This was primarily due to the impact of the stock rebalancing initiatives in the trading business, whereby stock on the balance sheet which was purchased at a higher price, was subsequently sold at a significantly lower effective index generating trading losses of $424 million (2024: loss of $50 million). Further, the prior year also benefited from the one-off sale of a non-diamond royalty right of $127 million.
Unit costs reduced by 8% to $86/ct, with lower rough diamond production volumes being more than offset by cost reduction initiatives across the operations.
Capital expenditure decreased by 34% to $353 million (2024: $536 million), reflecting cash preservation measures with the rephasing of Venetia underground life extension and rationalisation of stay-in-business capex spend.
An impairment of $2.3 billion (before tax and non-controlling interests) (2024: $2.9 billion) to Anglo American's carrying value of De Beers has been recognised within special items and remeasurements, driven by lower forecasted prices than previously, due to greater shifting of customer preference between natural diamonds and laboratory-grown diamonds, and surplus of available rough diamonds relative to prevailing demand. Please refer to note 11 in the Condensed financial statements for further details.
Corporate strategy
De Beers continued the delivery of its Origins strategy in 2025, focused on streamlining the business whilst revitalising consumer desire for natural diamonds.
Key highlights included signing the Luanda Accord (which cements a government-industry marketing commitment for natural diamonds); launching new, large-scale natural diamond marketing campaigns in the US and India; and launching a new branded polished diamond offering, ORIGIN De Beers Group, backed by the Tracr™ traceability platform, differentiating De Beers Group's responsibly sourced diamonds at the retail level.
De Beers also advanced its brand portfolio strategy during the year, with De Beers London unveiling a refreshed identity, opening new franchised stores in Dubai and Manchester and opening its Paris flagship in January 2026. Forevermark continued its evolution into a premium De Beers-owned jewellery retail brand in India, while winding down its former global licensed model.
The business delivered on its multi-year cost reduction target, achieving over $100 million cumulative overhead cost savings through the streamlining strategy.
Market outlook
Near-term trading conditions are expected to remain challenging. Continued macro-economic volatility, conservative inventory management in the midstream and laboratory-grown diamond penetration are expected to limit rough diamond demand in the near term. In the medium term, gradual normalisation of inventory levels provide a foundation for improvement. While the full differentiation of natural diamonds and laboratory-grown diamonds is expected in the medium term, it has been delayed as some retailers seek to maintain high retail margins on laboratory-grown stones despite the continued reduction in wholesale prices.
Consumer demand is expected to remain stable in the US and India, particularly in the higher-end product areas, while a gradual recovery in China is expected as economic conditions stabilise.
Operational outlook
Production guidance for 2026 is 21-26 million carats (100% basis). De Beers continues to monitor rough diamond trading conditions in order to align output with prevailing demand.
Unit cost guidance for 2026 is c.$80 per carat(2), lower than the 2025 unit cost of $86/ct, reflecting the benefit of slightly higher production volumes and ongoing cost-control measures.
As previously announced, Anglo American continues to pursue a dual track separation for De Beers and a structured sale process is currently under way.
(1) Orapa constitutes the Orapa Regime which includes Orapa, Letlhakane and Damtshaa. Letlhakane was placed on care and maintenance March 2025, and Damtshaa has been on care and maintenance since 2021.
(2) Unit cost is based on De Beers' proportionate consolidated share of costs and associated production. 2026 unit cost guidance was set at c.16.00 ZAR:USD.
Corporate and Other
Financial metrics
Group revenue* | Underlying EBITDA* | Underlying EBIT* | Capex* | |||||
| $m | $m | $m | $m | ||||
Corporate and Other | 392 | 11 | (193 | ) | 4 | |||
Prior period (2) | 499 |
| (195 | ) | (545 | ) | 22 |
|
Exploration | n/a | (105 | ) | (105 | ) | - | ||
Prior period (2) | - |
| (118 | ) | (118 | ) | 1 |
|
Corporate activities and unallocated costs(1) | 392 | 116 | (88 | ) | 4 | |||
Prior period (2) | 499 |
| (77 | ) | (427 | ) | 21 |
|
(1) Revenue within Corporate activities and unallocated costs primarily relates to third-party shipping activities, as well as the Marketing business's trading activities from energy solutions and other ancillary products.
(2) Comparative figures are re-presented to include Nickel trading activities that are outside the perimeter of the sale of the Nickel business as well as intercompany interest transactions with discontinued operations. Refer to note 4 to the Condensed financial statements for more detail.
Financial overview
Exploration
Exploration expenditure was $105 million, 11% lower than the prior year (2024: $118 million), due to planned lower spend.
Corporate activities and unallocated costs
Underlying EBITDA was $116 million (2024: $77 million loss). The improved result was primarily driven by the impact of the Grosvenor gas ignition claim paid by the Group's self-insurance entity in 2024. Cost savings following the initiation of the transformational changes and the consequent refocusing on key strategic projects were offset by reduced margins from the Marketing business's shipping activities due to lower freight rates.
Discontinued Operations
Operational and financial metrics
Production volume(1) | Sales volume(3) | Price(4) | Unit cost* | Group revenue* | Underlying EBITDA* | EBITDA margin* | Underlying EBIT* | Capex* | ROCE* | |||||||||||||
| Mt/t/koz(2) | Mt/t/koz(2) | $/t/c/lb/$/PGM oz(5) | $m | $m |
| $m | $m |
| |||||||||||||
Steelmaking Coal(6) | 8.2 | 7.9 | 158 | 141 | 1,402 | (156 | ) | (9 | ) | % | (214 | ) | 339 | (6 | ) | % | ||||||
Prior period | 14.5 |
| 14.4 |
| 232 |
| 124 |
| 3,520 |
| 924 |
| 26 | % | 480 |
| 468 |
| 15 | % | ||
Nickel | 39,700 | 40,200 | 6.18 | 510 | 551 | 6 | 1 | % | 1 | 41 | (2 | ) | % | |||||||||
Prior period | 39,400 |
| 38,500 |
| 6.82 |
| 481 |
| 617 |
| 108 |
| 18 | % | 96 |
| 74 |
| 14 | % | ||
PGMs | 1,188 | 1,134 | 1,506 | 1,149 | 1,773 | 217 | 12 | % | 67 | 353 | n/a | |||||||||||
Prior period | 3,553 |
| 4,078 |
| 1,468 |
| 957 | 5,962 |
| 1,106 |
| 19 | % | 668 |
| 1,013 |
| 10 | % | |||
(1) SMC production volumes are saleable tonnes, excluding thermal coal production of 1.2 Mt (2024: 1.1 Mt). Includes production relating to third-party product purchased and processed at Anglo American's operations, and may include some product sold as thermal coal. PGMs production reflects own-mined production and purchase of metal in concentrate. PGMs volumes consist of 5E metals and gold.
(2) SMC volumes measured in Mt, Nickel in t and PGMs in koz.
(3) SMC sales volumes exclude thermal coal sales of 1.5 Mt (2024: 2.0 Mt). Includes sales relating to third-party product purchased and processed by Anglo American. PGMs sales volumes exclude tolling and third-party trading activities.
(4) SMC realised price is the weighted average hard coking coal and PCI export sales price achieved at managed operations, measured in $/t. Nickel shows its realised price measured in $/lb. PGMs is shown as price for a basket of goods per PGM oz. The dollar basket price is the net sales revenue from all metals sold (PGMs, base metals and other metals) excluding trading and foreign exchange translation impacts, per PGM 5E + gold ounces sold (own-mined and purchase of concentrate) excluding trading, and measured in $/PGM oz.
(5) SMC FOB unit cost comprises managed operations and excludes royalties, measured in $/t. Nickel is C1 unit cost, measured in c/lb. PGMs unit cost is total cash operating costs (includes on-mine, smelting and refining costs only) per own-mined PGM ounce of production, measured in $/PGM oz.
(6) Anglo American's attributable share of Jellinbah was 23.3%. Anglo American agreed the sale of its 33.33% stake in Jellinbah in November 2024, and this transaction completed on 29 January 2025. The results from Jellinbah post 1 November 2024, after the sale was agreed, did not accrue to Anglo American and have been excluded. Jellinbah production at 2024 was 2.7 Mt.
Steelmaking Coal
Anglo American agreed the sale of its 33.33% stake in Jellinbah in November 2024, and this transaction completed on 29 January 2025, with net proceeds of $0.9 billion received. The results from Jellinbah post 1 November 2024, after the sale was agreed, did not accrue to Anglo American and have been excluded.
On 19 August 2025, Peabody Energy served notices purporting to terminate the November 2024 agreements to acquire our Steelmaking Coal business in Australia, on the basis that the ignition event at Moranbah North on 31 March 2025 constituted a Material Adverse Change (MAC). The Group does not consider the incident at Moranbah North to constitute a MAC and has initiated ICC arbitration proceedings against Peabody. Please refer to note 20 in the Condensed financial statements for further information.
The Moranbah-Grosvenor joint operations and Jellinbah associate were classified as held for sale as at 31 December 2024. The remainder of the Steelmaking Coal business was classified as held for sale on 15 March 2025. The Steelmaking Coal business remains held for sale as Anglo American is committed to divesting the assets and the formal sales process is under way with a high probability of completing a transaction or securing a purchase commitment in 2026.
Operational performance
Production decreased by 43% to 8.2 Mt (2024: 14.5 Mt), reflecting the sale of Jellinbah in November 2024 and the suspension of mining at the Grosvenor longwall operation, following the underground fire in June 2024. Production was also impacted by the underground incident at Moranbah North on 31 March 2025. These impacts were partially offset by increased production from the Aquila underground operation, driven by strong longwall performance.
At Moranbah North, following regulator approval for a remote restart in November, the final directives were lifted in February 2026, enabling us to continue our ramp up to a safe and structured return to normal longwall operations.
Grosvenor mine visual inspections during the later part of the year confirmed limited damage to critical life of mine infrastructure, following regulatory approval in August 2025 for the first stage of re-entry. This progress supports restart plans already under way, and subject to investment approval, longwall production is targeted to recommence by late 2027.
Financial performance
The underlying EBITDA loss of $156 million (2024: gain of $924 million) was primarily a result of the lower volumes, which includes the impact of the Jellinbah sale, as well as a 32% decrease in the weighted average realised price for steelmaking coal. The loss also includes $100 million non-operational costs associated with Grosvenor (2024: $145 million) largely offset by a benefit in relation to an arbitration award against MMTC Limited (refer to note 20 of the Condensed financial statements for further information), while the prior year also benefited from a $220 million insurance receipt for the finalisation of the Grosvenor underground fire claim from the Group's self-insurance entity. Unit costs increased by 14% to $141/tonne (2024: $124/tonne), primarily reflecting the impact of lower production from Moranbah North, which as an underground operation has a higher proportion of fixed costs.
Capital expenditure decreased to $339 million (2024: $468 million), primarily reflecting the reduced spend at Grosvenor following the underground fire in June 2024.
Within special items and remeasurements, impairment charges of $209 million and $255 million (before tax) were recognised at Moranbah-Grosvenor and Capcoal respectively. The charges principally relate to additional capital expenditure during the year that is no longer offset by depreciation charges since the assets are classified as held for sale.
Nickel
Anglo American has entered into a definitive agreement to sell the Nickel business to MMG Singapore Resources Pte. Ltd, and we continue to progress through the European Commission's merger control review approval process. The Nickel business was classified as held for sale on 18 February 2025 following the announcement of the signed sale and purchase agreement.
Operational performance
Nickel production increased by 1% to 39,700 tonnes (2024: 39,400 tonnes), supported by continuous operational stability and improved recoveries.
Financial performance
Underlying EBITDA decreased to $6 million (2024: $108 million), due to lower realised prices, higher unit costs and an increase in rehabilitation provisions, partially offset by higher sales volumes. Unit costs increased by 6% to 510 c/lb (2024: 481 c/lb), impacted by higher environmental expenses, partially offset by a weaker Brazilian real.
Capital expenditure decreased to $41 million (2024: $74 million), due to planned lower capex spend and lower capitalised stripping costs.
Within special items and remeasurements, net impairment charges of $104 million (before tax) were recognised at the Nickel business. The charge is a function of aligning to the terms specified within the SPA.
PGMs
The PGMs business was classified as 'held for distribution' from 30 April 2025 upon the approval of the demerger resolution at the Company's General Meeting. The demerger subsequently took effect on 31 May 2025, resulting in five months being consolidated in 2025 compared to the full year in 2024.
Operational performance
Total PGMs metal-in-concentrate production decreased by 67% to 1,188,400 ounces (2024: 3,553,100 ounces). Excluding June to December 2024 (on a like-for-like basis), production decreased by 18% primarily due to the Kroondal transition to a 4E toll arrangement which commenced in September 2024, and heavy flooding at the start of the year at Amandelbult, which then impacted operations for the remainder of the period.
PGMs sales volumes decreased by 72% to 1,134,000 ounces (2024: 4,077,800 ounces). On a like-for-like basis, sales were 31% lower due to the lower production, triennial stock take at the Base Metals Refinery, as well as the comparative period benefiting from a drawdown of finished goods.
Financial performance
Underlying EBITDA decreased to $217 million (2024: $1,106 million). On a like-for-like basis, EBITDA decreased by 55% driven by the lower sales volumes and the flooding at Amandelbult. The own-mined unit cost increased by 20% to $1,149/PGM ounce (2024: $957/PGM ounce). On a like-for-like basis, unit costs increased by 17%, predominantly driven by the lower own-mined production and flood recovery costs at Amandelbult.
Capital expenditure of $353 million was 65% lower (2024: $1,013 million). On a like-for-like basis, capex was 4% lower due to planned lower growth spend following a reprioritisation and rephasing of projects.
Guidance summary
Production and unit costs
Unit costs 2026F | Production volumes | ||||||
| Units | 2026F | 2027F | 2028F | |||
Simplified portfolio | |||||||
Copper(1) | c.172 c/lb | kt | 700-760 | 750-810 | 790-850 | ||
Premium Iron Ore(2) | c.$41/t | Mt | 55-59 | 59-63 | 58-62 | ||
Exiting businesses | |||||||
Diamonds(3) | c.$80/ct | Mct | 21-26 | n/a | n/a | ||
Further commentary on the operational outlook is included within the respective business reviews on pages 19-34.
Note: Unit costs exclude royalties, depreciation and include direct support costs only. 2026 unit cost guidance was set at: c.860 CLP:USD, c.3.2 PEN:USD, c.5.3 BRL:USD, c.16.00 ZAR:USD. Subject to macro-economic factors. Guidance is not provided for discontinued operations.
(1) On a contained metal basis. Total copper production is the sum of Chile and Peru. Unit cost total reflects a weighted average using the mid-point of production guidance. 2026 Chile: 390-420 kt; Peru 310-340 kt. 2027 Chile: 450-480 kt; Peru: 300-330 kt. 2028 Chile: 500-530 kt; Peru 290-320 kt. In 2026, Copper Chile production is impacted by the lower expected tonnes from Collahuasi, partially offset by the decision to restart the second plant at Los Bronces, which is expected to produce an additional c.25,000 tonnes in 2026. Production at Collahuasi is expected to benefit from progressively increased access to fresh, higher grade ore during 2026 and therefore Chile production is expected to be weighted to the second half of 2026. Copper Peru production in 2026 reflects improved recoveries and higher throughput compared to 2025, partly offset by modestly lower grades. Production is expected to be weighted to the second half of 2026, owing to the expected grade profile. In 2027, Copper Chile production benefits as Collahuasi is expected to improve with access to fresh ore and, at Los Bronces, full access to Donoso 2 improves grades and volumes despite the expected return to utilising only the larger, more modern plant at the mine; while production at Copper Peru is impacted by planned plant maintenance at Quellaveco, including mills and conveyors. In 2028, Copper Chile production benefits from an additional higher grade phase at Los Bronces as well as higher throughput at Collahuasi following the completion of the 210ktpd plant debottlenecking at the end of 2027 and Copper Peru reflects stable production. Copper production guidance is subject to water availability. 2026 unit cost guidance for Chile is c.230 c/lb, higher than the 2025 unit cost of 199 c/lb, reflecting the impact of a stronger Chilean peso and the production mix between Los Bronces and Collahuasi. 2026 unit cost guidance for Peru is c.100 c/lb, higher than the 2025 unit cost of 89 c/lb, reflecting the impact of higher labour and maintenance costs, coupled with a stronger Peruvian sol. The copper unit costs are impacted by FX rates and pricing of by-products, such as molybdenum.
(2) Wet basis. Total premium iron ore is the sum of Kumba and Minas-Rio. Unit cost total reflects a weighted average using the mid-point of production guidance. 2026 Kumba: 31-33 Mt; Minas-Rio: 24-26 Mt. 2027 Kumba: 35-37 Mt; Minas-Rio: 24-26 Mt. 2028 Kumba: 35-37 Mt; Minas-Rio: 23-25 Mt. In 2026, Kumba production is temporarily lower, reflecting the tie-in of the Ultra-High-Dense-Media-Separation (UHDMS) project which is planned in the second half of 2026, with sales not expected to be impacted owing to the planned drawdown of finished stock. In 2028, Minas-Rio's production is slightly lower as the mine moves into areas with more ore feed variability, offsetting the throughput benefit from the recleaner flotation columns implementation. Kumba production is subject to third-party rail and port availability and performance. 2026 unit cost guidance for Kumba is c.$45/tonne, higher than the 2025 unit cost of $40/tonne, primarily reflecting the impact of the stronger South African rand. 2026 unit cost guidance for Minas-Rio is c.$36/tonne, higher than 2025 of $32/tonne, reflecting the increased processing cost associated with the tailings filtration plant as well as the stronger Brazilian real and inflation.
(3) Production is on a 100% basis except for the Gahcho Kué joint operation, which is on an attributable 51% basis. De Beers continues to monitor rough diamond trading conditions in order to align output with prevailing demand. Unit cost guidance for 2026 is c.$80 per carat, lower than the 2025 unit cost of $86/ct, reflecting the benefit of slightly higher production volumes and ongoing cost-control measures. Unit cost is based on De Beers' proportionate consolidated share of costs and associated production. As previously announced, Anglo American continues to pursue a dual track separation for De Beers and a structured sale process is currently under way.
Capital expenditure ($bn)(1)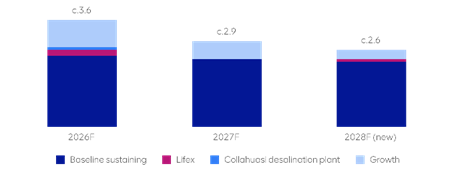
Capital expenditure | 2026F | 2027F | 2028F (new) |
Growth | c.$0.9bn (previously c.$0.7bn) Includes c.$0.25bn Woodsmith capex(2) (previously nil) | c.$0.6bn (previously c.$0.9bn) Includes c.$0.25bn Woodsmith capex(2) (previously nil) | c.$0.3bn |
Sustaining | c.$2.2bn (previously c.$2.3bn) Reflects c.$2.1bn baseline (previously c.$2.2bn), c.$0.1bn Collahuasi desalination plant(3) | c.$2.3bn (previously c.$2.1bn) Reflects c.$2.3bn baseline (previously c.$2.1bn) | c.$2.3bn Reflects c.$2.2bn baseline, c.$0.1bn lifex projects |
Capex for simplified portfolio | c.$3.1bn (previously c.$3.0bn) | c.$2.9bn (previously c.$3.0bn) | c.$2.6bn |
Sustaining (De Beers) | c.$0.5bn (previously c.$0.6bn) Reflects c.$0.3bn baseline, c.$0.2bn lifex projects (previously c.$0.3bn) | ||
Capex for continuing operations | c.$3.6bn |
|
Further details on Anglo American's high quality growth and life-extension projects, including details of the associated volumes benefit, are disclosed on pages 10-12.
Long-term sustaining capital expenditure for the simplified portfolio is expected to be c.$2.0 billion per annum(4), excluding life-extension projects.
Other guidance
- 2026 depreciation for continuing operations: $2.4-2.6 billion
- 2026 underlying effective tax rate for continuing operations: 44-48%(5)
- Long-term underlying effective tax rate (simplified portfolio): 38-42%(5)
- Dividend payout ratio: 40% of underlying earnings
- Net debt:EBITDA: <1.5x at the bottom of the cycle
(1) Cash expenditure on property, plant and equipment including related derivatives, net of proceeds from disposal of property, plant and equipment, and includes direct funding for capital expenditure from non-controlling interests. Guidance includes unapproved projects and is, therefore, subject to the progress of project studies, permitting and approval. Refer to the 2025 results presentation for further detail on the breakdown of the capex guidance at project level.
(2) Woodsmith operating costs for 2026 and 2027 are expected to be c.$0.05 billion (previously c.$0.1 billion in 2026 and nil in 2027).
(3) Collahuasi desalination capex shown includes related infrastructure, with other water management projects included in baseline sustaining. Attributable share of capex at 44%.
(4) Long-term sustaining capex guidance is shown on a 2026 real basis and is for the simplified portfolio.
(5) Underlying effective tax rate guidance is highly dependent on a number of factors, including the mix of profits and any relevant tax reforms impacting the countries where we operate, and may vary from guidance. In addition, the continuing operations guidance will be impacted by the timing of the exit of De Beers from the portfolio.
For further information, please contact:
Media | Investors |
UK James Wyatt-Tilby Tel: +44 (0)20 7968 8759
| UK Tyler Broda Tel: +44 (0)20 7968 1470
|
Marcelo Esquivel Tel: +44 (0)20 7968 8891
| Emma Waterworth Tel: +44 (0)20 7968 8574 |
Rebecca Meeson-Frizelle Tel: +44 (0)20 7968 1374
| Asanda Malimba Tel: +44 (0)20 7968 8480 |
South Africa Nevashnee Naicker Tel: +27 (0)11 638 3189 | |
Ernest Mulibana Tel: +27 82 263 7372
| |
Notes to editors:
Anglo American is a leading global mining company focused on the responsible production of copper, premium iron ore and crop nutrients - future-enabling products that are essential for decarbonising the global economy, improving living standards, and food security. Our portfolio of world-class operations and outstanding mineral endowments offers value-accretive growth potential across all three businesses, positioning us to deliver into structurally attractive major demand growth trends.
Our integrated approach to sustainability and innovation drives our decision-making across the value chain, from how we discover new resources to how we mine, process, move and market our products to our customers - safely, efficiently and responsibly. Our Sustainability Strategy commits us to a series of stretching goals over different time horizons to ensure we build trust as a corporate leader, contribute to a healthy environment and help create thriving communities. We work together with our business partners and diverse stakeholders to unlock enduring value from precious natural resources for our shareholders, for the benefit of the communities and countries in which we operate, and for society as a whole. Anglo American is re-imagining mining to improve people's lives.
Anglo American is currently implementing a number of major structural changes to unlock the inherent value in its portfolio and thereby accelerate delivery of its strategic priorities of Operational excellence, Portfolio optimisation, and Growth. The sale of our steelmaking coal and nickel businesses and the separation of our iconic diamond business (De Beers) continue to progress and once completed, will focus Anglo American on its world-class resource asset base in copper, premium iron ore and crop nutrients.
www.angloamerican.com

Webcast of presentation:
A live webcast of the results presentation, starting at 9.00am UK time on 20 February 2026, can be accessed through the Anglo American website at www.angloamerican.com
Note: Throughout this results announcement, '$' denotes United States dollars and 'cents' refers to United States cents. Tonnes are metric tons, 'Mt' denotes million tonnes and 'kt' denotes thousand tonnes, unless otherwise stated.
Group terminology
In this document, references to "Anglo American", the "Anglo American Group", the "Group", "we", "us", and "our" are to refer to either Anglo American plc and its subsidiaries and/or those who work for them generally, or where it is not necessary to refer to a particular entity, entities or persons. The use of those generic terms herein is for convenience only, and is in no way indicative of how the Anglo American Group or any entity within it is structured, managed or controlled. Anglo American subsidiaries, and their management, are responsible for their own day-to-day operations, including but not limited to securing and maintaining all relevant licences and permits, operational adaptation and implementation of Group policies, management, training and any applicable local grievance mechanisms. Anglo American produces group-wide policies and procedures to ensure best uniform practices and standardisation across the Anglo American Group but is not responsible for the day to day implementation of such policies. Such policies and procedures constitute prescribed minimum standards only. Group operating subsidiaries are responsible for adapting those policies and procedures to reflect local conditions where appropriate, and for implementation, oversight and monitoring within their specific businesses.
Disclaimer
This document has been prepared by Anglo American plc ("Anglo American"). By reviewing this document you agree to be bound by the following conditions. The release, presentation, publication or distribution of this document, in whole or in part, in certain jurisdictions may be restricted by law or regulation and persons into whose possession this document comes should inform themselves about, and observe, any such restrictions.
This document is for information purposes only and does not constitute, nor is to be construed as, an offer to sell or the recommendation, solicitation, inducement or offer to buy, subscribe for or sell shares in Anglo American or any other securities by Anglo American or any other party. Further, it should not be treated as giving investment, legal, accounting, regulatory, taxation or other advice and has no regard to the specific investment or other objectives, financial situation or particular needs of any recipient.
No representation or warranty, either express or implied, is provided, nor is any duty of care, responsibility or liability assumed, in each case in relation to the accuracy, completeness or reliability of the information contained herein. None of Anglo American or each of its affiliates, advisors or representatives shall have any liability whatsoever (in negligence or otherwise) for any loss or damage of whatever nature, howsoever arising, from any use of, or reliance on, this material or otherwise arising in connection with this material.
Forward-looking statements and third-party information:
This document includes forward-looking statements. All statements other than statements of historical fact included in this document may be forward-looking statements, including, without limitation, those regarding Anglo American's financial position, business, acquisition and divestment strategy, dividend policy, plans and objectives of management for future operations, prospects and projects (including development plans and objectives relating to Anglo American's products, production forecasts and Ore Reserve and Mineral Resource positions), the anticipated benefits of mergers and acquisitions (including any assessment or quantification of potential synergies) and sustainability performance related (including environmental, social and governance) goals, ambitions, targets, visions, milestones and aspirations. Forward-looking statements may be identified by the use of words such as "believe", "expect", "intend", "aim", "project", "anticipate", "estimate", "plan", "may", "should", "will", "target" and words of similar meaning. By their nature, such forward-looking statements involve known and unknown risks, uncertainties and other factors which may cause the actual results, performance or achievements of Anglo American or industry results to be materially different from any future results, performance or achievements expressed or implied by such forward-looking statements.
Such forward-looking statements are based on numerous assumptions regarding Anglo American's present and future business strategies and the environment in which Anglo American will operate in the future. Important factors that could cause Anglo American's actual results, performance or achievements to differ materially from those in the forward-looking statements include, among others, levels of actual production during any period, levels of global demand and product prices, unanticipated downturns in business relationships with customers or their purchases from Anglo American, mineral resource exploration and project development capabilities and delivery, recovery rates and other operational capabilities, safety, health or environmental incidents, the ability to identify, consummate and integrate pending or potential acquisitions, disposals, investments, mergers, demergers, syndications, joint ventures or other transactions, the effects of global pandemics and outbreaks of infectious diseases, the impact of attacks from third parties on our information systems, natural catastrophes or adverse geological conditions, climate change and extreme weather events, the outcome of litigation or regulatory proceedings, the availability of mining and processing equipment, the ability to obtain key inputs in a timely manner, the ability to produce and transport products profitably, the availability of necessary infrastructure (including transportation) services, the development, efficacy and adoption of new or competing technology, challenges in realising resource estimates or discovering new economic mineralisation, the impact of foreign currency exchange rates on market prices and operating costs, the availability of sufficient credit, liquidity and counterparty risks, the effects of inflation, terrorism, war, conflict, political or civil unrest, uncertainty, tensions and disputes and economic and financial conditions around the world, evolving societal and stakeholder requirements and expectations, shortages of skilled employees, unexpected difficulties relating to acquisitions or divestitures, competitive pressures and the actions of competitors, activities by courts, regulators and governmental authorities such as in relation to permitting or forcing closure of mines and ceasing of operations or maintenance of Anglo American's assets and changes in taxation or safety, health, environmental or other types of regulation in the countries where Anglo American operates, conflicts over land and resource ownership rights and such other risk factors identified in Anglo American's most recent Annual Report. Forward-looking statements should therefore be construed in light of such risk factors, and undue reliance should not be placed on forward-looking statements. These forward-looking statements speak only as of the date of this document. Anglo American expressly disclaims any obligation or undertaking (except as required by applicable law, rules or regulations) to release publicly any updates or revisions to any forward-looking statement contained herein to reflect any change in Anglo American's expectations with regard thereto or any change in events, conditions or circumstances on which any such statement is based.
Nothing in this document should be interpreted to mean that future earnings per share of Anglo American will necessarily match or exceed its historical published earnings per share. Certain statistical and other information included in this document is sourced from third party sources (including, but not limited to, externally conducted studies and trials). As such it has not been independently verified and presents the views of those third parties, but may not necessarily correspond to the views held by Anglo American and Anglo American expressly disclaims any responsibility for, or liability in respect of, such information.
No Investment Advice
This document has been prepared without reference to your particular investment objectives, financial situation, taxation position and particular needs. It is important that you view this document in its entirety. If you are in any doubt in relation to these matters, you should consult your stockbroker, bank manager, solicitor, accountant, taxation adviser or other independent financial adviser (where applicable, as authorised under the Financial Services and Markets Act 2000 in the UK, or in South Africa, under the Financial Advisory and Intermediary Services Act 37 of 2002 or under any other applicable legislation).
Alternative Performance Measures
Throughout this document a range of financial and non-financial measures are used to assess our performance, including a number of financial measures that are not defined or specified under IFRS (International Financial Reporting Standards), which are termed 'Alternative Performance Measures' (APMs). Management uses these measures to monitor the Group's financial performance alongside IFRS measures to improve the comparability of information between reporting periods and businesses. These APMs should be considered in addition to, and not as a substitute for, or as superior to, measures of financial performance, financial position or cash flows reported in accordance with IFRS. APMs are not uniformly defined by all companies, including those in the Group's industry. Accordingly, it may not be comparable with similarly titled measures and disclosures by other companies.
©Anglo American Services (UK) Ltd 2026.  TM and
  TM are trade marks of Anglo American Services (UK) Ltd.
Anglo American plc
17 Charterhouse Street London EC1N 6RA United Kingdom
Registered office as above. Incorporated in England and Wales under the Companies Act 1985.
Registered Number: 3564138 Legal Entity Identifier: 549300S9XF92D1X8ME43
Related Shares:
Anglo American