30th Jun 2025 07:00
30th June 2025
LEI: 213800LFMHKVNTZ7GV45
River Global PLC
("River Global" or the "Company")
Formerly AssetCo plc
2025 Half-year Report
for the six months ended 31 March 2025
Change of Nominated Adviser
River Global is pleased to announce the appointment of Panmure Liberum Limited as the Company's Nominated Adviser and Sole Broker with immediate effect following publication of this announcement.
Registered number: 04966347
Highlights
· Loss on earnings before interest, tax, depreciation (other than premises leasing) and amortisation ("EBITDA") reduced to £0.2m on a consolidated basis after adjusting for exceptional items. No operations were discontinued during the period.
· The total loss for the period was £1.6m.
· Breaking this out by share class:
A Ordinary Shares | B Shares | |
EBITDA excluding exceptionals | -£1.5m | £1.3m |
Profit/loss overall | -£2.8m | £1.2m |
· For A Ordinary Shares:
o Further progress in consolidation of the asset management business; end goal in sight.
o Existing joint venture with Jonathan Knowles making progress; further joint venture with overseas wealth manager at an advanced stage of development
o Robust investment performance over three and five year periods
o Outflows of £377m for financial year to end May 2025 (excluding previously advised institutional outflow) reflect continuing challenges in the active asset management industry
· For B Shares:
o Strong progress at Parmenion with assets under management or administration rising to £13.1bn and revenues to £50.2m in financial year ending December 2024
o Unchanged assessment of value at £75 - 90m.
Martin Gilbert, Executive Chairman of River Global PLC, commented:"Another period of on-going geo-political turmoil has done nothing to calm investor nerves and continues to create extremely challenging conditions for the active asset management industry. Some of the fallout of this unsettled the seemingly unstoppable rise of the huge US growth stocks and may yet shine a light on the benefits of selective active stock-picking but, in the meantime, our focus remains on holding our nerve for the longer term and driving ever greater efficiencies for our business.
With the loss on earnings before interest, tax, depreciation and amortisation reduced to £0.2m on a consolidated basis for this half year period, profitability for the consolidated group is tantalisingly close but frustratingly still just out of our grasp in the period.
We were pleased to see our share split deliver an appreciable uplift in aggregate value and subsequent trading has begun to diversify the two shareholder bases. We have broken our results out separately for A and B shareholders accordingly and hope that shareholders find this helpful.
The remainder of this financial year remains about completing the consolidation journey for our asset management business and getting ourselves in the best shape we can be for these difficult market conditions. We look forward to the launch of our joint venture with an overseas wealth manager in the early part of our next financial year and to building momentum for our nascent venture with Jonathan Knowles and his Compound Equity Group."
For further information, please contact:
River Global PLC | Deutsche Numis |
Gary Marshall, CFOO Martin Gilbert, Chairman | Nominated adviser and joint broker Giles Rolls / Charles Farquhar |
Tel: +44 (0) 7788 338157 | Tel: +44 (0) 20 7260 1000 |
Panmure Liberum Limited | H/Advisors |
Joint broker | Neil Bennett / Rachel Cohen |
Stephen Jones / Atholl Tweedie | Tel: +44 (0) 20 7379 5151 |
Tel: +44 (0) 20 7886 2500 | |
For further details, visit the website, https://www.riverglobalplc.com/
Tickers: AIM: RVRB.L and RVRG.L
Chairman's Statement
Share re-organisation
Our proposals to re-organise the share structure for the Group were overwhelmingly supported with some 99% of voting shareholders being in favour. The issuance of new A ordinary and new B shares took effect on 6 March and delivered an appreciable uplift in aggregate value when compared with the pre-organisation share price. Trading activity in the two share classes has progressed independently with greater distinction in holdings amongst shareholders emerging over time. We have introduced a breakdown of results attributable to the A and B shares separately in these accounts and hope this proves useful to shareholders.
Section A: Commentary in relation to A Ordinary Shares having rights which exclude the Company's structured equity interest in Parmenion
The six months ended 31 March 2025 saw no break in the on-going contraction afflicting the active asset management industry. Geopolitical developments hardly helped with devastating wars continuing to rage in Ukraine and the Middle East, and the election of Donald Trump ushering in a period of unpredictable global disruption. Closer to home, a shaky start to Labour's elevation to government with the first Labour budget for a decade and a half characterised by record tax rises and increased borrowings, impacting both consumer and corporate confidence. These and other challenges meant that the net effect for the UK funds industry was a further £7.4bn of outflows during the period (source: Investment Management Association). Against this challenging background, our business continues to play to its strengths and adapt.
River Global took its share of the resultant pain and (excepting a large institutional outflow) the Group saw general outflows of some £322m in assets under management over the period. I had already commented, in announcing our annual results, on the outflow from the loss of a US institutional client just mentioned which is expected to be largely offset by a pipeline win effectively cancelling the loss out. Funding of that pipeline win has been delayed from April to September this year but is otherwise well progressed. While market conditions for our asset management business remain far from ideal, River Global has maintained a team of talented and experienced investment professionals that can help our clients achieve their investment outcomes from our range of UK and Global strategies even in these challenging times, while providing material upside for the business, as and when market conditions improve. In this context, we remain supportive of the Government's vision to grow and enhance the competitiveness of the UK world-leading financial services sector and are now starting to see tangible evidence of these reforms taking effect. Recent market rotation has reminded investors, especially those in global strategies, of the need to have diversified investment exposure and River Global having four differentiated and distinct offerings, as well as an established expertise in smaller and mid-sized companies, is well placed to deliver just that.
Progress in consolidationOne of our major milestones in operational consolidation was achieved at the end of February 2025 - as reported with our annual results in March - and we have continued to build on that by integrating a further fund into the River Global funds umbrella. This has the result that SVM Asset Management, the Group's Authorised Corporate Director, is now overseeing all UK-domiciled open-end funds for the Group and contributing revenues for doing so. We are within sight of our final goal of consolidating all UK fund services with a single provider, delivering a much simplified and more efficient operating model, and expect to achieve that during this financial year.
Joint venture progressWe have worked closely in partnership with our prospective joint venture partner - an offshore wealth manager - to develop their new range of funds for which we will be appointed as Investment Manager, overseeing discretionary sub-investment managers. These are now at an advanced stage of development and regulatory approval and the current expectation is that they will be launched around the beginning of our new financial year. The project envisages the transfer of existing business into these funds so that quantum can be predicted with some degree of confidence and the expectation is of assets under management rising to over €1bn in the first 6-12 months after launch - and continuing apace for some time after that. Our limited oversight role yields a relatively small percentage fee but on a substantial book of assets and at minimal additional cost to us, leveraging existing infrastructure.
Funds managed by Jonathan Knowles, of Compound Equity Group, with whom we commenced a joint venture in August 2024, have seen on-going net inflows during the period, raising just under £20m year to date which is a creditable performance for this new venture as it seeks to build a track record and gain momentum.
FinancialsThe analysis of revenue and results by commercial activity for the six months ended 31 March 2025 shows revenues of £6.1m (31 March 2024: £6.9m) and an overall loss before taxation for the A share business interest of £2.8m (31 March 2024: -£4.2m) which evidences further progress in cost cutting and towards our goal of profitability. Excluding discontinued operations (which were included in the previous six month period) and adjusting for exceptional items, earnings before interest, tax, depreciation (other than premises leasing) and amortisation ("EBITDA") for the six months to end March 2025 for the A share business interest was a loss of £1.5m compared with £2.9m as at 31 March 2024.
OutlookWe are under little illusion that market conditions will become less challenging near term. Interestingly, however, the effect of some of the global disruption we have been seeing is to shine a light on the benefits of active asset management and demonstrate that the "magnificent seven" are not invulnerable. We have seen an uptick in both performance and interest in some of our funds as a result.
Profitability is tantalisingly close and we had hoped to get closer to run rate profitability during this reporting period. Sadly, the downturn in investor confidence, and the redemptions which followed, in the first quarter of this financial year set us back in that context and, taken together with the earlier referenced loss of a US client, represented too much lost ground for us to make up. However, the on-boarding of a new UK institutional client expected around the end of this financial year should give us a helpful boost going into the new financial year in October. We are also making good headway in our most recent plans to cut costs by a further £2.5m per annum, the majority of which we hope to be effective before year end.
Management EvolutionPart of those cost savings plans involve some re-structuring of our management team and your Board recently agreed with Alex Hoctor-Duncan, CEO of River Global's asset management business, that it is the right time for him to step down and leave the business in the coming months. Alex has led the asset management business through the transformation and significant re-design we have been engaged on to deliver a simplified and stable platform that is well positioned for growth. Having achieved these goals, the Board wishes to thank Alex for his contribution and wishes him well for the future.
Alex's responsibilities within the streamlined River Global asset management business have been allocated between Gary Marshall, Chief Finance and Operations Officer for River Global PLC, and Matt Hudson, Chief Investment Officer for River Global.
Section B: Commentary in relation to B Shares having rights to the Company's structured equity interest in Parmenion
Parmenion recently announced its full-year results for the year ending December 2024 reporting robust financial and operational performance. The annual report and financial statements from the group show strong growth and net flow performance. Assets increased by £2bn to £13.1bn by 31 December 2024 and revenue was up from £48.7m in 2023 to £50.2m in 2024. Operating profit also increased to £17.5m up from £15.5m in 2023, with the group's EBITDA rising from £17.9m to £20.1m in 2024.
The analysis of revenue and results by commercial activity for the six months ended 31 March 2025 shows revenues for the River Global B shares (being interest on the Parmenion loan, received by way of additional loan notes) of £1.3m (31 March 2024: £1.2m) and an overall profit for the B share business interest of £1.2m (31 March 2024: £1.2m). These are to be distinguished from revenues for the underlying Parmenion business operations and reflect the allocation of central overheads for the first time, as outlined in our shareholder circular. There are no discontinued operations and adjusting for exceptional items, earnings before interest, tax, depreciation (other than premises leasing) and amortisation ("EBITDA") for the six months to end March 2025 for the B share business interest was £1.3m compared with £1.2m as at 31 March 2024.
Valuation UpdateIn January 2025, in the circular sent to shareholders at that time, we reviewed the value of our structured 30% equity interest (before dilution for management interests) in Parmenion. Based on recent discussions with the Company's advisers, the Board believes that a value of between £75-90m continues to represent a fair assessment of the value of the Company's interest assuming an arm's length sale of Parmenion as a whole. The Company expects to consult with advisers to undertake a valuation of the Parmenion interest again next year and to publish the outcome of that consultation with its full year results for the financial year ending September 2025.
Section C: Commentary in relation to the consolidated business of the Group
The income statement for the six months ended 31 March 2025 shows revenues of £6.1m (31 March 2024: £6.9m) and a loss of £1.6m in total (31 March 2024: £3.0m) which, as indicated above, evidences further progress in cost cutting and towards our goal of profitability for our equities asset management business. Excluding discontinued operations (which were included in the previous six month period) and adjusting for exceptional items earnings before interest, tax, depreciation (ex premises leasing) and amortisation ("EBITDA") for the six months to end March 2025 was -£0.2m compared with -£1.3m as at 31 March 2024.
Martin Gilbert
Chairman
30th June 2025
BUSINESS REVIEW
Section A: Commentary in relation to A Ordinary Shares having rights which exclude the Company's structured equity interest in Parmenion
The chart below shows the movement in active equities assets over the period. It includes a c.£200m outflow relating to the loss of a US institutional client in December which was referenced in our report for the previous financial year. At that time we also reported that we had been selected to manage a mandate delivering similar fees and of comparable size in terms of assets under management for a UK institution. That remains the case and the chart therefore includes the former and excludes the latter. Funding for the latter is now expected in September rather than April as previously anticipated but otherwise remains on track.
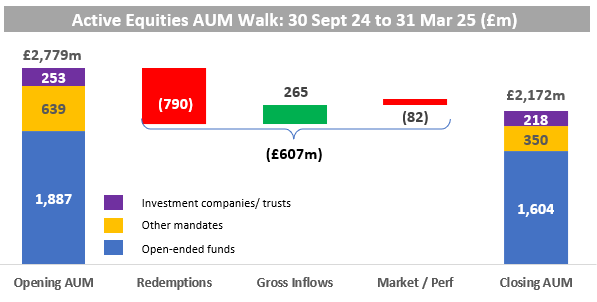
Outflows were unusually heavy in the first quarter of the financial year commencing 1 October 2024, driven largely by investor concerns running into the new government's first budget and the economic outlook for the UK generally. The month of October 2024 alone saw outflows from funds across the UK industry of over £4.5bn which, when considered in the context of total outflows for the six months from 1 October 2024 to 31 March 2025 of £7.4bn, underlines the degree of industry contraction at that time. Generally, the industry numbers demonstrate just how difficult the current market continues to be with only intermittent and modest periods of inflow offset by larger irregular but recurring waves of outflows.
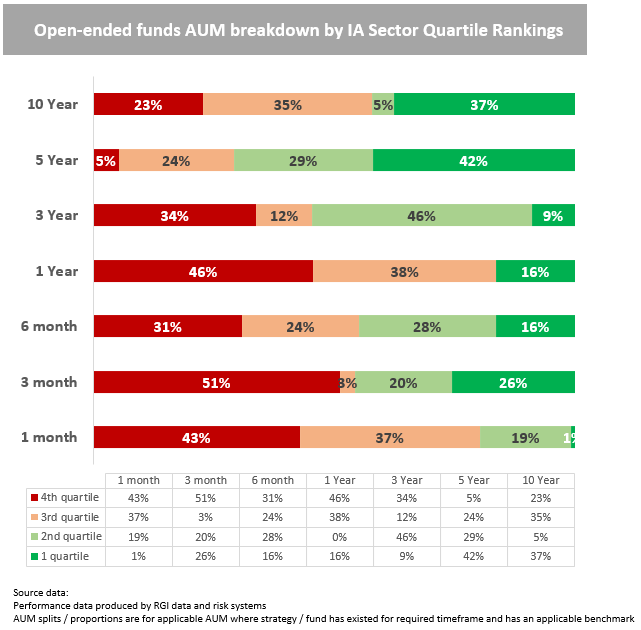
PerformanceInvestment performance for the Group's equities open-end funds measured at the end of March 2025 is shown in the table below. Performance remains robust over the three and five year periods with over 50% of funds (by assets under management) outperforming peers in both time periods and a particular improvement in the five-year performance result where over 60% of AUM are in the first or second quartiles of their relevant competitor universes.
The three-year AUM performance continues to improve compared with our last report with 9% of our AUM now in the first quartile and 46% in the second quartile helped by improving returns over the last six months. For example, our Global Recovery strategies were both in the first quartile over the reporting period while the RGI Global Income & Growth Fund (formerly Saracen Global Growth and Income), delivered another robust performance (second quartile) over the period to consolidate its position in the top quartile of the relevant universe over three and five years. The performance of these strategies in the period is a good example of why our differentiated approach to managing client assets, in particular within global equities, is both highly relevant and can provide clients with diversification against other global strategies that are either index constrained or index tracking. Within our UK fund strategies, the RGI UK Smaller Listed Companies Fund was a solid performer in the period building on its long-term track record of strong risk adjusted returns within its sector. While some of our more cyclically exposed UK strategies have struggled more recently, we were pleased that the RGI UK Recovery Fund, managed by industry veteran and advocate for UK equities, Hugh Sergeant, was awarded the 2025 Lipper Award for best fund over 10 years in the UK Equity category.
All of our investment strategies have capability and expertise in identifying stock opportunities outside of the largest "mega-cap" areas of their respective equity markets. Investing outside "mega caps" generally and particularly in global strategies investing outside the dominant US growth stocks has been a headwind for competitive returns at times. For example, in the UK, the performance of smaller companies has lagged the performance of the wider market to a greater extent and duration than in any previous market cycle. However, we believe that the capability to exploit the opportunities outside the "mega-caps" that dominate many equities indices, will be critical to delivering investment performance in the coming cycle and will add value to our client portfolios. We are well paced in this regard.
Our investment capabilities are built on a combination of our talented and experienced investment teams and our robust investment platform. Matt Hudson has recently been appointed as Chief Investment Officer for our asset management business and will lead the development of our investment capabilities. The investment teams that manage our clients assets share a common belief in the value of active management and the importance of differentiated and distinct fund strategies and our portfolio managers and analysts have a demonstrable record of stock picking generally as well as particular expertise in smaller and mid-sized companies across UK and global equity markets.
Over the last three years, we have been investing to strengthen and expand the capabilities of our investment platform, including the quantitative analysis that underpins and supports the majority of our investment strategies. We are currently exploring the potential for a number of new strategies, based on our existing investment management capabilities, that are both synergistic with our current Fund range and will allow us to leverage our investment platform to the benefit of both investors and shareholders.
Annualised Revenue Breakdown by Business Type (as at 31 March 2025)
| AuM (£m) | Weighted average fee rate, net of rebates (bp) | Gross annualised revenue net of rebates (£000s) |
Wholesale (excluding joint ventures) | 1,135 | 63 | 7,117 |
Wholesale (joint ventures) | 469 | 12 | 566 |
Institutional (excluding joint ventures) | 327 | 27 | 870 |
Institutional (joint ventures) | 23 | 25 | 58 |
Investment Companies | 218 | 103 | 2,250 |
Total | 2,172 | 50 | 10,861 |
Notes:
- Wholesale refers to the assets which are held and managed in mutual funds distributed by the Group.
- Institutional refers to the assets which are held and managed in separate accounts on behalf of institutional clients of the Group.
- Investment Companies refers to the assets which are held and managed in investment companies which are clients of the Group.
Section B: Commentary in relation to B Shares having rights to the Company's structured equity interest in Parmenion
The December 2024 annual report and financial statements from the Parmenion group show strong growth and net flow performance. As noted in the Chairman's Statement, assets increased by £2bn to £13.1bn by 31 December 2024 and revenue was up from £48.7m in 2023 to £50.2m in 2024.
Against a backdrop of increased outflows across the UK platform market and cost of living pressures, Parmenion attributes this stellar growth to its ongoing strategy of service excellence and programme of proposition enhancements to support advisers and their clients. The group continues to invest in technology and service, releasing over 400 new features and enhancements throughout the year.
In addition, 2024 also saw Parmenion support 14 advice firms in bulk transferring £300m on behalf of their clients and build up a pipeline of £1.5bn of assets to be consolidated in 2025. This new, highly regarded Platform Switch Service, rolled out in 2024 was set up in response to adviser demand to enhance and streamline the switching process.
Section C: Key Performance Indicators in relation to A and B shares, and to the Group
The following table summarises key performance indicators for the business, providing a comparison with the position at the same time last year.
| End March* 2025 | End March* 2024 | Movement |
A Ordinary Shares (excludes interest in Parmenion) |
|
|
|
Assets under Management ("AuM") | £2,172m | £2,371m | -£199m |
Total net assets | £23.3m | £26.5m | -£3.2m |
Annualised revenue1 | £10.9m | £15.0m | -£4.1m |
Profit/loss for the period (including exceptionals and discontinued business) | -£2.8m | -£4.2m | +£1.4m |
EBITDA for continuing business excluding exceptionals | -£1.5m | -£2.5m | +£1.0m |
Investment performance2 (1 year) | 16% | 58% | -42% points |
Investment performance2 (3 year) | 55% | 36% | +19% points |
Investment performance2 (5 year) | 71% | 61% | +10% points |
B Shares (interest in Parmenion) |
|
|
|
Assets under Management or Administration (as at previous 31 December*) | £13.1bn | £11.1bn | +£2bn |
Total net assets | £28.4m | £25.8m | +£2.6m |
Profit/loss for the period (including exceptionals and discontinued business) | £1.2m | £1.2m | £0m |
EBITDA for continuing business excluding exceptionals | £1.3m | £1.2m | £0.1m |
Consolidated |
|
|
|
Total net assets | £51.7m | £52.3m | -£0.6m |
Profit/loss for the period (including exceptionals and discontinued business) | -£1.6m | -£3.0m | +£1.4m |
EBITDA for continuing business excluding exceptionals | -£0.2m | -£1.8m | +£1.6m |
1 Monthly recurring revenue (net of rebates) at date shown using annualised closing AuM.
2 % active equity mutual fund AuM in 1st or 2nd quartile when compared with competitor funds in relevant Investment Association sectors.
Gary Marshall
Chief Financial and Operating Officer
30th June 2025
Principal risks and uncertainties
The Directors continuously monitor the business and markets to identify and deal with risks and uncertainties as they arise. Set out below are the principal risks which we believe could materially affect the Group's ability to achieve its strategy. The risks are not listed in order of significance.
Risk
| Responsibility and Principal Control |
Profitability and Dividends: Profitability remains a key focus for the Group. Delays in profitability in the longer term could threaten the Group's ability to trade on a going concern basis, impact the Board's ability to fund growth and acquisitions as well as the ability to pay dividends. | Board/Executive Team: The exit from former loss making businesses, has helped the Group to focus its resources on its active equities business. The Group continues to cut costs. The Group is focused on achieving run-rate profitability and the Board monitors costs and cash management carefully to this end. In particular, cash forecasts are regularly provided to the Board for the purposes of monitoring the position against regulatory capital requirements. |
Distribution: Corporate actions such as acquisitions and business re-structuring can disturb existing clients while discouraging new ones. The reduction in the overall size of the market for active equity asset management has also made increasing assets under management more difficult. | Board/Distribution: Distributors and markets are carefully targeted and client relationships monitored to identify and mitigate the risk of loss. |
Performance and Product: Sustained under-performance or investment style drift could lead to client redemptions as could situations where a fund is considered out-of-date in its positioning or no longer fit for purpose. | Board/Product/Investment Team: The Group continually monitors and develops its product suite to ensure that it remains competitive and attractive. The Investment Team, in conjunction with Investment Risk, continually monitor fund performance against targets, including style, taking corrective action where necessary.
|
Loss of Key People: The Group has managed most departures on a planned basis but going forwards will need to ensure continued retention of key staff if it is to manage client, consultant and regulatory expectations. | Board/Remuneration Committee: The Board reviews succession planning for all senior executives. Senior executives are subject to extended notice periods (between six and twelve months). The Group seeks to offer attractive terms as well as a flexible working environment. The Group operates a Restricted Share Plan and continues to examine ways to incentivise and retain senior partners and key staff. |
Economic Conditions: As an equity specialist the business remains vulnerable to any material fall in equity markets. | Board/Executive Team: The Group seeks to manage an appropriate balance of fixed and variable costs. In the event of a sustained economic downturn, the Group would seek to take early action to cut fixed costs. |
Systems and Controls: Operating multiple systems across multiple subsidiary and associate companies increases the risk of control failure. Managing multiple service providers also generates challenges. | Board/Operations: The Group has developed a detailed controls framework to create a consistent, harmonised approach. The Group has consolidated to a single operating model as well as seeking to rationalise service providers. |
CONSOLIDATED INCOME STATEMENT
|
| Six months ended | Year ended | ||
| Note | Unaudited 31 March 2025 £'000 | Unaudited 31 March 2024 £'000 | Audited 30 September 2024 £'000 | |
CONTINUING OPERATIONS | |||||
Revenue | 4 | 6,431 | 6,926 | 13,845 | |
Cost of sales | (330) | - | (491) | ||
Gross profit |
| 6,101 | 6,926 | 13,354 | |
Other income | 6 | 1,312 | 1,193 | 2,648 | |
Other administrative expenses | 7 | (9,170) | (10,885) | (21,380) | |
Total administrative expenses |
| (9,170) | (10,885) | (21,380) | |
Other gains / (losses) | 8 | 77 | 154 | 166 | |
Operating (loss) |
| (1,680) | (2,612) | (5,212) | |
Finance income | 9 | 120 | 62 | 293 | |
Finance costs | (51) | (67) | (105) | ||
Finance income / (loss) |
| 69 | (5) | 188 | |
Share of results of associate | - | - | - | ||
(Loss) before tax |
| (1,611) | (2,617) | (5,024) | |
Income tax credit | 10 | - | 154 | 2,898 | |
(Loss) for the period |
| (1,611) | (2,463) | (2,126) | |
(Loss) attributable to: | |||||
Owners of the parent | (1,611) | (2,463) | (2,126) | ||
Non-controlling interest | - | - | |||
(Loss) for the period attributable to continuing operations |
| (1,611) | (2,463) | (2,126) | |
DISCONTINUED OPERATIONS |
|
|
|
| |
(Loss) from discontinued operation (attributable to equity holders of the company) | 5 | - | (518) | (326) | |
Total (Loss) attributable to the owners of the parent during the period | (1,611) | (2,981) | (2,452) | ||
Continuing operations (loss) per ordinary share attributable to the owners of the parent during the period | |||||
Share Class* |
| RVRG | RVRB | ASTO | ASTO |
Basic - pence | 11 | (1.94) | 0.82 | (1.72) | (1.48) |
Diluted - pence | 11 | (1.94) | 0.82 | (1.72) | (1.48) |
Discontinued operations (loss) per ordinary share attributable to the owners of the parent during the period | |||||
Share Class* |
| RVRG | RVRB | ASTO | ASTO |
Basic - pence | 11 | - | - | (0.36) | (0.23) |
Diluted - pence | 11 | - | - | (0.36) | (0.23) |
Total (Loss) per ordinary share attributable to the owners of the parent during the period | |||||
Share Class* |
| RVRG | RVRB | ASTO | ASTO |
Basic - pence | 11 | (1.94) | 0.82 | (2.08) | (1.71) |
Diluted - pence | 11 | (1.94) | 0.82 | (2.08) | (1.71) |
* As described within the Chairmans Statement the Company now trades under two share classes (previously one (ASTO)). They are; A Ordinary Shares (RVRG) and B Shares (RVRB). Results have been presented accordingly with further details available within note 11 of these results.
CONSOLIDATED STATEMENT OF COMPREHENSIVE INCOME
|
| Six months ended | Year ended | |
|
|
Unaudited 31 March 2025 £'000 | Unaudited 31 March 2024£'000 | Audited 30 September 2024 £'000 |
(Loss) for the period | (1,611) | (2,981) | (2,452) | |
Total comprehensive (loss)/ for the period | (1,611) | (2,981) | (2,452) | |
Attributable to: | ||||
Owners of the parent | (1,611) | (2,981) | (2,452) | |
Total comprehensive (loss) for the period | (1,611) | (2,981) | (2,452) | |
CONSOLIDATED AND COMPANY'S STATEMENT OF FINANCIAL POSITION
Unaudited 31 March 2025 £'000 | Unaudited 31 March 2024 £'000 | Audited 30 September 2024 £'000 | ||
Assets | ||||
Non-current assets | ||||
Property, plant and equipment | 181 | 84 | 75 | |
Right-of-use assets | 1,146 | 1,048 | 766 | |
Goodwill and intangible assets | 16,059 | 16,834 | 16,446 | |
Deferred tax asset | 1,468 | - | 1,546 | |
Investment in associates | 28,362 | 25,820 | 27,049 | |
Total non-current assets | 47,216 | 43,786 | 45,882 | |
Current assets | ||||
Trade and other receivables | 3,774 | 5,242 | 5,821 | |
Assets held for sale | - | 379 | - | |
Financial assets at fair value through profit and loss | 41 | 9 | 93 | |
Current income tax receivable | - | - | - | |
Cash and cash equivalents | 8,542 | 11,241 | 8,727 | |
Total current assets | 12,357 | 16,871 | 14,641 | |
Total assets | 59,573 | 60,657 | 60,523 | |
Liabilities | ||||
Non-current liabilities | ||||
Lease liabilities | 782 | 577 | 290 | |
Deferred tax liabilities | 1,468 | 1,651 | 1,546 | |
Total non-current liabilities | 2,250 | 2,228 | 1,836 | |
Current liabilities | ||||
Trade and other payables | 4,799 | 2,973 | 4,631 | |
Liabilities held for sale | - | 987 | - | |
Lease liabilities | 428 | 631 | 569 | |
Current income tax liabilities | 368 | 1,517 | 368 | |
Total current liabilities | 5,595 | 6,108 | 5,568 | |
Total liabilities | 7,845 | 8,336 | 7,404 | |
Equity Shareholders' equity | ||||
Issued share capital | 1,493 | 1,493 | 1,493 | |
Share premium | 209 | 209 | 209 | |
Capital redemption reserve | 653 | 653 | 653 | |
Merger reserve | 43,063 | 43,063 | 43,063 | |
Other reserve | 832 | 340 | 612 | |
Retained earnings | 5,478 | 6,563 | 7,089 | |
Total equity | 51,728 | 52,321 | 53,119 | |
Total equity and liabilities | 59,573 | 60,657 | 60,523 | |
CONSOLIDATED STATEMENT OF CHANGES IN EQUITY
Share capital £'000 | Share premium £'000 | Capital redemption reserve £'000 | Merger reserve £'000 | Other reserve £'000 | Retained earnings £'000 | Total £'000 | |
Balance at 1 October 2023 | 1,493 | 209 | 653 | 43,063 | 95 | 8,429 | 53,942 |
Loss for the period | - | - | - | - | - | (2,981) | (2,981) |
Total comprehensive (loss) | - | - | - | - | - | (2,981) | (2,981) |
IFRS2 share scheme charge | - | - | - | - | 245 | - | 245 |
Treasury shares used in ODAM consideration (note 12) | - | - | - | - | - | 1,115 | 1,115 |
Unaudited at 31 March 2024 | 1,493 | 209 | 653 | 43,063 | 340 | 6,563 | 52,321 |
Profit for the period | - | - | - | - | - | 526 | 526 |
Total comprehensive profit for the period | - | - | - | - | - | 526 | 526 |
IFRS2 share scheme charge | - | - | - | - | 272 | - | 272 |
Audited Balance at 30 September 2024 | 1,493 | 209 | 653 | 43,063 | 612 | 7,089 | 53,119 |
|
|
|
|
|
|
|
|
Loss for the period | - | - | - | - | - | (1,611) | (1,611) |
Total comprehensive (loss) for the period | - | - | - | - | - | (1,611) | (1,611) |
|
|
|
|
|
|
|
|
IFRS2 share scheme charge | - | - | - | - | 220 | - | 220 |
Unaudited balance at 31 March 2025 | 1,493 | 209 | 653 | 43,063 | 832 | 5,478 | 51,728 |
CONSOLIDATED AND COMPANY'S STATEMENT OF CASH FLOWS
Notes |
Unaudited 31 March 2025 £'000 | Unaudited 31 March 2024 £'000 | Audited 30 September 2024 £'000 | |
Cash flows from operating activities | ||||
Cash (outflow) from continuing operations | (2,513) | (4,620) | (8,230) | |
Corporation tax received | - | - | 1,159 | |
Net cash (outflow) from Continuing Operations | (2,513) | (4,620) | (7,071) | |
Net cash inflow / (outflow) from Discontinued Operations | - | (518) | (326) | |
Net cash (outflow) from total operations | (2,513) | (5,138) | (7,397) | |
Cash flows from investing activities | ||||
Net cash received from acquisitions & disposals | 12 | 2,650 | (1,822) | (1,822) |
Payments for deferred consideration (SVM) | - | (7,000) | (7,000) | |
Finance income | 9 | 120 | 62 | 293 |
Finance costs | (51) | (67) | (105) | |
Proceeds from sale of investment at fair value through profit and loss | - | - | (79) | |
Purchase of intangibles | - | - | (39) | |
Net cash inflow /(outflow) from investing activities | 2,719 | (8,827) | (8,752) | |
Cash flows from financing activities | ||||
Lease payments | (391) | (367) | (697) | |
Payments for treasury shares | - | |||
Net cash (outflow)/inflow from financing activities | (391) | (367) | (697) | |
Net change in cash and cash equivalents | (185) | (14,332) | (16,846) | |
Cash and cash equivalents at beginning of period | 8,727 | 25,573 | 25,573 | |
Cash and cash equivalents at end of period | 8,542 | 11,241 | 8,727 | |
The comparative has been restated to show the payment for deferred consideration of SVM separately in the cash flow statement. For the period ended 31 March 2024 this restatement has increased Cash flows from operating activities by £7,000,000. The corresponding cash outflow is now shown within investing activities.
NOTES TO THE FINANCIAL STATEMENTS
1. General information and basis of presentation
River Global PLC ("River Global" or the "Company") is the Parent Company of a group of companies ("the Group") which offers a range of investment services to private and institutional investors. The Company is a public limited company, incorporated and domiciled in the United Kingdom under the Companies Act 2006 and is listed on the Alternative Investment Market ("AIM") of the London Stock Exchange. The address of its registered office is 30 Coleman Street, London, EC2R 5AL.
On 6 March 2025 the Company approved a share split which divided each of its Ordinary Shares into one A Ordinary Share, representing the Company's asset management business, and one B share representing the Company's interest in Parmenion. Further details are set out below. The financial statements have been presented in sterling to the nearest thousand pounds (£000) except where otherwise indicated.
The financial information in the Half-year Report has been prepared using the recognition and measurement principles of the UK-adopted International Accounting standards and in conformity with the requirements of the Companies Act 2006. The principal accounting policies used in preparing the Half-year Report are those the Company expects to apply in its financial statements for the year ending 30 September 2025 and are unchanged from those disclosed in the Annual Report and Financial Statements for the year ended 30 September 2024.
The financial information for the six months ended 31 March 2025 and the six months ended 31 March 2024 is unaudited and does not constitute the Group's statutory financial statements for those periods. The comparative financial information for the full year ended 30 September 2024 has, however, been derived from the audited statutory financial statements for that period. A copy of those statutory financial statements has been delivered to the Registrar of Companies.
While the financial figures included in this Half-year Report have been computed in accordance with IFRSs applicable to interim periods, this Half-year Report does not contain sufficient information to constitute an interim financial report as that term is defined in IAS 34.
Functional and presentation currencyItems included in the financial statements of each of the Company's businesses are measured using the currency of the primary economic environment in which the entity operates ("the functional currency"). The financial statements are presented in sterling (£), which is the Company's and the Group's functional and presentation currency. There has been no change in the Company's functional or presentation currency during the period under review.
Foreign operations translationThe financial statements are prepared in sterling. Income statements of foreign operations are translated into sterling at the average exchange rates for the period and balance sheets are translated into sterling at the exchange rate ruling on the balance sheet date. Foreign exchange gains or losses resulting from such translation are recognised through other comprehensive income.
Discontinued Operations & Held for sale assetsAt 31 March 2024 the Group classified its Infrastructure business as held for sale. The business was disposed of by 30 September 2024. The results for the business have been shown under Discontinued Operations comparative periods of these accounts.
2. CRITICAL ACCOUNTING ESTIMATES AND JUDGEMENTS
Estimates and judgements are continually evaluated and are based on historical experience and other factors, including expectations of future events that are believed to be reasonable under the circumstances. This note provides an overview of the areas that involved a higher degree of judgement or complexity, and of items which are more likely to be materially adjusted due to estimates and assumptions turning out to be wrong.
a. SIGNIFICANT ESTIMATES
VALUATION OF GOODWILL AND OTHER INTANGIBLE ASSETSDetermining the valuation of goodwill and intangible assets arising from a business combination under IFRS 3 contains elements of judgement The Group has acquired customer relationships, acquired brands and computer software included within intangible assets as part of the business combinations.
IMPAIRMENT OF GOODWILL AND OTHER INTANGIBLE ASSETS AND RECOVERABILITY OF COMPANY'S INVESTMENT IN SUBSIDIARIESThe recognition of goodwill and other intangible assets arising on acquisitions and the impairment assessments contain significant accounting estimates. Goodwill is carried at cost less provision for impairment, the carrying value is tested annually for impairment, or more frequently if any indicators arise. Other intangible assets are amortised over their useful economic life and are assessed for impairment when there is an indication that the asset might be impaired. The impairment test of goodwill and other intangible assets includes key assumptions underlying the recoverable amounts, the growth rates applied to the future cash flows and the Group's discount rate.
ESTIMATION OF CURRENT TAX PAYABLE AND CURRENT TAX EXPENSE IN RELATION TO AN UNCERTAIN TAX POSITIONThe Group's corporation tax provision for 2025 now stands at £343,000 (2024: £1,442,000) and relates to management's assessment of the amount of tax payable on open positions where the liabilities remain to be agreed with relevant tax authorities - principally due to the Grant Thornton litigation which concluded in 2021. Uncertain tax items for which the provision is made relates principally to the interpretation applicable to arrangements entered into by the Group including the application of carried forward losses before 1 April 2017 derived from HMRC guidance on this matter. Due to uncertainty associated with such tax items, it is possible that, on conclusion of open tax matters at a future date, the final outcome may differ. Whilst a range of outcomes is possible, management does not expect the maximum possible tax payable to exceed £343,000. At a minimum tax payable could be £nil resulting in a reduction in liabilities of up to £343,000.
b. SIGNIFICANT JUDGEMENTS
GOING CONCERN ASSUMPTIONSInputs, including stresses, management actions and forecasting all require significant judgement in concluding on going concern. These have been set out in more detail in note 3.
3. GOING CONCERN
The Group is currently loss making, albeit with a trajectory that evidences improving operational losses over time and which affords a pathway to profitability. Against this background, the Directors have given careful consideration to the going concern assumption on which the Group's accounts have been prepared. Having carefully considered the Group's operational and regulatory requirements, the Directors have concluded that the Group has adequate financial resources to continue operating for the 12 months from the date of signing these financial statements. On that basis the Directors have continued to adopt the Going Concern basis of accounting in preparing the consolidated Group and Company accounts.
As part of this review, the Directors have prepared projections rolling forward more than two years from the date of signing for the Company and Group under several scenarios from growth to stressed environments. The latter includes a fall of 30% in assets under management over the 2026 financial year. Although management actions are envisaged in the projections, these actions had previously been identified by management and are in course of implementation. The projections demonstrate the Group's ability to continue as a going concern well beyond the required 12 months from the date of signing. For the purpose of this assessment, management made conservative assumptions regarding future growth. The ability to achieve cost saving measures and the reasonableness of the stress testing applied was considered in the light of those assumptions. Sensitivity analysis and modelling to take account of specific one-off risks to the Group and Company was undertaken in line with the principal risks and uncertainties.
In the event that profitability is not achieved, there will be an increased risk to the going concern assessment in subsequent reporting periods. The Group is required to hold a minimum level of regulatory capital together with a buffer of at least a 10% at all times. As at 31 March 2025, the regulatory capital requirement for the Group was just over £4.5m.
The Directors also acknowledge less resilience within the Group to one-off shocks and macroeconomic events while losses continue. Current initiatives, outlined in the Chairman's Statement and Business Review, will deliver further cost savings and the Directors are committed to reviewing the business model as necessary to respond to future business developments. Should there be a need for additional capital, the directors have the option of seeking to raise additional capital, of considering potential partnerships or of re-structuring the business.
4. Segmental Reporting
The core principle of IFRS 8 'Operating segments' is to require an entity to disclose information that enables users of the financial statements to evaluate the nature and financial effects of the business activities in which the entity engages and the economic environments in which it operates.
Segment information has historically been presented in respect of the Group's commercial competencies, Active equities, Infrastructure asset management, Exchange Traded Funds and its investment in Digital Platforms (Parmenion).
Active equities comprises the River Global equities business.
The Directors consider that the chief operating decision maker is the Board. Head Office segment comprises the Group Board's management and associated costs and consolidation adjustments.
Changes to segmental reportingBy 30 September 2023 the US business has been sold alongside Rize ETF Limited. In addition, the Infrastructure business was sold in the year ended 30 September 2024. Further detail of these Discontinued Operations can be found in note 1.
The segmental analysis for 31 March 2025 has changed to reflect the recent change in share structure and consequently the segmental reporting tables now reflect those new share classes:
- From the inception of the new share classes (6th March 2025) recharges for costs attributable to maintaining and operating the respective share interests have been applied and will be periodically reviewed by the Board to ensure they remain appropriate. Head office costs, previously reported as a separate segment, are now allocated between the share classes.
- Earnings before interest, tax, depreciation and amortisation (EBITDA) have been included within the segmental analysis for the first time, with comparative information also provided. EBITDA is calculated by taking statutory operating losses (or profits) and adding back any interest, depreciation on non-lease fixed assets and amortisation costs. In the case of the B Shares the accrued earnings (which constitute loan interest, received in the form of additional loan notes) from the Group's investment in Parmenion are included within this EBITDA figure. A reconciliation of the EBITDA figure to statutory operating losses (or profits) has been shown within note 7.
ANALYSIS OF REVENUE AND RESULTS BY COMMERCIAL ACTIVITYFor the six months ended 31 March 2025
A Shares | B Shares | Total | |
Equities £'000 | Digital Platform £'000 | Total £'000 | |
Revenue: Net management fees | 6,101 | - | 6,101 |
Revenue: Loan interest | - | 1,312 | 1,312 |
Allocation of central overheads | (652) | (131) | (783) |
EBITDA for the period | (2,446) | 1,181 | (1,265) |
Operating (loss)/profit for the period | (2,861) | 1,181 | (1,680) |
(Loss)/profit for the period | (2,792) | 1,181 | (1,611) |
Exceptional items (within administrative expenses) | (949) | (103) | (1,052) |
Total assets | 31,040 | 28,533 | 59,573 |
Total liabilities | (7,714) | (131) | (7,845) |
Total net assets/(liabilities) | 23,326 | 28,402 | 51,728 |
For the six months ended 31 March 2024 (Restated)
| Active equities £'000 | Infrastructure asset management £'000 | Restated Digital Platform £'000 | Restated Head office £'000 | Total £'000 |
Revenue: Net management fees | 6,926 | 362 | - | - | 7,288 |
Revenue: Loan interest | - | - | 1,194 | - | - |
EBITDA for the period | (2,143) | (518) | 1,194 | (1,333) | (2,800) |
Operating (loss)/profit for the period | (2,473) | (518) | 1,194 | (1,333) | (3,130) |
(Loss)/profit for the period | (2,506) | (518) | 1,194 | (1,151) | (2,981) |
Exceptional items (within administrative expenses) | n/a | n/a | n/a | n/a | (967) |
Total assets | 32,117 | 379 | 25,820 | 2,341 | 60,657 |
Total liabilities | (4,068) | (987) | - | (3,281) | (8,336) |
Total net assets/(liabilities) | 28,049 | (608) | 25,820 | (940) | 52,321 |
The segmental results for the six months ended 31 March 2024 have been restated to disaggregate the Head Office and Digital Platform (Parmenion investment) segments. This restatement has not resulted in a change to the results of the Company for the period. Exceptional items and central head office costs were not separately broken down by segment for the period.
ANALYSIS OF REVENUE AND RESULTS BY COMMERCIAL ACTIVITYAUDITED For the year ended 30 September 2024
| Active equities £'000 | Digital platform £'000 | Head office £'000 | Discontinued Operations £'000 | Total £'000 |
Revenue | |||||
Management fees | 13,845 | - | - | 523 | 14,368 |
Total revenue | 13,845 | - | - | 523 | 14,368 |
Segment result | |||||
Operating (loss)/profit | (7,232) | 2,423 | (403) | (325) | (5,537) |
Finance income | 293 | - | - | 3 | 296 |
Finance costs | (87) | - | (18) | (4) | (109) |
(Loss)/profit before tax | (7,026) | 2,423 | (421) | (326) | (5,350) |
Income tax | - | - | 2,898 | - | 2,898 |
(Loss)/profit for the year | (7,026) | 2,423 | 2,477 | (326) | (2,452) |
EBITDA for the year | (6,313) | 2,423 | (403) | (325) | (4,293) |
Segment assets and liabilities | |||||
Total assets | 30,752 | 27,049 | 2,722 | - | 60,523 |
Total liabilities | (6,873) | - | (531) | - | (7,404) |
Total net assets | 23,879 | 27,049 | 2,191 | - | 53,119 |
5. Discontinued Operations
Within the year ended 30 September 2024 one business was sold and has been classified as Discontinued Operations under IFRS 5. This is the Infrastructure business who's operating results are shown in note 5.
Under these standards the Discontinued Operations have been separately identified on the face of the Financial Statements and have been disclosed below to help the users of the accounts better understand the continuing operations of the Group.
2024 £'000 | |
River and Mercantile Infrastructure LLP & River and Mercantile Infrastructure GP S.a.r.l. | (326) |
(Loss) from discontinued operation (attributable to equity holders of the company) | (326) |
Operating cashflows | ||
| 31 March 2025 £'000 | 2024 £'000 |
River and Mercantile Infrastructure LLP & River and Mercantile Infrastructure GP S.a.r.l. | - | (326) |
Operating cash (outflow) from Discontinued Operations | - | (326) |
Deferred cash consideration received for Rize ETF Limited | 2,650 | - |
During the period the Company received £2,650,000 as deferred consideration for its sale of Rize ETF Limited in the year ended 30 September 2023. Although there remains an earn-out consideration to this sale as at 31 March 2025, no value has been recognised on the balance sheet with respect to it.
6. Other Income
Unaudited 31 March 2025 £'000 | Unaudited 31 March 2024 £'000 | Audited 30September 2024 £'000 | |
Interest on loan notes held in associate | 1,312 | 1,193 | 2,423 |
Other income | - | - | 225 |
Total other income | 1,312 | 1,193 | 2,648 |
Interest on loan notes held in associate
As set out in the full 2023 financial statements of the Group; the Group has acquired a 30% equity interest in Parmenion Capital Partners LLP via a corporate entity, Shillay TopCo Limited. A large part of the Group's total investment is held by way of loan notes.
During the period the Group recognised £1,312,000 (31 March 2024: £1,193,000) of interest on those loan notes and this is reflected in other income.
7. Administrative expenses and exceptional items
Included with administrative expenses are exceptional items as shown below:
Unaudited 31 March 2025 £'000 | Unaudited 31 March 2024 £'000 | Audited 30September 2024 £'000 | |
Restructuring costs | 1,052 | 967 | 1,881 |
One-off recognition of deferred tax asset | - | - | (1,805) |
Provision releases for corporation tax | - | - | (1,094) |
Exceptional items | 1,052 | 967 | (1,018) |
|
|
|
|
Exceptional items within administrative expenses | 1,052 | 967 | 1,881 |
Share-based payment expense and social security | 268 | 279 | 568 |
Other administrative expenses | 7,850 | 9,639 | 18,931 |
Total administrative expenses | 9,170 | 10,885 | 21,380 |
Restructuring costs include, salaries of employees being made redundant from the point of notice of redundancy, severance costs, costs associated with the implementation of the new target operating model.
New lease agreements
On 24 December 2024 new lease agreements were signed for Coleman Street affecting both the 3rd floor and 4th floor. The 4th floor of Coleman Street is to be exited ahead of the original contractual end date with a reduction in the amount payable as a result. The 3rd floor lease was extended to at least 13 January 2029. The net impact of these agreements was a recognition of £124,249 in the income statement and recognition of £1,126,481as a right of use asset and corresponding lease liability.
A further breakdown of administrative costs has been provided below to show staff costs, amortisation and depreciation:
Unaudited 31 March 2025 £'000 | Unaudited 31 March 2024 £'000 | Audited 30 September 2024 £'000 | |
Staff costs | 4,793 | 4,505 | 10,825 |
Amortisation and depreciation | 415 | 330 | 920 |
Other administrative costs | 3,962 | 6,050 | 9,635 |
Total administrative expenses | 9,170 | 10,885 | 21,380 |
A reconciliation of EBITDA to statutory operating loss is shown below;
Unaudited 31 March 2025 £'000 | Unaudited 31 March 2024 £'000 | Audited 30September 2024 £'000 | |
Operating (loss) for continuing operations | (1,680) | (2,612) | (5,212) |
Amortisation and depreciation | 415 | 330 | 920 |
EBITDA for continuing operations | (1,265) | (2,282) | (4,292) |
8. Other Gains and Losses
Unaudited 31 March 2025 £'000 | Unaudited 31 March 2024 £'000 | Audited 30September 2024 £'000 | |
(Reduction) in fair value of assets | (75) | (5) | - |
Gain on disposal of fair value investments | 152 | 159 | 166 |
77 | 154 | 166 |
9. Finance income
Finance income from continuing operations was: |
Unaudited 31 March 2025 £'000 | Unaudited 31 March 2024 £'000 | Audited 30September 2024 £'000 |
Interest income | 120 | 62 | 293 |
120 | 62 | 293 |
10. Income Tax
Unaudited 31 March 2025 £'000 | Unaudited 31 March 2024 £'000 | Audited 30September 2024 £'000 | |
Current tax | |||
Provision release for corporation tax enquiry | (1,094) | ||
Current tax on (loss)/profits for the period | - | - | - |
Total current tax expense/(credit) | - | - | (1,094) |
Deferred tax | |||
Continuing operations | - | (154) | (1,805) |
Total deferred tax (credit)/expense | - | (154) | (1,805) |
Income tax (credit)/expense | - | (154) | (2,898) |
11. Loss & earnings per share
On 6 March 2025 the Company approved a share split which divided each of its Ordinary Shares into one A Ordinary Share (RVRG), representing the Company's asset management business, and one B share (RVRB) representing the Company's interest in Parmenion.
Consequently earnings per share disclosures are to be presented based on the respective rights of those share classes to the loss or profits of the Group with results for each share class set out in note 4 of the financial statements.
Allocation of loss and profits by share class are shown below:
Continuing Operations |
Unaudited 31 March 2025 £'000 | Unaudited 31 March 2024 £'000 | Audited 30 September 2024 £'000 |
(Loss) attributable to Ordinary Shares | - | (2,463) | (2,126) |
(Loss) Profit attributable to A Ordinary Shares (note 4) | (2,792) | - | - |
Profit attributable to B Shares (note 4) | 1,181 | - | - |
(Loss) from continuing operations attributable to owners of the parent (£'000) | (1,611) | (2,463) | (2,126) |
Discontinued Operations |
Unaudited 31 March 2025 £'000 | Unaudited 31 March 2024 £'000 | Audited 30 September 2024 £'000 |
(Loss) attributable to Ordinary Shares | - | (518) | (326) |
(Loss) Profit attributable to A Ordinary Shares (note 4) | - | - | - |
Profit attributable to B Shares (note 4) | - | - | - |
(Loss) from discontinued operations attributable to owners of the parent (£'000) | - | (518) | (326) |
Total |
Unaudited 31 March 2025 £'000 | Unaudited 31 March 2024 £'000 | Audited 30 September 2024 £'000 |
(Loss) attributable to Ordinary Shares | - | (2,981) | (2,452) |
(Loss) Profit attributable to A Ordinary Shares (note 4) | (2,792) | - | - |
Profit attributable to B Shares (note 4) | 1,181 | - | - |
(Loss) from operations attributable to owners of the parent (£'000) | (1,611) | (2,981) | (2,452) |
Basic
Basic earnings per share is calculated by dividing the (loss)/profit attributable to owners of the parent by the weighted average number of Ordinary Shares in issue during the year. The weighted average number of shares is calculated by reference to the length of time shares are in issue taking into account the issue date of new shares and any buybacks. The prior year has been restated to split out continuing and discontinued operations.
Unaudited 31 March 2025 £'000 | Unaudited 31 March 2024 £'000 | Audited 30September 2024 £'000 | ||
RVRG | RVRB |
|
| |
(Loss)/profit from continuing operations - £000 | (2,792) | 1,181 | (2,463) | (2,126) |
(Loss)/profit from discontinued operations - £000 | - | - | (518) | (326) |
Total (loss) attributable to owners of the parent | (2,792) | 1,181 | (2,981) | (2,452) |
Weighted average number of ordinary shares in issue post share split - no. | 143,938,200 | 143,938,200 | 142,962,114 | 143,446,157 |
Basic earnings per share from continuing operations - pence | (1.94) | 0.82 | (1.72) | (1.48) |
Basic earnings per share from discontinued operations - pence | - | - | (0.36) | (0.23) |
Total basic earnings per share | (1.94) | 0.82 | (2.08) | (1.71) |
Diluted
Diluted earnings per share is calculated by adjusting the weighted average number of Ordinary Shares in issue assuming conversion of all dilutive potential Ordinary Shares.
Unaudited 31 March 2025 £'000 | Unaudited 31 March 2024 £'000 | Audited 30September 2024 £'000 | ||
RVRG | RVRB |
|
| |
(Loss)/profit from continuing operations - £000 | (2,792) | 1,181 | (2,463) | (2,126) |
(Loss)/profit from discontinued operations - £000 | - | - | (518) | (326) |
Total (loss) attributable to owners of the parent | (2,792) | 1,181 | (2,981) | (2,452) |
Weighted average number of ordinary shares in issue post share split - no. | 143,938,200 | 143,938,200 | 142,962,114 | 143,446,157 |
Diluted earnings per share from continuing operations - pence | (1.94) | 0.82 | (1.72) | (1.48) |
Diluted earnings per share from discontinued operations - pence | - | - | (0.36) | (0.23) |
Total diluted earnings per share | (1.94) | 0.82 | (2.08) | (1.71) |
12. Business Combination
ODAM
On 2nd October 2023 AssetCo plc completed its acquisition of the entire share capital and 100% voting rights of Ocean Dial Asset Management ("ODAM"). ODAM is an active equities fund manager of the fund India Capital Growth Fund ("IGC").
Details of the purchase consideration are as follows:
ODAM £'000 | |
Cash paid | 2,464 |
Shares paid | 556 |
Deferred shares (paid 30 January 2024) | 556 |
Total consideration | 3,576 |
The fair value of assets and liabilities recognised as a result of the acquisition are as follows:
ODAM £'000 | |
Cash | 642 |
Trade and other receivables | 211 |
Plant and equipment | 2 |
Trade payables | (76) |
Other payables | (111) |
Total net assets recognised on acquisition | 668 |
Fair value adjustments | |
Intangible assets: customer relationships | 3,600 |
Deferred tax liability | (900) |
Net identifiable assets/(liabilities) acquired | 2,700 |
Goodwill | 208 |
Net assets acquired | 3,576 |
Acquired receivables
The fair value of acquired receivables was £211,000, primarily made up of accrued income and no loss allowance has been recognised on acquisition.
Customer relationships & management contracts
The initial recognition of the management contract held by Ocean Dial was calculated based on a Multi-period Excess Earnings Method ("MEEM"), estimating a useful life of 12 years for the contract. Management developed a cash flow forecast based on expectations from the year of acquisition making use of historical analysis and management experience in the industry. Revenue growth was estimated on a conservative basis of 2% per Annum offset by a biennial AUM redemption of incrementally larger severity over the years (increasing from 2.5% to 30% redemptions by 2035) representing the shareholders biennial continuation vote; based on management experience, historical analysis of previous voting results and increased probability of redemptions over time. An assumed weighted average cost of capital of 19% was applied, a premium relative to the wider Group's business reflecting the size and equity risk premium associated with the Ocean Dial Business. A deferred tax liability has been recognised in respect of this asset.
Revenue and profit contribution
The business was accounted for from the date of acquisition (2nd October 2023). This is the first working day of the financial year of the Group and consequently the revenue and operating results of the Group would have been unaffected by accounting for the acquisition from 1st October 2023.
Revenue for the 12 months ended 30 September 2024 was £1,926,000 and contributing £1,049,000 to the profit before tax of the Group.
Purchase consideration - cash outflow
Outflow of cash to acquire subsidiaries, net of cash acquired
2024 £'000 | 2023 £'000 | |
Cash consideration | 2,464 | 2,216 |
Less: balances acquired | (642) | (5,017) |
Net outflow / (inflow) of cash - investing activities | 1,822 | (2,801) |
Deferred consideration paid for acquisitions - SVM | 7,000 | - |
Total paid / (received) in year relating to acquisitions | 8,822 | (2,801) |
Acquisition-related costs
Directly attributable acquisition related costs for ODAM were £25,000 including those not directly attributable to the issue of shares. Incidental costs are included in administrative expenses in the income statement.
13. Reconciliation of losses and profits before tax to net cash inflow from operations
Unaudited 31 March 2025 £'000 | Unaudited Restated 31 March 2024 £'000 | Audited 30 September 2024 £'000 | |
(Loss)/profit for the year before taxation | (1,611) | (2,617) | (5,024) |
Share-based payments in respect of LTIP | 220 | - | 517 |
Interest received from associate | (1,313) | - | (2,423) |
Increase in investments | - | (4,794) | - |
Reduction in fair value of investments | 52 | 4 | (2) |
Purchase of property, plant and equipment | (122) | - | - |
Adjustments to lease liability | 708 | - | - |
Adjustments to right-of-use assets | (667) | - | - |
Depreciation | 16 | 14 | 23 |
Amortisation of intangible assets | 387 | 320 | 897 |
Amortisation of right-of-use assets | 287 | 486 | 768 |
Finance costs | 85 | 67 | - |
Movement in foreign exchange | - | - | 21 |
Finance income | (120) | (62) | (293) |
Provision release for corporation tax | - | - | (1,094) |
Decrease in receivables | (603) | 832 | 190 |
(Decrease)/increase in payables | 168 | 1,130 | (1,810) |
Cash (outflow)/inflow from continuing operations | (2,513) | (4,620) | (8,230) |
The comparative has been restated to show the payment for deferred consideration of SVM separately in the cash flow statement. For the period ended 31 March 2024 this restatement has increased Cash flows from operating activities by £7,000,000 with a corresponding cash outflow shown within investing activities and no change to the total cash flows in the period.
Related Shares:
River Global BRiver Global A